
Research article · 2025 · Full text
International Journal of Advanced Chemistry ResearchRheological and textural properties of gluten-free bread formulations
Volume 7(3) · Pages 82–84 · DOI: 10.33545/26646781.2025.v7.i3b.395 ↗
Research areasFood composition and propertiesSeed and Plant BiochemistryPolysaccharides Composition and Applications
Abstract
Author-writtenRemoving gluten from bread sounds simple just leave out the wheat but the result is almost always a dense, crumbly loaf that falls apart on the plate. Gluten provides the viscoelastic network that traps fermentation gases, and no single substitute replicates it fully. This research evaluated the rheological behaviour of four gluten-free doughs and the textural quality of the resulting breads, using wheat bread as a control. Formulations combined rice flour with corn flour (70:30), buckwheat flour (60:40), or quinoa flour (50:50), all supplemented with 2% hydroxypropyl methylcellulose (HPMC) as a structure builder. Dynamic oscillatory rheology showed that storage modulus (G’) ranged from 342 Pa for pure rice to 591 Pa for the rice-quinoa blend, compared with 724 Pa for wheat. Bread loaf volumes ran from 287 mL (rice only) to 358 mL (rice-quinoa), versus 412 mL for wheat. Texture profile analysis gave hardness values of 8.3-14.1 N across gluten-free loaves, still below the wheat control’s 18.6 N. The rice-quinoa (50:50) formulation came closest to wheat bread on most quality measures and may serve as a practical base for further optimization.
Summary
Source-checkedPlain-language reading of the full paper, prepared with AI and checked against the text. Each point links to the authors' own words.
Why it matters
- A significant portion of the global population, including approximately 1% with coeliac disease and 6-10% with non-coeliac gluten sensitivity, cannot consume gluten. View evidence ↗
- Gluten is essential for bread structure because its proteins create a viscoelastic network that traps carbon dioxide, enabling the dough to rise and maintain its shape. View evidence ↗
- Despite market growth, commercial gluten-free breads are often perceived by consumers as being gritty, dry, and prone to staling. View evidence ↗
The question
- The study aimed to evaluate the textural quality and rheological behavior of four different gluten-free dough formulations compared to a wheat bread control. View evidence ↗
What they did
- The researchers tested five formulations: pure rice flour, three blends of rice with corn, buckwheat, or quinoa, and a 100% wheat control. View evidence ↗
- Each batch consisted of 200 g of flour with standard amounts of sugar, salt, oil, and yeast; gluten-free versions were supplemented with 4 g of hydroxypropyl methylcellulose (HPMC). View evidence ↗
- Dough rheology was analyzed using a Malvern Kinexus Pro+ rheometer with a frequency sweep from 0.1 to 10 Hz. View evidence ↗
- Texture profile analysis (TPA) was conducted on 25 mm crumb cubes using a TA.XT Plus texture analyzer with 40% compression. View evidence ↗
What they found
- The rice-quinoa blend (F4) had the strongest elastic network among gluten-free options, with a storage modulus (G’) of 591 Pa, which is 82% of the wheat control's 724 Pa. View evidence ↗
- Pure rice flour (F1) exhibited the weakest network (G’ = 342 Pa) and the lowest loaf volume at 287 mL. View evidence ↗
- Hardness for gluten-free loaves ranged from 8.3 to 14.1 N, all of which were lower than the wheat control's hardness of 18.6 N. View evidence ↗
- The rice-quinoa blend (F4) performed best among gluten-free options with a volume of 358 mL and a crumb score of 6.4, though it remained below the wheat control (412 mL, score 7.9). View evidence ↗
- Despite having more protein (13.1%) than rice flour (7.2%), the buckwheat blend (F3) was more viscous, as indicated by the highest tan δ of 0.43. View evidence ↗
- The buckwheat blend produced a darker crumb (L* = 61.8) and a strong flavor, which may reduce consumer appeal. View evidence ↗
What it means
- The authors conclude that the 50:50 rice-quinoa blend is the most effective gluten-free formulation, achieving the highest volume (87% of wheat) and the strongest dough structure. View evidence ↗
Visual summary
3 visualsIllustrations explain the paper; charts are replotted from the paper's own table values.
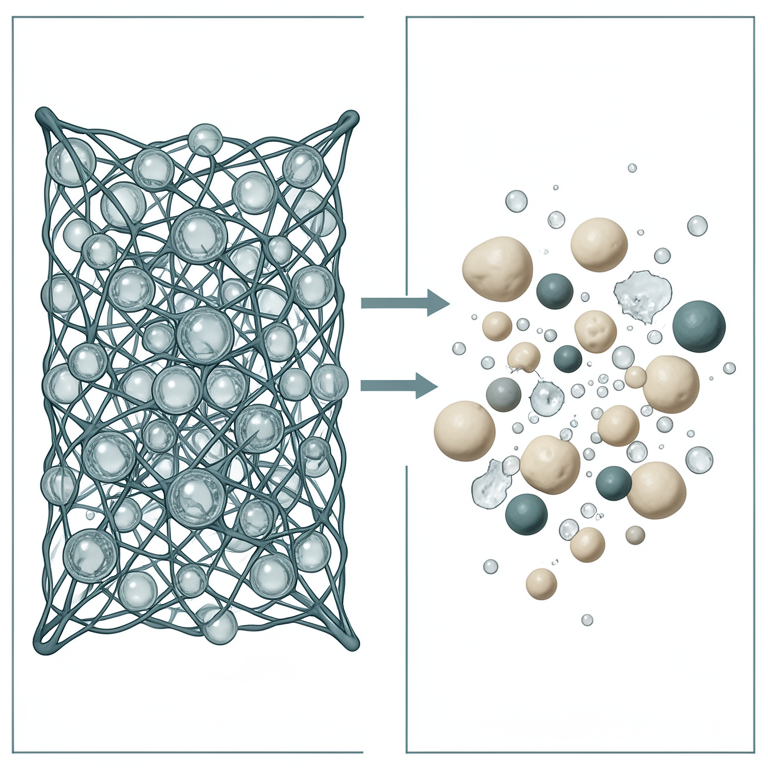
Gluten vs. Gluten-Free Structure
AI-generated conceptual illustration (wheat bread dough and gluten-free bread dough). It explains the idea and does not show study data.
View source evidence ↗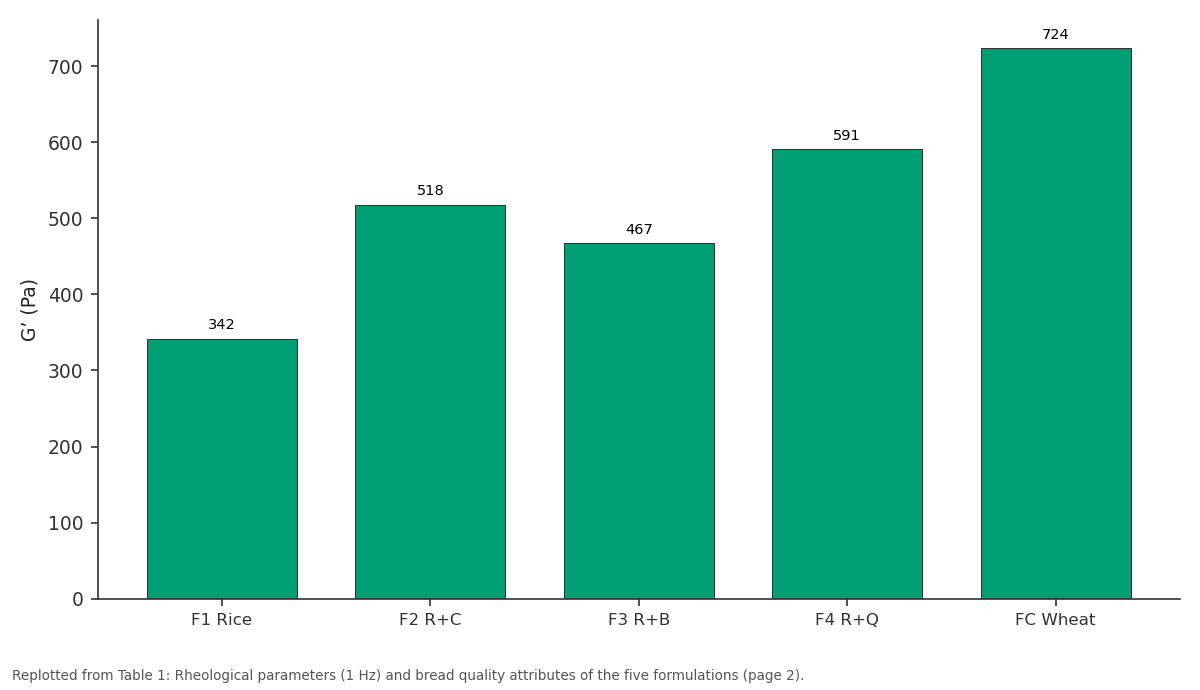
G’ (Pa): F1 Rice vs F2 R+C vs F3 R+B vs F4 R+Q vs FC Wheat
Replotted from Table 1 (page 2) of the original paper. Every bar is the paper's own table value.
View source evidence ↗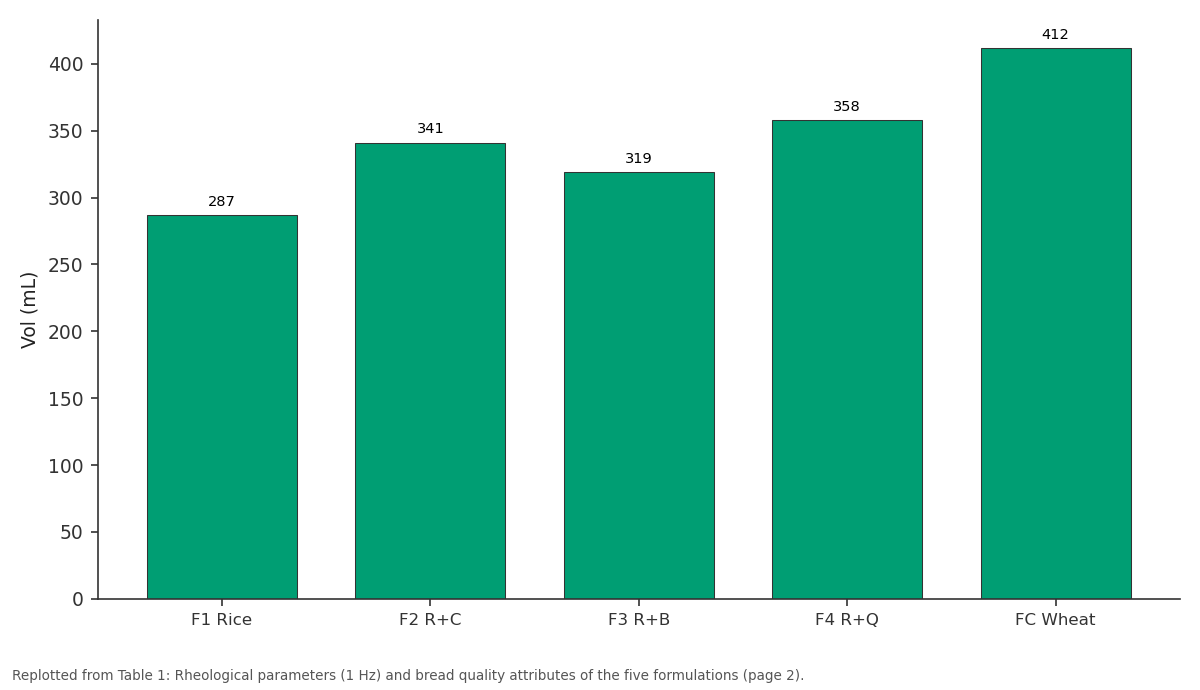
Vol (mL): F1 Rice vs F2 R+C vs F3 R+B vs F4 R+Q vs FC Wheat
Replotted from Table 1 (page 2) of the original paper. Every bar is the paper's own table value.
View source evidence ↗Figures & tables
From the original paper Table 1
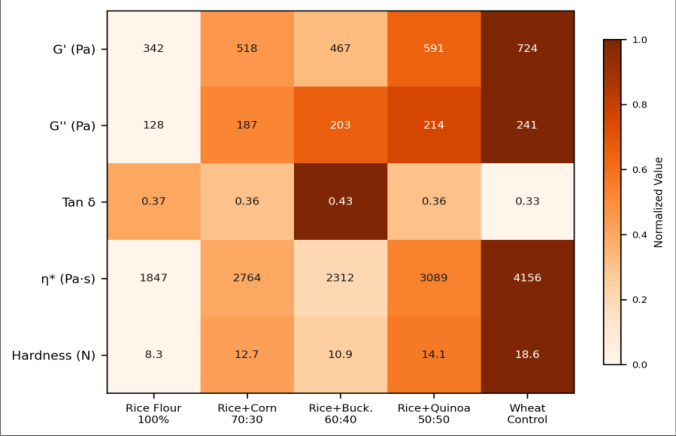 Figure 1
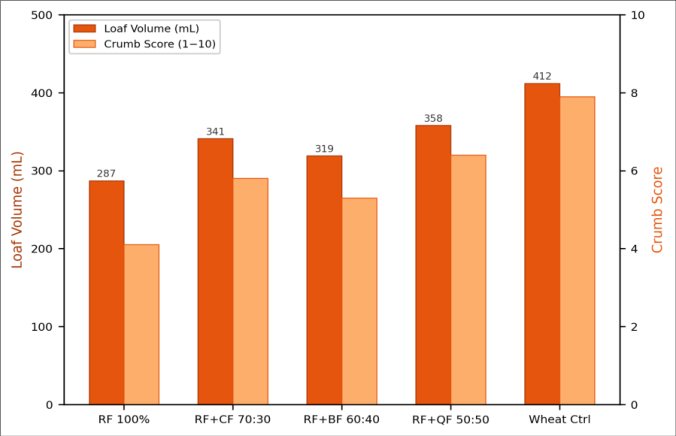 Figure 2
Introduction
About 1% of the global population has coeliac disease, and perhaps another 6-10% report some degree of non-coeliac gluten sensitivity [1] . For these consumers, wheat bread the dietary staple of half the world is off limits. The market for gluten-free baked goods has grown by double digits annually, yet product quality still lags well behind wheat-based equivalents [2] . Consumers often describe commercial gluten-free bread as dry, gritty, and quick to stale. The technical problem is structural. Gluten proteins (gliadin and glutenin) form a continuous viscoelastic network during mixing that stretches around CO₂ bubbles produced by yeast, allowing the dough to rise and retain its shape during baking [3] . Without this network, gas escapes easily, crumb structure collapses, and the loaf turns out flat and dense. Hydrocolloids such as HPMC, xanthan gum, and psyllium husk can partially mimic gluten's role by raising dough viscosity and film-forming ability, but none matches its elasticity [4] . Blending different gluten-free flours is another strategy. Rice flour gives a mild flavour and white crumb but lacks protein content. Quinoa and buckwheat are richer in protein (12-15%) and can improve gas retention and crumb texture [5] . Small-amplitude oscillatory shear (SAOS) rheology measuring G', G'', and tan δ across a frequency sweep offers a quantitative window into dough structure that correlates with baking performance [6] . This research prepared four gluten-free doughs (rice flour alone and three binary blends), characterized their rheological profiles by dynamic oscillatory tests, baked standardized loaves, and measured textural attributes by texture profile analysis (TPA), with wheat bread as the benchmark.
Theoretical Background
In SAOS, a sinusoidal strain (γ = γ0 sin ωt) is applied within the linear viscoelastic region, and the resulting stress is decomposed into in-phase (elastic, G') and out-of-phase (viscous, G'') components. The loss tangent, tan δ = G''/G', indicates whether the material behaves more like a solid (tan δ < 1) or a liquid (tan δ > 1) [6] . For bread doughs, G' typically exceeds G'' by a factor of 2-3, and higher G' values are associated with firmer crumb and better gas retention.
Material and Methods
Material and Methods
Material
All baking and analysis work was performed at the Department of Food Science and Technology, Arirang College of Chemical Sciences, Incheon, between May 2022 and December 2022. Commercial rice flour (Beksul, CJ CheilJedang), corn flour (Ottogi), buckwheat flour (Bongpyeong Memil), quinoa flour (imported, Bob's Red Mill), bread wheat flour (CJ Beksul Strong), HPMC (Methocel K4M, Dow), instant dry yeast (Saf-Instant), salt, sugar, and sunflower oil were sourced from local suppliers [7] . All flours were stored at 4°C until use.
Methods: Five dough formulations were prepared: F1 (100% rice flour), F2 (rice:corn 70:30), F3 (rice:buckwheat 60:40), F4 (rice:quinoa 50:50), and FC (100% wheat, control). Each batch used 200 g flour, 6 g sugar, 4 g salt, 10 g oil, 5 g yeast, 4 g HPMC (gluten-free only), and water adjusted to 70% absorption (68% for wheat). Ingredients were mixed in a spiral mixer (Kenwood KMX750) at speed 2 for 8 min. Dynamic rheology was measured on a Malvern Kinexus Pro+ rheometer (plate-plate, 40 mm, gap 1 mm) with a frequency sweep from 0.1 to 10 Hz at 0.1% strain (within the linear region confirmed by amplitude sweep) [8] . Doughs were proofed at 30°C, 85% RH for 60 min and baked at 200°C for 25 min. Loaf volume was measured by rapeseed displacement. TPA was performed on 25 mm crumb cubes using a TA.XT Plus texture analyzer (Stable Micro Systems) with a 36 mm cylindrical probe, 40% compression, 1 mm/s test speed [9] . All tests were done in triplicate.
Instrumentation
Moisture content of flours was measured by air-oven drying at 105°C for 3 h (AACC Method 44-15.02). Protein was determined by micro-Kjeldahl (N × 5.7 for wheat, N × 6.25 for others). Colour of crumb was recorded with a Konica Minolta CR-400 colorimeter (L*, a*, b* values) under D65 illuminant. Baking trials ran in a Sveba Dahlen deck oven with stone hearth [10] . The rice-quinoa blend (F4) recorded the highest G' among gluten-free doughs at 591 Pa, reaching 82% of the wheat control's 724 Pa (Table 1). Pure rice flour (F1) had the weakest network (G' = 342 Pa) and produced the smallest loaf at 287 mL. Tan δ stayed below 0.45 for all formulations, confirming predominantly elastic behaviour. The heatmap (Figure 1) makes the wheat-gluten-free gap visible at a glance: the control column is consistently darker (higher values) for G', hardness, and complex viscosity. Among gluten-free options, F4 (rice-quinoa) showed the most balanced profile, while F3 (rice-buckwheat) had a notably high tan δ (0.43), suggesting a weaker elastic contribution. Loaf volume and crumb score tracked each other closely (Figure 2). F4 reached 358 mL and a crumb score of 6.4, the best of the gluten-free group. The wheat control (412 mL, score 7.9) remained the benchmark, but the gap narrowed when quinoa was included. F1 (rice only) scored lowest at 4.1, reflecting its dense, crumbly texture.
| Code | G’ (Pa) | G’’ (Pa) | tan δ | Vol (mL) | Hard. (N) | L* |
|---|---|---|---|---|---|---|
| F1 Rice | 342 | 128 | 0.37 | 287 | 8.3 | 78.4 |
| F2 R+C | 518 | 187 | 0.36 | 341 | 12.7 | 74.1 |
| F3 R+B | 467 | 203 | 0.43 | 319 | 10.9 | 61.8 |
| F4 R+Q | 591 | 214 | 0.36 | 358 | 14.1 | 69.3 |
| FC Wheat | 724 | 241 | 0.33 | 412 | 18.6 | 72.6 |
Table text extracted from the original PDF; superscript letters are shown inline. The original table image is below.
View original table image
Results
Results
Discussion
Quinoa flour's advantage likely comes from its protein profile. Unlike rice protein, quinoa contains a higher proportion of albumins and globulins that hydrate easily and can form films around gas cells during proofing [5] . The HPMC hydrocolloid added to all gluten-free batches raises viscosity but doesn't contribute much elasticity on its own. When paired with quinoa protein, though, the combined network gets closer to the viscoelastic balance that gluten provides [4] . Buckwheat didn't perform as well as expected. Despite its higher protein content (13.1% vs. 7.2% for rice flour), the dough had the largest tan δ at 0.43, indicating more viscous character. Buckwheat proteins are rich in albumin but tend to form weaker gels because of their lower molecular weight [11] . And buckwheat's strong flavour and dark crumb colour (L* = 61.8) could limit consumer acceptance in markets that prefer white bread. A practical note: even the best gluten-free loaf (F4, 358 mL) had a volume 13% below wheat bread. Bridging that gap might require combining hydrocolloid blends (HPMC + psyllium, for instance) with enzyme treatments like transglutaminase to crosslink available proteins [12] . These approaches add cost, and the challenge for manufacturers is to balance technical improvement against retail price sensitivity.
Conclusion
The rice-quinoa (50:50) blend produced the strongest gluten-free dough (G' = 591 Pa) and the highest loaf volume (358 mL) among four formulations tested, reaching roughly 87% of wheat bread volume. Crumb softness and sensory scores also favoured this blend. Buckwheat added protein but weakened the elastic network and darkened the crumb. HPMC alone narrowed the structural gap with wheat but could not close it entirely. Future reformulation should explore enzyme crosslinking and multi-hydrocolloid systems to further approach wheat bread quality.
References
12 in the original paper- Catassi C, Bai JC, Bonaz B, Bouma G, Calabrò A, Carroccio A, et al. Non-celiac gluten sensitivity: the new frontier of gluten related disorders. Nutrients. 2013;5(10):3839-3853.
- Gallagher E, Gormley TR, Arendt EK. Recent advances in the formulation of gluten-free cereal-based products. Trends Food Sci Technol. 2004;15(3-4):143-152.
- Wieser H. Chemistry of gluten proteins. Food Microbiol. 2007;24(2):115-119.
- Lazaridou A, Duta D, Papageorgiou M, Belc N, Biliaderis CG. Effects of hydrocolloids on dough rheology and bread quality parameters in gluten-free formulations. J Food Eng. 2007;79(3):1033-1047.
- Alvarez-Jubete L, Arendt EK, Gallagher E. Nutritive value and chemical composition of pseudocereals as gluten-free ingredients. Int J Food Sci Nutr. 2009;60(Suppl 4):240-257.
- Dobraszczyk BJ, Morgenstern MP. Rheology and the breadmaking process. J Cereal Sci. 2003;38(3):229245.
- AACC International. Approved methods of analysis. 11th ed. St Paul, MN: AACC International; 2010.
- Ronda F, Pérez-Quirce S, Lazaridou A, Biliaderis CG. Effect of barley and oat β-glucan concentrates on gluten-free rice-based doughs and bread characteristics. Food Hydrocoll. 2015;48:197-207.
- Bourne MC. Texture profile analysis. Food Technol. 1978;32(7):62-66.
- AACC Method 10-05.01. Guidelines for measurement of volume by rapeseed displacement. AACC International; 2000.
- Torbica A, Hadži-Tašković Šukalović V, Vukašinović M. Buckwheat proteins gel forming capacity. In: Proceedings of the 10th International Symposium on Buckwheat. 2007. p. 601-606.
- Gujral HS, Rosell CM. Improvement of the breadmaking quality of rice flour by glucose oxidase. Food Res Int. 2004;37(1):75-81.