
Research article · 2024 · Full text
International Journal of Advanced Chemistry ResearchApplication of water quality index (WQI) to assess groundwater quality in Kirkuk governorate, Iraq
Volume 6(1) · Pages 31–37 · DOI: 10.33545/26646781.2024.v6.i1a.165 ↗
Research areasWater Quality and Pollution Assessment
Abstract
Author-writtenThis study was conducted to evaluate the quality of groundwater using the Water Quality Index (WQI) in the city of Kirkuk, which is located in northern Iraq and is famous for oil production. The study included areas approximately 20 kilometres away from the city centre, which depend mainly on groundwater for human, agricultural and animal use. Nine chemical and physical characteristics of nine wells were determined to estimate the Water Quality Index (WQI) during the summer of 2023. The results showed that most of the chemical and physical parameters of the water samples were within the permissible limits in the standard specifications set by the World Health Organization (WHO) for drinking water. The rates of the studied parameters are (pH = 7.71), (Ec = 805.4), (TDS = 378.67 ppm), (Cl = 85.09 ppm), (NO3 = 40.65 ppm), (SO4 = 138 ppm), (Ca = 93 ppm), (Na=76.3 ppm), (K=3.04 ppm). Regarding the WQI values according to the results of the physical and chemical analyses for each well, they range between (66.6 and 76.17), as the groundwater in the study area is described as good.
Summary
Source-checkedPlain-language reading of the full paper, prepared with AI and checked against the text. Each point links to the authors' own words.
Why it matters
- Residents in the Kirkuk Governorate of Iraq rely heavily on groundwater for human and agricultural needs because of severe water shortages. View evidence ↗
- Human activities are the primary cause of groundwater pollution, which can make water unsuitable for drinking, industry, and agriculture, and harm living organisms. View evidence ↗
- The Water Quality Index (WQI) is a useful tool for assessing the extent of water pollution to help implement measures for reducing it. View evidence ↗
What they did
- Water samples were collected from nine wells at varying distances in the study area, with well depths ranging from 120 to 170 meters. View evidence ↗
- The groundwater samples were collected in September 2023. View evidence ↗
- The study measured pH, EC, TDS, Chloride, Sulphates, Nitrates, Sodium, Potassium, and Calcium using a combination of meters, titration, UV-Visible spectroscopy, and flame photometry. View evidence ↗
- The Water Quality Index (WQI) was calculated for the nine parameters using the weighted index method. View evidence ↗
What they found
- The pH values of the samples ranged from 7.5 to 7.9 (average 7.7), all of which fell within the normal range of 6.5 to 8.5. View evidence ↗
- Total Dissolved Solids (TDS) ranged from 254 ppm (W1) to 754 ppm (W6), with most wells remaining within permissible rates. View evidence ↗
- Chloride concentrations ranged from 40.47 ppm to 142 ppm, all of which were below the normal limit of 250 ppm. View evidence ↗
- Nitrate concentrations reached a maximum of 72.2 ppm in well W9, though most samples remained below the 50 ppm permissible limit. View evidence ↗
- Sulfate concentrations ranged from 121 ppm to 170 ppm, staying within the acceptable limit of 250 ppm. View evidence ↗
- Calcium concentrations ranged from 60.2 ppm to 123 ppm, with the permissible limit being 75-200 ppm. View evidence ↗
- Sodium concentrations ranged from 34 ppm to 133 ppm and were within permissible limits. View evidence ↗
- Potassium concentrations in the studied wells ranged from 2.5 ppm to 3.47 ppm. View evidence ↗
What it means
- The authors conclude that the groundwater in the studied area generally meets permissible specifications for drinking water and is rated as good quality. View evidence ↗
- The authors recommend periodic water analysis, public education to prevent over-extraction from wells, and rationalized water consumption to avoid depletion and salinity. View evidence ↗
Visual summary
2 visualsIllustrations explain the paper; charts are replotted from the paper's own table values.
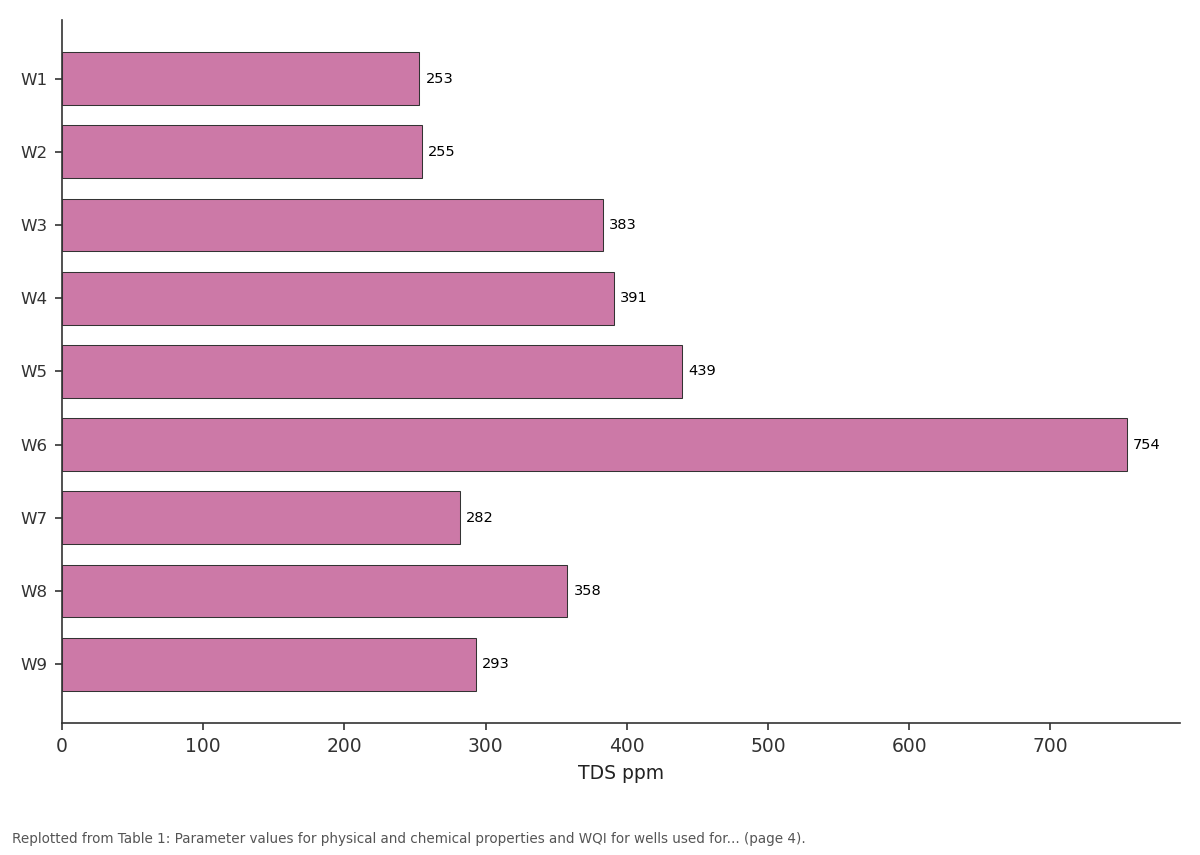
TDS ppm: W1 vs W2 vs W3 vs W4 vs W5
Replotted from Table 1 (page 4) of the original paper. Every bar is the paper's own table value.
View source evidence ↗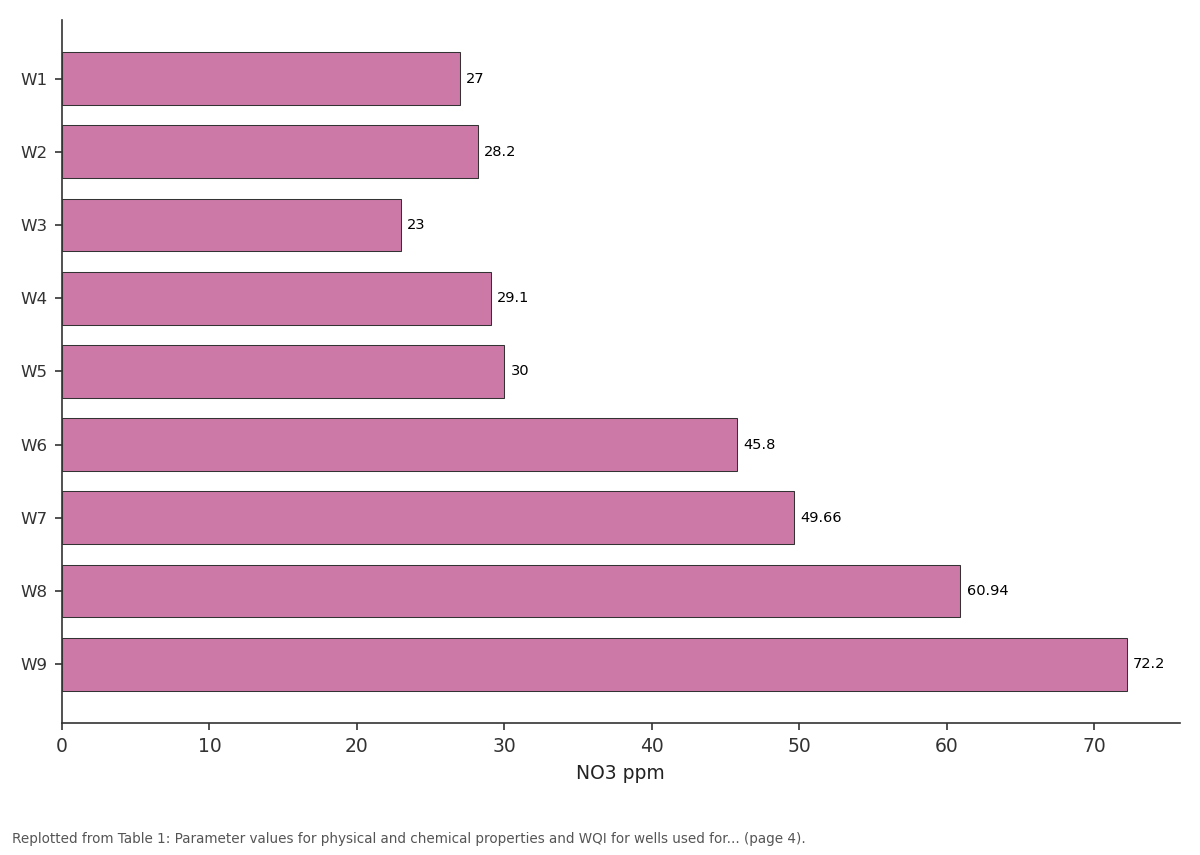
NO3 ppm: W1 vs W2 vs W3 vs W4 vs W5
Replotted from Table 1 (page 4) of the original paper. Every bar is the paper's own table value.
View source evidence ↗Figures & tables
From the original paper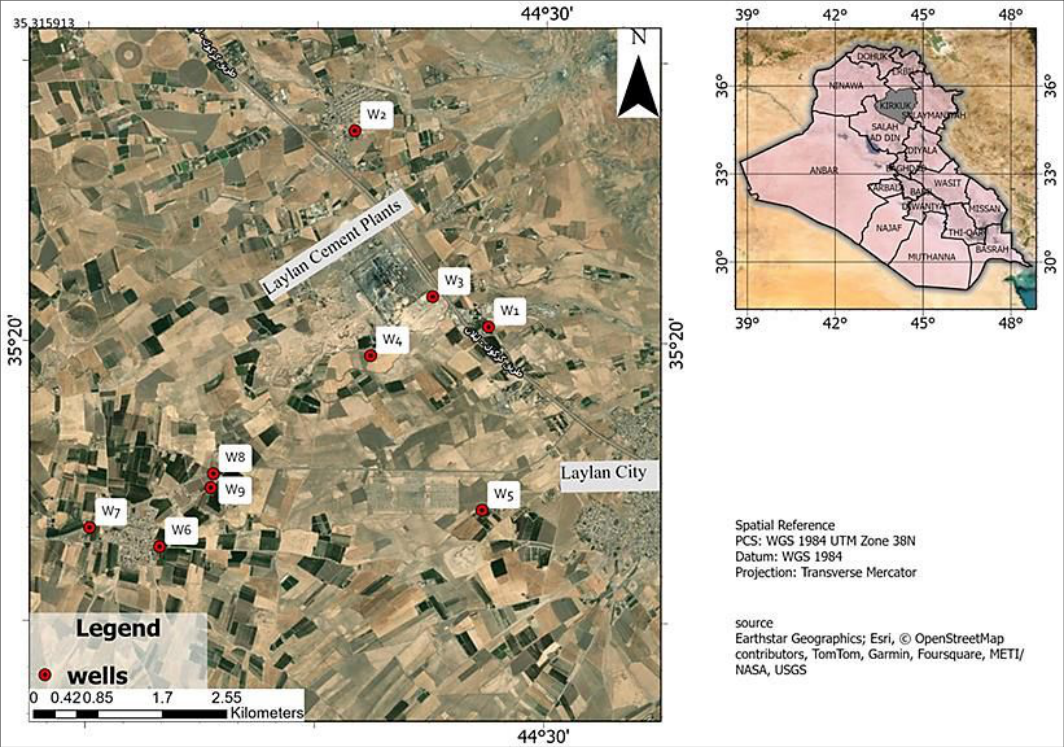 Figure 1
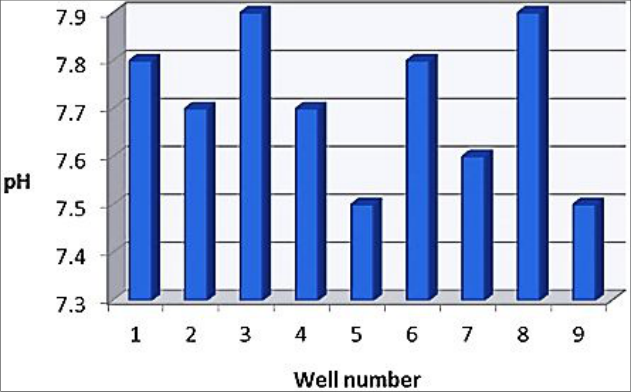 Figure 2
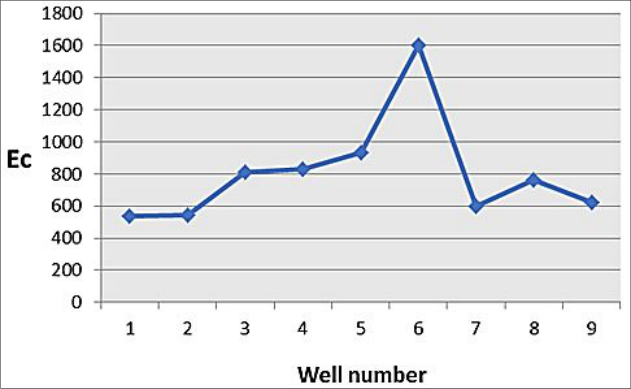 Figure 3
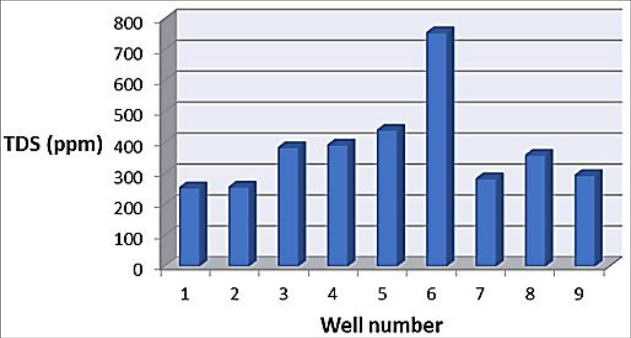 Figure 4
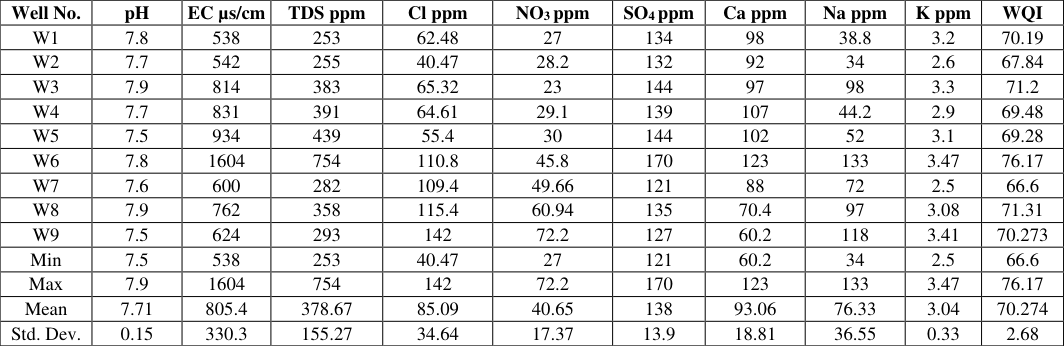 Table 1
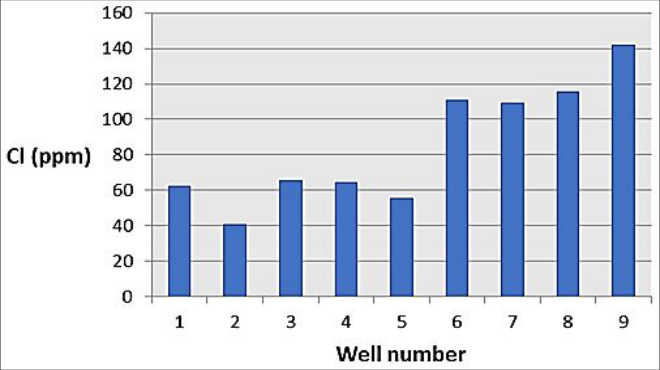 Figure 5
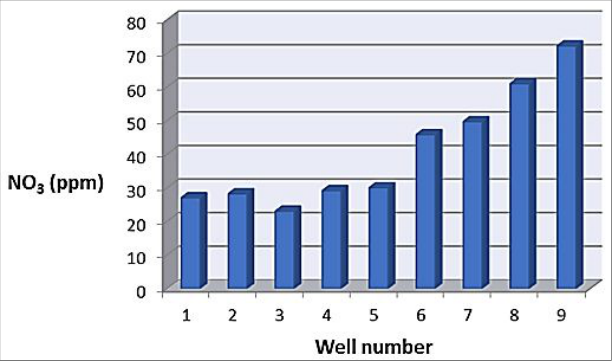 Figure 6
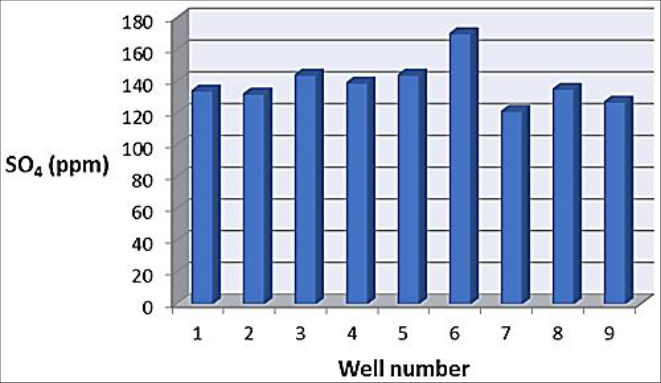 Figure 7
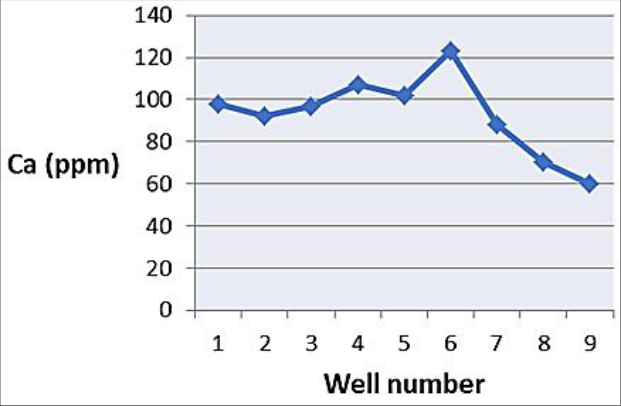 Figure 8
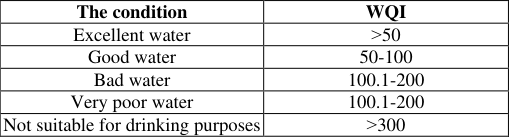 Table 2
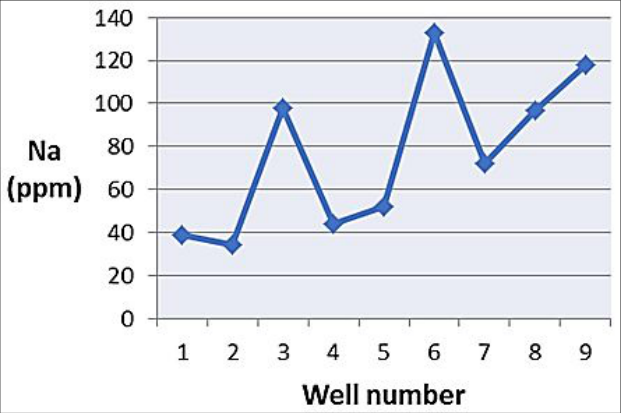 Figure 9
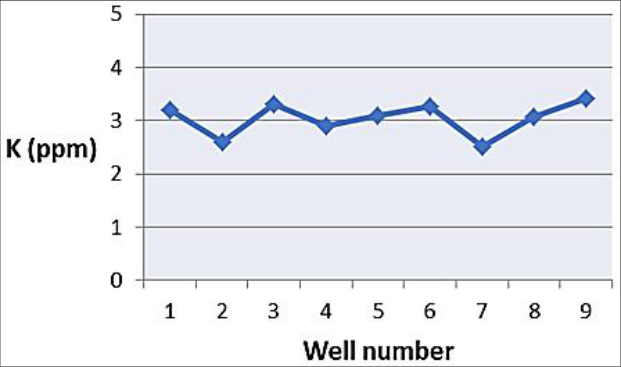 Figure 10
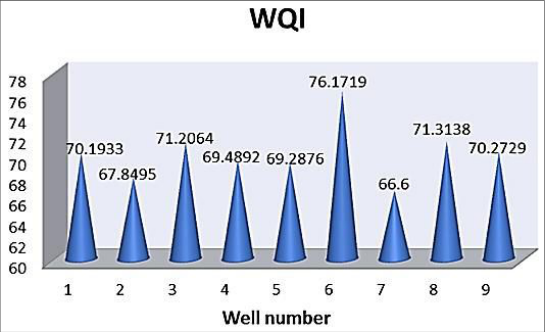 Figure 11
Introduction
The residents of many villages in Kirkuk Governorate in the State of Iraq depend heavily on groundwater due to the severe shortage and increasing need for water for human and agricultural purposes. In general, most groundwater contains higher concentrations of dissolved materials than what is in surface water because it dissolves many minerals as it passes under the surface of the earth in various rock layers, and human activities are the main cause of pollution of groundwater sources [1] . The effect of these pollutants is due to the contamination of these vital resources, which destroys various types of plants and living organisms. In addition, this water becomes unsuitable for drinking and other purposes such as agricultural and industrial use. Thus, the Water Quality Index (WQI is a useful tool in checking the extent of water pollution and thus implementing appropriate measures to reduce pollution of water sources. Water quality is determined by comparing the physical and chemical factors of the water samples subject to study with the permissible limits approved by international organizations. These existing limits are based on approved evidence of scientifically permissible levels of pollution related to the degree of toxicity to human health [14] . The concept of the Water Quality Index (WQI) helps in evaluating the physical, chemical and biological nature of water, especially in relation to human health [3] . The index is basically a mathematical method for calculating one value from the results of multiple tests and is very important for water quality monitors over certain periods of time to detect changes in the aquatic and environmental systems. WQI is defined as a rating technique, which shows the effects of individual water quality parameters on the overall water quality. Water quality and suitability for drinking purposes can be tested by determining its quality index [4] . The water quality index can give indications of the health status of water at different monitoring points, and can be used to compare the water quality of one water source with another water source in the same region or in different regions around the world. This study aims to evaluate the quality of groundwater in northern Kirkuk Governorate for drinking purposes by studying some of the physical and chemical properties of this water, giving a picture of the health and safety of drinking water in the region and evaluating its quality using the Water Quality Index (WQI) based on the World Health Organization (WHO) specifications for drinking water.
Materials and Methods
In this study, nine well water samples were taken in the study area. The samples were collected at varying distances in the study area (Fig 1). The depths of the wells ranged between (120-170 meters). For the purpose of conducting various chemical analyses of the water samples, a sample was taken from each well using 1-liter bottles made of polyethylene, covered and sterilized according to scientific methods used in particular. These samples were taken in September 2023. The pH was measured by (pH-meter), Conductivity (EC) and Total Dissolved Solids (TDS) were measured using a TDS/EC-meter, and Chloride (Cl) was estimated using a titration method using a known silver nitrate (Ag NO 3 ) standard [5] . Sulphates (SO 4 ) were estimated volumetrically by precipitating dissolved sulphates by adding barium chloride and titrating with EDTA solution [6] .
And nitrates (NO 3 ) were estimated using an (UV-Visible) device. As for the dissolved cations: they are Sodium (Na), Potassium (K). And Calcium (Ca) were determined using a flame photometer. The water quality index (WIQ) was also calculated for nine parameters using the weighted index method [7] .
Overall WQI= ∑ (wi×qi)/ (∑wi)
Where wi: The relative weight of each parameter. qi: A measure of the quality score for each parameter. ci: measured concentration. si: Globally allowed value. n: number of bars measured parameters.
Results and Discussion pH
Through the results of chemical analyses of water samples shown in (Table 1), we find that there are no significant differences in the values of (pH) for all samples, where the highest value (7.9) was recorded in well No. (W3, W8) and the lowest value (7.5) in well No. (W5, W9), with an average of (7.7), and when comparing the results of the analyses for pH, we find that there is no significant change.
| Well No. | pH | EC µs/cm | TDS ppm | Cl ppm | NO3 ppm | SO4 ppm | Ca ppm | Na ppm | K ppm | WQI |
|---|---|---|---|---|---|---|---|---|---|---|
| W1 | 7.8 | 538 | 253 | 62.48 | 27 | 134 | 98 | 38.8 | 3.2 | 70.19 |
| W2 | 7.7 | 542 | 255 | 40.47 | 28.2 | 132 | 92 | 34 | 2.6 | 67.84 |
| W3 | 7.9 | 814 | 383 | 65.32 | 23 | 144 | 97 | 98 | 3.3 | 71.2 |
| W4 | 7.7 | 831 | 391 | 64.61 | 29.1 | 139 | 107 | 44.2 | 2.9 | 69.48 |
| W5 | 7.5 | 934 | 439 | 55.4 | 30 | 144 | 102 | 52 | 3.1 | 69.28 |
| W6 | 7.8 | 1604 | 754 | 110.8 | 45.8 | 170 | 123 | 133 | 3.47 | 76.17 |
| W7 | 7.6 | 600 | 282 | 109.4 | 49.66 | 121 | 88 | 72 | 2.5 | 66.6 |
| W8 | 7.9 | 762 | 358 | 115.4 | 60.94 | 135 | 70.4 | 97 | 3.08 | 71.31 |
| W9 | 7.5 | 624 | 293 | 142 | 72.2 | 127 | 60.2 | 118 | 3.41 | 70.273 |
| Min | 7.5 | 538 | 253 | 40.47 | 27 | 121 | 60.2 | 34 | 2.5 | 66.6 |
| Max | 7.9 | 1604 | 754 | 142 | 72.2 | 170 | 123 | 133 | 3.47 | 76.17 |
| Mean | 7.71 | 805.4 | 378.67 | 85.09 | 40.65 | 138 | 93.06 | 76.33 | 3.04 | 70.274 |
| Std. Dev. | 0.15 | 330.3 | 155.27 | 34.64 | 17.37 | 13.9 | 18.81 | 36.55 | 0.33 | 2.68 |
Table text extracted from the original PDF; superscript letters are shown inline. The original table image is below.
View original table image
All samples were within the normal range of pH value, which is from (6.5-8.5), as shown in (Figure 2).
Electrical Conductivity (EC)
In (Table 1) it is shown that the value of (EC) for the wells ranged between (538 µs/cm) for well No. (W1) and (1604 µs/cm) for well No. (W6), where the electrical conductivity values for all wells were within the permissible range, except for the electrical conductivity value for well No.
(W6), which was higher than the permissible value which is (1000 µs/cm). As shown in (Figure 3), which is likely to increase the concentrations of the ions present. This is indicated by the increase in the percentage of Total Dissolved Solids (TDS) in the water of this well, which is shown in (Table 1).
Total Dissolved Salts (TDS)
The results in (Table 1) and (Figure 4) show that the values of (TDS) were consistent with the Electrical Conductivity (EC) values in the water of the wells studied, as the highest value was recorded (754 ppm) for well no. (W6), while the lowest value recorded was (254 ppm) for well No. (W1) and the rest of the well water was within the permissible rates.
The high TDS indicates high concentrations of calcium, sodium, and magnesium, as the minerals exist naturally and move through the soil and rocks due to surface water and are carried to groundwater [8] .
Chloride (Cl)
The results presented in (Table 1) indicate that the chloride ion concentration values (Cl) were variable, as the highest value (142 ppm) was recorded for well no. (W9) and the highest value was (40.47 ppm) for well No. (W2), although the chloride ion concentration values (Cl) did not exceed the normal limits (250 ppm), it is important to point out the danger of this ion to human health and crops [9] . (Figure 5) shows the distribution of results among wells in the study area.
Nitrates (NO3)
From the results shown in (Table 1) and (Figure 6), there is an increase in the nitrate ion concentration for some wells, where the highest value was recorded (72.2 ppm) in well no. (W9). This may explain the high concentration of nitrate ions due to agricultural activities in the studied area, as wells with high concentrations of nitrates are located in agricultural areas. In general, the largest portion of the studied drinking water samples did not exceed the permissible limits. It is (50 ppm).
Sulfates (SO4)
It is dissolved and filtered from rocks containing gypsum, iron sulfide and other sulfur-bearing compounds [8] .
In this study, the sulfate concentration values range between (121 ppm) and (170 ppm) as shown in (Table 1) and (Figure 7). It is within the acceptable limit (250 ppm).
Calcium (Ca)
It enters the groundwater system via filtration of calciumbearing minerals. In the study area, calcium concentration ranges from (60.2 ppm) for well No. (W9) to (123 ppm) for well no. (W6) As shown in (Table 1) and (Figure 8). Note that the permissible limit is (75-200 ppm).
Sodium (Na)
It is a highly reactive alkali metal [10] . It is present in most groundwater [11] . So many rocks and soils contain sodium compounds, which dissolve easily to release sodium into groundwater [8] . Results shown in (Table 1) and (Figure 9) indicate that the sodium ion distribution values (Na) increase with varying values in the region, and it is clear that the sodium concentration ranged between (34 ppm) for well No. (W2) and (133 ppm) for well No. (W8) and was within permissible limits.
Potassium (K)
It is found in many minerals and most rocks, since many of these rocks are relatively soluble and release potassium, the concentration of which increases over time in groundwater. The results in (Table 1) and (Figure 10 Water Quality Index (WQI) After calculating the water quality index using the weighted mathematical index method, using nine parameters for well water in the study area to determine its quality, description, and suitability for drinking or not, and in comparison with the standard specifications set by the World Health Organization WHO [12] . The WQI value was according to the results of the physical and chemical analyses for each well, and as shown in (Figure11) it ranges between (66.6-76.17), as the groundwater in the study area is described as good. (Table 2) shows the classification of the water quality index based on a weighted calculation method [13] .
| The condition | WQI |
|---|---|
| Excellent water | ˃50 |
| Good water | 50-100 |
| Bad water | 100.1-200 |
| Very poor water | 100.1-200 |
| Not suitable for drinking purposes | ˃300 |
Table text extracted from the original PDF; superscript letters are shown inline. The original table image is below.
View original table image
Conclusion
There is a discrepancy between the results of well water parameters for the studied area, as they differ slightly between them. In general, the groundwater of the studied area is classified within the permissible specifications for drinking water. The quality of this studied water is according to the values of the quality index (WQI) for each well was rated good. The results of the study recommend the necessity of continuing to conduct periodic analyses of the levels of physical and chemical characteristics to identify any unhealthy condition, educating citizens in various segments of society and by all means not to overconsume the rates of withdrawal from these wells, and rationalizing water consumption and preserving it so that it is not a cause of water depletion and exposure to salinity.
References
12 in the original paper- Al-Janabi ZZ, Al-Kubaisi AR, Al-Obaidy A-HMJ. Assessment of water quality of Tigris River by using water quality index (CCME WQI). Al-Nahrain Journal of Science. 2012;15(1):119-126.
- Pandey R, Chaurey R, Solanki ERHK, Kumar S, Singh RM. Groundwater prospectus mapping using well points based on remote sensing and GIS techniques in a microwatershed. Int. J Geogr Geol. Environ. 2022;4(1):145-153.
- Patel PS, Pandya DM, Shah M. A systematic and comparative study of Water Quality Index (WQI) for groundwater quality analysis and assessment. Environmental Science and Pollution Research. 2023;30(19):54303-54323.
- Şener Ş, Şener E, Davraz A. Evaluation of water quality using Water Quality Index (WQI) method and GIS in Aksu River (SW-Turkey). Science of the Total Environment. 2017;584:131-144.
- Belle-Oudry D. Quantitative analysis of sulfate in water by indirect EDTA titration. Journal of Chemical Education. 2008;85(9):1269.
- Channo RJ. Studying the Probability of Using Groundwater in Baghdad City for Human, Animal, and Irrigation Use. Al-Khwarizmi Engineering Journal. 2012;8(3):63-74.
- Ram A, Tiwari SK, Pandey HK, Chaurasia AK, Singh S, Singh YV et al. Groundwater quality assessment using Water Quality Index (WQI) under GIS framework. Applied Water Science. 2021;11(46):1-20.
- Sadat-Noori SM, Ebrahimi K, Liaghat AM. Groundwater quality assessment using the Water Quality Index and GIS in Saveh-Nobaran aquifer, Iran. Environment Earth Science. 2014;71:3827-3843.
- Li G, Yang Q, Chao J, Zhang B, Wan M, Liu X, et al. Enhanced processability and electrochemical cyclability of metallic sodium at elevated temperature using sodium alloy composite. Energy Storage Mater. 2021;35:310316.
- Kouadra R, Demdoum A. Hydrogeochemical characteristics of groundwater and quality assessment for the purposes of drinking and irrigation in Bougaa area, Northeastern Algeria. Acta Geochimica. 2020;39:642-654.
- Abbas AH, Dawood AS, Al-Hasan ZM. Evaluation of groundwater quality for drinking purpose in basrahgovernorate by using application of water quality index. Kufa Journal of Engineering. 2017;8(1):65-78.
- Danquah L, Abass K, Nikoi AA. Anthropogenic pollution of inland waters: The case of the Aboabo River in Kumasi, Ghana. Journal of Sustainable Development. 2011;4(6):103.
Cited by 9
From OpenAlex, OpenCitations and reference lists read by Scinovex
- Hydrochemical assessment of drinking water sources and their suitability for human consumption ↗
Gaurav ., Anish Kumar · International Journal of Chemical Studies · 2026
Groundwater is the primary source of drinking water in large parts of rural eastern India, yet its quality is increasingly threatened by both geogenic and anthropogenic factors. The present study evaluates the hydrochemical characteristics and drinking water suitability of groundwater sources in Madhepura district, Bihar, located in the Indo-Gangetic alluvial plain. A total of 50 groundwater samples collected from hand
- Health impacts of water pollution on fish in the Tigris River: A review ↗
Zainab Abbas, Fatima Kareem Shandookh · Acta Entomology and Zoology · 2025
The Tigris River, a crucial transboundary waterway in the Middle East, has undergone significant environmental degradation due to escalating pollution from industrial, agricultural, and domestic sources. Flowing through Turkey, Syria, and Iraq before merging with the Euphrates to form the Shatt al-Arab, the river supports diverse ecosystems and provides essential services—including irrigation, drinking water, and fisheries—for millions of people. Over
- A chemical analysis to assess drinking water treatment facilities in Fallujah, Anbar Governorate, Iraq ↗
Mustafa M Abd · International Journal of Pharmaceutical Sciences and Drug Analysis · 2025
Water consumption is an essential resource intricately connected to human health and ecological stability. Purification is an essential process to guarantee the absence of physical, chemical, and biological pollutants. This study seeks to assess the quality of drinking water at six prominent water purification facilities in Fallujah City, Anbar Governorate, Iraq. The findings indicated that the turbidity of the raw…
❝ 0PDF - A comparative study of the impact of Vitamin B12 deficiency on spontaneous abortion in Tikrit City ↗
Walaa Mohammed Abbod, Israa Hashim Abdul-Karim · International Journal of Gynaecology Sciences · 2025
Background: Vitamin B12 (cobalamin) is a vital water-soluble micronutrient involved in DNA synthesis, red blood cell formation, and neurological function. Its deficiency during pregnancy has been associated with adverse outcomes, including spontaneous abortion. However, the extent of this association in Iraqi women remains underexplored. Objective: To investigate the association between serum vitamin B12 levels and spontaneous abortion, and to assess
- Histological and gene expression study of Liza Abu (Haeckel) tissues exposed to high concentrations of cadmium chloride: An integrated biomarker approach for aquatic toxicity assessment in the Tigris river basin ↗
Zainab Abbas · International Journal of Fisheries and Aquatic Studies · 2025
Background: Cadmium (Cd) is a persistent, highly toxic heavy metal with no biological function, posing severe risks to freshwater ecosystems. Its bioaccumulation and oxidative stress-inducing capacity make it a priority pollutant, especially in poorly regulated regions such as Iraq. Objective: This study aimed to evaluate acute cadmium chloride (CdCl?) toxicity in Liza Abu (Haeckel, 1870), a native Iraqi fish, through
- Length - weight relationship and condition factor of Puntius amphibius and Labeo dussumieri from Pamba river, Kerala, India ↗
N. Suja, Chavan Akash, K Niyogi Krishna · International Journal of Fisheries and Aquatic Studies · 2025
The present study investigates the length-weight relationships (LWRs) and condition factor (Kn) of two native freshwater fish species, P. amphibius and L. dussumieri, collected from the Pamba River, Kerala, India, during August-October 2025. Both species exhibited significant LWRs (r² > 0.90). The Fulton condition factor (K) values were 1.89 for P. amphibius and 2.02 for L. dussumieri, while the respective
- A review of smart agriculture and its impact on revolutionizing agricultural production
Idrees H. M. AL-Jaf, Mudasiru Olawale Ibrahim, Adnan NH Hammadi, Ahmed F. Z. Al-Dulaimy, Hiba EAlfahdawi · International Journal of Horticulture and Food Science · 2025
As the world's population grows, traditional agriculture confronts substantial challenges from resource constraint and climate change, making food security and sustainability top priorities. Smart agriculture, which incorporates technology such as artificial intelligence (AI), the internet of things (IoT), and drones, provides novel solutions for increasing productivity and resource efficiency. AI technologies are used to examine large agricultural datasets such as satellite imaging, soil properties, and weather patterns, resulting in better crop and resource management as well as higher yield
- Classification of the sediments of the Khasa Dam Lake, northeastern Kirkuk, Iraq
Mays Aman Hadi Abdullah, Soran N Sadiq · International Journal of Geography Geology and Environment · 2025
Surface storage dams are their most important source of water. They store water from mountains and valleys on the Earth's surface, constituting a vital resource. Some recent studies have shown that sedimentation can significantly reduce dam efficiency. Unless addressed scientifically, the rapid flow of water from mountainous areas carries with it dirt and small gravel. These materials settle in the lake over time, causing a decrease in the volume of water storage. This problem is observed in many dams in Iraq, especially in the northern regions (Al-Mamooriet al., 2019) [2] and has been studied
- The significance of the maternal dashboard lies in its ability to improve the quality indicators of obstetric and gynecological teaching hospitals ↗
Noor Jalil Alsaigh, Waleed Arif Tawfeeq Al-Ani · International Journal of Advanced Community Medicine · 2024
The well-being of the mother and her baby can be influenced by the quality of the care they receive during pregnancy, childbirth, and postpartum. It’s crucial to ascertain the quality of healthcare to improve it. Therefore, utilizing a maternity dashboard is vital to measure key performance indicators (KPIs), improve the quality of care, and ensure high-quality care. Objectives: To identify