
Research article · 2023 · Full text
International Journal of Statistics and Applied MathematicsSpatio: Temporal dynamics in cotton area, production and productivity: A worldwide scenario
Volume 8(6) · Pages 183–186 · DOI: 10.22271/maths.2023.v8.i6b.1540 ↗
Research areasGlobal Trade and CompetitivenessEconomic and Technological Innovation
Abstract
Author-writtenCotton is one of the most important fiber crops playing essential role in the history of mankind and civilization. It is called as ‘White gold’, due to its agricultural and industrial economic importance. Cotton is mainly grown for its fibers, which are used in textile industry. Exponential growth function was employed to estimate growth rates during the period from 2001-02 to 2020-21 in the major cotton-producing countries worldwide, namely India, USA, Egypt, and China. The results found that, during last two decades, only India has achieved positively higher growth rate in cotton area, production and productivity, but USA, China and Egypt shown declining trend, and at world level, it remained almost stagnant, with lower growth in production and yield. Worldwide growth dynamics helps in better understanding of global trade and also helps in worldwide policy making.
Summary
Source-checkedPlain-language reading of the full paper, prepared with AI and checked against the text. Each point links to the authors' own words.
Why it matters
- Cotton is a critical fiber crop with significant agricultural and industrial economic value, often referred to as 'White gold'. View evidence ↗
- While grown in approximately 75 countries, the majority of global cotton production (nearly 60%) comes from India, the United States, and China. View evidence ↗
- Analyzing worldwide growth dynamics of cotton is essential for understanding global trade and informing international policy. View evidence ↗
The question
- The study aimed to estimate the growth rates of cotton area, production, and productivity in India, USA, Egypt, and China from 2001-02 to 2020-21. View evidence ↗
What they did
- Data for the analysis were sourced from the International Cotton Advisory Committee (ICAC) and the USDA for the period 2001-02 to 2020-21. View evidence ↗
- The researchers used an exponential function to calculate the compound growth rates (CGRs) for cotton metrics. View evidence ↗
- A Student 't' test was employed to determine if the calculated growth rates were statistically significant. View evidence ↗
What they found
- In Period-I, India's cotton production grew at the highest rate of 14.20% per annum, while China's grew at 3.92%. View evidence ↗
- India also led in cotton yield growth during Period-I at 10.69% per annum, with China following at 2.28%. View evidence ↗
- China achieved the highest growth rate in cotton productivity during Period-II at 3.09% per annum. View evidence ↗
- Across the entire study period (2001-02 to 2020-21), India was the only country with a significant positive growth rate in cultivation area (2.90% per annum). View evidence ↗
- India recorded the highest significant growth rate in cotton production over the overall period at 6.38% per annum. View evidence ↗
- Over the overall period, India had the highest cotton productivity growth rate at 3.39%, followed by China at 2.96%. View evidence ↗
- Egypt's cotton productivity significantly declined by -1.64% per annum over the overall two-decade period. View evidence ↗
- Globally, cotton production showed a modest increase of 0.64% per annum over the overall period. View evidence ↗
What it means
- The authors conclude that Bt. cotton technology may have lost its viability, as yields in India began declining from 2017-18. View evidence ↗
- The authors recommend the development of new high-yielding varieties to replace the declining viability of Bt. cotton. View evidence ↗
Visual summary
3 visualsIllustrations explain the paper; charts are replotted from the paper's own table values.
Comparative Growth Trends
AI-generated conceptual illustration (cotton plants in agricultural fields). It explains the idea and does not show study data.
View source evidence ↗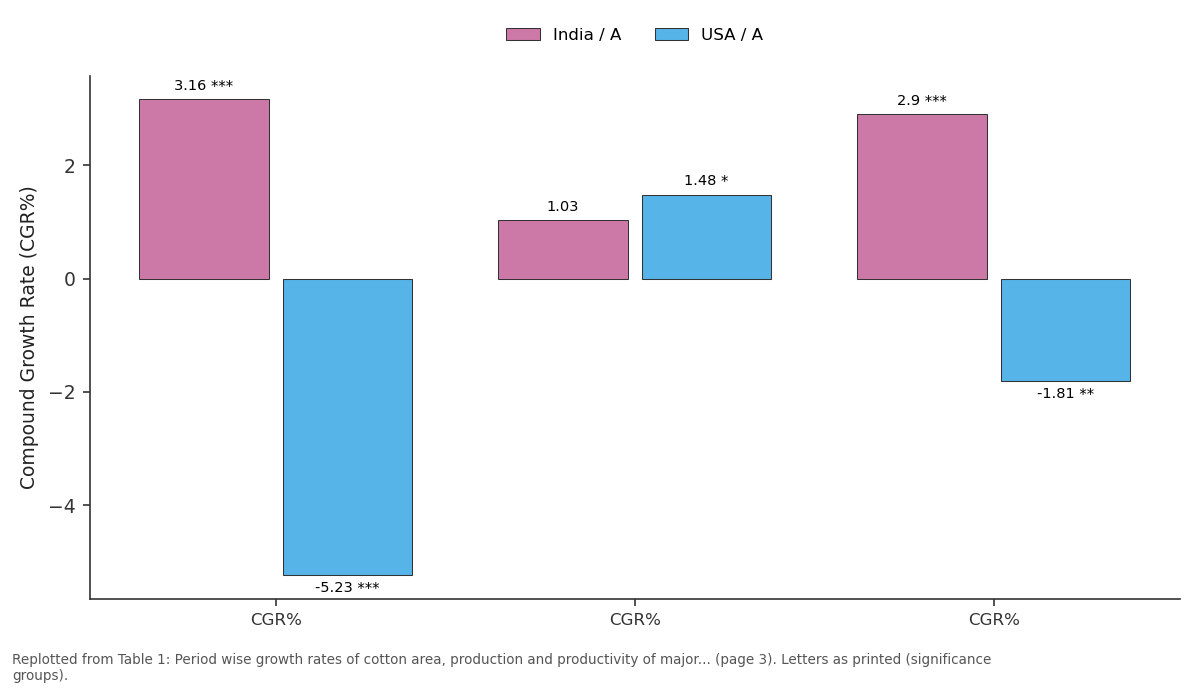
India / A and USA / A: CGR% vs CGR% vs CGR%
Replotted from Table 1 (page 3) of the original paper. Every bar is the paper's own table value.
View source evidence ↗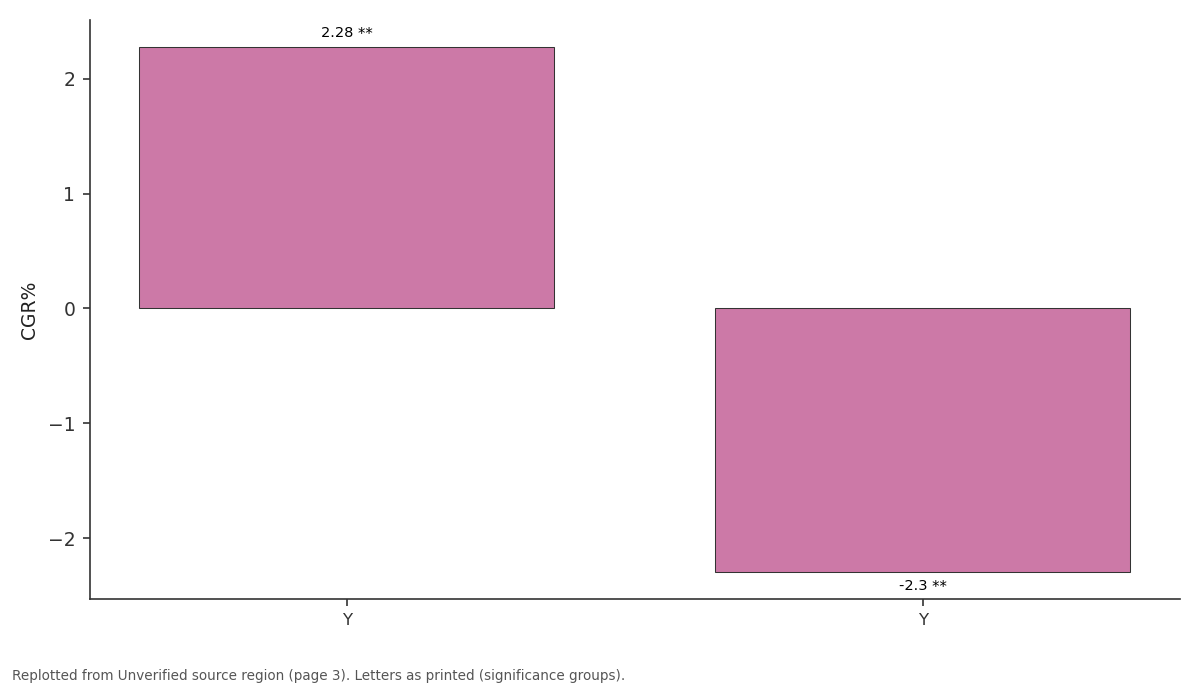
CGR%: Y vs Y
Replotted from a table (page 3) of the original paper. Every bar is the paper's own table value.
View source evidence ↗Figures & tables
From the original paper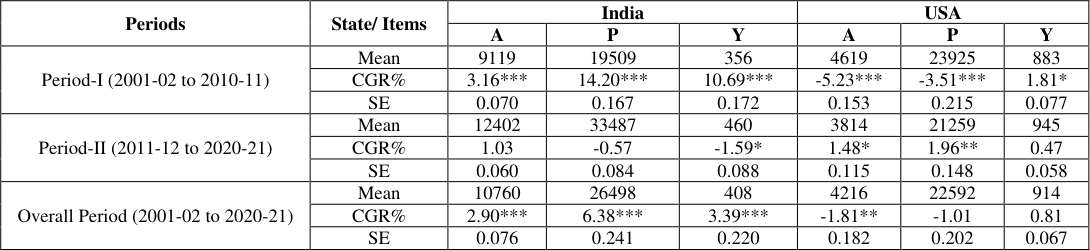 Table 1
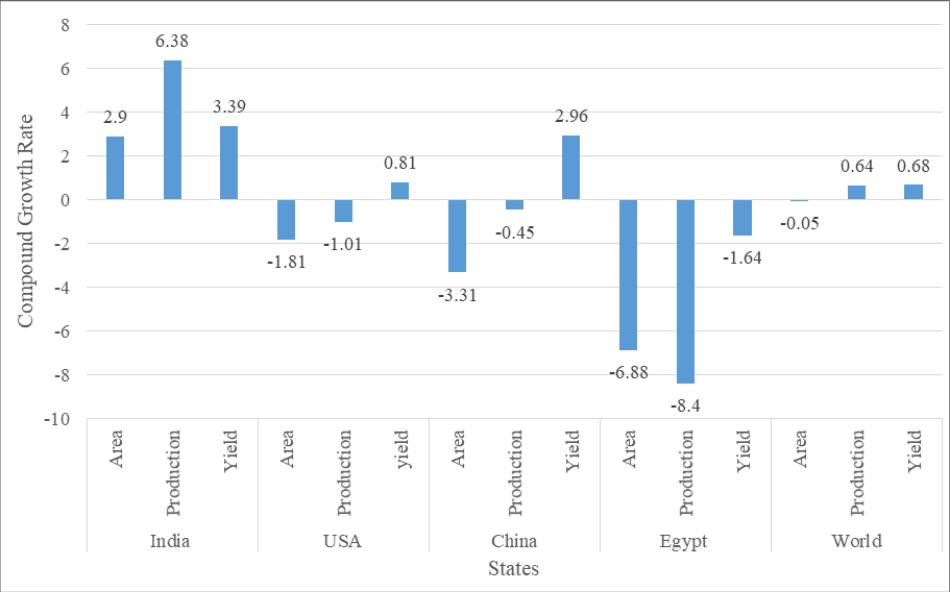 Figure 1
Introduction
Cotton has been used as a fabric since time immemorial. It has been cultivated in the Indus valley more than 5000 years. It provides the basic raw material (cotton fiber) to cotton textile industry. India had the monopoly in manufacturing cotton textiles since 1500 BC. Then the cultivation of cotton spread from India to Egypt and to Spain and Italy. Cotton is grown in about 75 countries across the world, out of which, India, United States and China contribute nearly 60 percent of the total world production (ICAC, 2022) [4] . Cotton is one of the most traded commodities globally. Countries with significant cotton production contribute to international trade, and exports of cotton and cotton-based products form a substantial portion of their economy. United States is largest exporter of cotton followed by Brazil. Whereas, Egyptian cotton being by far the best cotton in the world, because fabrics made of Egyptian cotton are softer, finer and last longer than any other cotton. So, Egyptian cotton have greater impression on world textile markets. Over the last decade, textiles utilisation has risen steadily mainly driven by population and income growth mostly in developing countries, particularly in Asia. Moreover, demand for natural fibres has expanded quite markedly in recent years, sustained by a growing trend for sustainability. (FAO, 2023).
Methodology and Data collection
The data on cotton area, production and productivity of major cotton producers worldwide (India, USA, China and Egypt) were collected for period from 2001-02 to 2020-21 from the various public sources; ICAC and USDA.
Growth rate analysis
Growth rate can be defined as the rate of change per unit time. It is used to measure the past performance of the economic variables in question and describe the trends in those variables over time. The normal statistical procedure to obtain a measure of growth dynamics of crops over a period is to postulate a hypothetical function which would adequately describe the series of economic variables over time and estimate their parameters. Growth rate is generally expressed in two forms, viz., linear and compound. The linear form is obtained by fitting a straight line to the yearly data and estimating the parameters. The compound growth rate is obtained by fitting a straight line to the logarithms of the data and estimating the slope of the line (Acharya et al., 2012) [1] . In the present study, the compound growth rate was calculated using the following formula.
Compound growth rate
The compound growth rates (CGRs) of cotton was calculated by using the exponential function of the following specification:
Where, Y t = Dependent variable (Area, Production and productivity of cotton crop in the year 't'.) t = Time variable in years taking the value of 1, 2, 3, ., n a = Intercept; b = Regression coefficient (1+r) r = Compound growth rate u t = Error term For the purpose of estimation, the equation was expressed in logarithmic form.
The value of log b in equation ( 2) was computed using the formula,
Where, N = Number of years. Subsequently, the compound growth rate (%) was computed using the formulation, Compound growth rate (r) = [(Antilog of log b) -1] *100 (4) Student 't' test was used to determine the significance of the growth rates obtained for which the following formulation was employed,
The calculated 't' values, from equation ( 6), was compared with the table 't' values and the significance was tested at 1, 5 and 10 percent levels.
Results and Discussion Temporal changes in cotton area, production and productivity in major countries of world
To comprehend the trends in area, production and productivity of cotton, country wise growth rates were computed for the three periods: Period -I (2001-02 to 2010-11) Period-II (2011-12 to 2020-21) and Overall Period (2001-02 to 2020-21). Exponential growth functions were employed to estimate growth rates during three distinct periods in the major cotton-producing countries worldwide, namely India, USA, Egypt, and China. The ranges of growth rates given by Das et al. (2016) [2] are as follows.
Low growth rate = between 0 to 5 Medium growth rate = greater than 5 and up to 10 High growth rate = greater than 10
The ensuing discussion on growth rates is presented on a country-by-country basis for each period. Additionally, a comprehensive analysis of global cotton statistics, encompassing area, production, and productivity, has been conducted. The detailed findings are systematically presented in Table 1 and graphically depicted in Figure 1. Table 1 reveals noteworthy trends in cotton cultivation across major producing countries during Period-I. India experienced the most substantial increase in cotton cultivation area, recording a growth rate of 3.16 percent, followed closely by China with a growth rate of 1.61 percent. Conversely, Egypt and the USA reported significantly negative growth rates in cotton cultivation area during this period, declining at rates of -9.07 percent and -5.23 percent per annum, respectively. At the global level, the area under cotton cultivation exhibited a non-significant negative growth rate during Period-I.
| Periods | State/ Items | India | — | — | USA | — | — |
|---|---|---|---|---|---|---|---|
| A | P | Y | A | P | Y | ||
| Period-I (2001-02 to 2010-11) | Mean | 9119 | 19509 | 356 | 4619 | 23925 | 883 |
| CGR% | 3.16*** | 14.20*** | 10.69*** | -5.23*** | -3.51*** | 1.81* | |
| SE | 0.070 | 0.167 | 0.172 | 0.153 | 0.215 | 0.077 | |
| Period-II (2011-12 to 2020-21) | Mean | 12402 | 33487 | 460 | 3814 | 21259 | 945 |
| CGR% | 1.03 | -0.57 | -1.59* | 1.48* | 1.96** | 0.47 | |
| SE | 0.060 | 0.084 | 0.088 | 0.115 | 0.148 | 0.058 | |
| Overall Period (2001-02 to 2020-21) | Mean | 10760 | 26498 | 408 | 4216 | 22592 | 914 |
| CGR% | 2.90*** | 6.38*** | 3.39*** | -1.81** | -1.01 | 0.81 | |
| SE | 0.076 | 0.241 | 0.220 | 0.182 | 0.202 | 0.067 |
Table text extracted from the original PDF; superscript letters are shown inline. The original table image is below.
View original table image
Turning to cotton production in the same period, India demonstrated the highest growth rate at 14.20 percent per annum, followed by China at 3.92 percent. In contrast, Egypt and the USA reported significantly negative growth rates of -11.16 percent and -3.51 percent per annum, respectively. Globally, cotton production exhibited a significant annual increase of 1.84% during Period-I. These findings align with those observed by Pangayar et al. (2015) [6] in the context of maize area, production, and productivity in India during the period from 1970-71 to 2013-14. During Period-I, India exhibited the highest annual growth rate in cotton yield at 10.69 percent, followed by China at 2.28 percent. The USA observed a lower but significant growth rate in cotton productivity, increasing by 1.81percent per annum. However, Egypt experienced an annual decrease in cotton yield at a rate of -2.30 percent. Globally, cotton productivity significantly increased at 2.27 percent per annum during Period-I. In Period-II, the USA recorded the highest positive growth rate in cotton cultivation area at 1.48 percent per annum. India also demonstrated a positive but non-significant growth rate of 1.03 percent per annum in cotton area. Conversely, Egypt and China witnessed significant decreases in cotton area, declining at rates of -7.96 percent and -5.92 percent per annum, respectively. For cotton production in Period-II, only the USA showed a significant positive growth rate of 1.96 percent per annum, while Egypt and China reported significant negative growth rates of -8.01 percent and -3.02 percent per annum, respectively. India recorded a nonsignificant and negative growth rate (-0.57%) in cotton production during this period. Regarding cotton productivity in Period-II, China exhibited the highest growth rate at 3.09 percent per annum, while the USA had a positive but nonsignificant growth rate of 0.47 percent. Egypt experienced a decrease in cotton productivity at a rate of -0.05 percent per annum, and India also showed a non-significant negative growth rate. At the global level in Period-II, cotton area, production, and productivity all decreased at rates of -0.53, -0.83, and -0.31 percent per annum, respectively, with nonsignificant negative growth rates observed. Over the overall period from 2001-02 to 2020-21, India was the only country to record a positive and significant growth rate in cotton cultivation area, at 2.90 percent per annum. Egypt, China, and the USA, on the other hand, reported significantly negative growth rates of -6.88, -3.31, and -1.81 percent per annum, respectively. At the global level, cotton cultivation area decreased at a rate of -0.05 percent per annum over the overall period. Over the overall period, India achieved the highest and significant growth rate in cotton production at 6.38 percent per annum, making a substantial contribution to global cotton production and supporting the growth of the textile industry. Egypt, however, experienced a significant negative growth rate of -8.40 percent per annum in cotton production. The USA and China exhibited negative but non-significant growth rates in cotton production during the overall period. At the global level, cotton production increased at a lower rate of 0.64 percent per annum. Cotton productivity growth rates were found to be the highest in India at 3.39 percent, followed by China at 2.96 percent. Despite the higher growth rate in cotton yield, India still lagged behind in cotton productivity compared to other countries, indicating the need for new research methodologies to enhance cotton yield. In Egypt, cotton productivity significantly decreased at a rate of -1.64 percent per annum over the last two decades, possibly due to technological deterioration and a lack of new developments to meet the demands of the textile industry. The USA registered a positive but non-significant growth rate in cotton yield, while at the global level, cotton yield increased at a lower rate of 0.68 percent per annum During the period from 2001-02 to 2010-11, India achieved the highest growth rates in cotton area, production, and productivity, followed by China, primarily due to the introduction of Bt. Cotton cultivation in India from 2003-04 onwards. In the USA, although cotton area and production declined in the first decade of the 2000s, productivity remained positive. At the global level, despite a marginal decline in cotton area, production and productivity increased. In the 2010s, India showed positive growth in cotton area but experienced a decline in production and yield, particularly since 2017-18 when Bt. Cotton yield started decreasing. This suggests that Bt. Cotton technology may have lost its viability, highlighting the need to develop new high-yielding varieties. Jadhav et al. (2020) [5] noted similar results and concluded that The area expansion during the study period was mainly due to introduction of Bt cotton and implementation of crop development programs, supply of large scale Bt cotton varieties to the farmers. Shaikh and Joshi (2013) [7] also noted similar results in this line and mentioned that there is significantly increased in cotton growing area but less yield appear to other state districts. Only the USA exhibited a positive trend in area and production in the 2010s, while its productivity remained positive but stagnant. At the global level, cotton area, production, and productivity declined in the 2010s. In the overall period of the last two decades, only India achieved a positively higher growth rate in cotton area, production, and productivity. In contrast, the USA, China, and Egypt exhibited declining trends in cotton area, production, and productivity, and at the global level, growth remained almost stagnant, with lower growth rates in production and yield.
Conclusion
Over the last two decades, India significantly contributed to global cotton production, demonstrating substantial growth in cultivation area, production, and productivity. At world level, cotton production increased at the lower rate of 0.64 percent per annum in overall period. In the same period, China and the USA reported negative but non-significant growth rates in cotton production, while the global increase remained modest. In 2010s, though area under cotton in India shown positive growth, but production and yield were decreased. From the year 2017-18 onwards, Bt. cotton yield started declining. This indicates that the Bt. cotton technology has lost its viability. Notably, India stands out as the only country with a positive and significant growth rate in cotton metrics. Conversely, China, the USA, and Egypt experienced declining trends in cotton metrics, contributing to the overall stagnation in global growth.
References
6 in the original paper- Acharya SP, Basavaraja H, Kunnal LB, Mahajanashetti SB, Bhatt RS. Growth in area, production and productivity of major crops in Karnataka. Karnataka J Agric Sci. 2012;25(4):431-436.
- Food and Agricultural Organization (FAO). Rome, Italy; c2020 [cited 2023 Sep 15]. Available from: www.fao.org.
- International Cotton Advisory Committee (ICAC). Washington DC; c2022 [cited 2022 Nov 13]. Available from: www.icac.org.
- Jadhav DS, More SS, Choudhari SD, Chaudhari SA. Int J Curr Microbiol Appl Sci. 2020;11:1411-1417.
- Pangayar R, Muraligopal S, Vasanthi R, Swaminathan B. Statistical analysis of trends in the maize area, production and productivity in India. Ann Plant Soil Res. 2015;17:233-237.
- Shaikh IA, Joshi MB. Analysis of instability and growth rate of cotton in three districts of Marathwada. Int J Stat Math. 2013;6(3):103-124.
Cited by 6
From OpenAlex, OpenCitations and reference lists read by Scinovex
- Assessment of nitrogen response in promising cotton cultivars in Vidarbha region of Maharashtra
PU Ghatol, ND Parlawar, AP Karunakar, DT Dhule, ST Dangore · International Journal of Advanced Biochemistry Research · 2024
Cotton (Gossypium spp.) stands as the primary fiber-producing crop globally, with India leading in both cultivation area and raw cotton production. However, Maharashtra, despite being a leading state in cotton cultivation, faces challenges with comparatively low productivity. Soil nitrogen plays a crucial role in crop yield and quality, affecting various physiological processes essential for plant growth. This study examines the nitrogen response of promising cotton cultivars in Maharashtra's Vidarbha region. Through field experiments conducted over two years, we evaluated the impact of nitrog
- Comprehensive insights on evolving ideal plant type for high density planting of cotton in India ↗
Sanyasi SELVAMANI, D Kumaresan, R. Ravikesavan, Nallathambi Kannan, N. Manikanda Boopathi, N Sakthivel · Journal of Cotton Research · 2026
Abstract Cotton is one of the most important sources of fiber and plays a significant role in the global edible oil industry. Over the years, strategies such as the adoption of hybrids and Bt cotton have significantly contributed to improving yield in India. However, challenges such as yield stagnation, persistent pest and disease pressures, and high cultivation costs hinder cotton…
❝ 0PDF - Comparative economic analysis of Bt cotton and SAU cotton varieties in Tamil Nadu
V Vikanasan, M Manimegalai, K. R. Sundaravaradarajan, M Vaidheki, Sharath S Yeligar · International Journal of Agriculture and Food Science · 2025
The cotton sector in Tamil Nadu plays a vital role in rural livelihoods and agricultural income. This study conducts a comparative socioeconomic analysis between cotton varieties released by State Agricultural Universities (SAUs) and Bt cotton cultivated in the Perambalur district. Primary data were collected through structured interviews from 120 cotton farmers using a multistage random sampling technique. Analytical tools such as the Probit Model, Independent Sample t-Test, and Friedman Test were employed to assess varietal preference, income differences, and cultivation challenges. The find
- Marketing and Cultivation Challenges of Bt Cotton and SAU Cotton Varieties in Tamil Nadu
V Vikanasan, M Manimegalai, KR Sundaravaradharajan, M Vaidheki, Sharath S Yeligar · International Journal of Agriculture and Food Science · 2025
The cultivation of cotton in Tamil Nadu has evolved significantly with the adoption of Bt cotton and the continued promotion of State Agricultural University (SAU) cotton varieties. This article explores and compares the key marketing and cultivation challenges faced by farmers cultivating these two types of cotton. Using primary data collected from selected districts and analyzed with statistical tools such as the Friedman test, the study highlights issues such as pest resistance, input cost burden, seed accessibility, and market volatility. The results indicate that while Bt cotton offers yi
- Analysis of spatio-temporal changes in agricultural productivity and productivity regions in Dhule district
Sachin Ranu Govardhane, Wayal Navnath Laxman · International Journal of Geography Geology and Environment · 2024
Agricultural yields and cropping systems vary from region to region in India or around the world. Physico-climatic, socio-economic and technological factors are the main controllers of agricultural productivity in any region of the world. Agricultural productivity is the ratio of agricultural output to agricultural inputs. Measurement and comparative analysis of agricultural productivity enables us to delineate sectors that are performing efficiently or less efficiently compared to other agricultural sectors. The objective of the present paper is to examine the variation in crop productivity a
- Comparative analysis of high-density planting system (HDPS) and traditional cotton cultivation practices in Sangareddy district, Telangana
K. V. Saritha, Kiran Vishwakarma, Jampala Rajashekar, Ranju Ravindran Santhakumari Manoj · International Journal of Research in Agronomy · 2024
This study investigates the adoption and effectiveness of High-Density Planting System (HDPS) in cotton cultivation, comparing it to traditional farming practices. The research was conducted during Kharif season 2023-24 season under DAATTC Sangupet & ICAR-CICR, Nagpur Special Cotton Project entitled Targeting Technologies to Agro-Ecological Zones – Large Scale Demonstrations of Best Practices to Enhance Cotton Productivity under NFSM, in the Sangareddy district of Central Telangana Zone. A descriptive research design was used to evaluate the effectiveness of HDPS, and the results provide insig