
Research article · 2025 · Full text
International Journal of Agriculture and Food ScienceComparative economic analysis of Bt cotton and SAU cotton varieties in Tamil Nadu
Volume 7(5) · Pages 373–378 · DOI: 10.33545/2664844x.2025.v7.i5f.429 ↗
Research areasAgricultural Economics and Practices
Abstract
Author-writtenThe cotton sector in Tamil Nadu plays a vital role in rural livelihoods and agricultural income. This study conducts a comparative socioeconomic analysis between cotton varieties released by State Agricultural Universities (SAUs) and Bt cotton cultivated in the Perambalur district. Primary data were collected through structured interviews from 120 cotton farmers using a multistage random sampling technique. Analytical tools such as the Probit Model, Independent Sample t-Test, and Friedman Test were employed to assess varietal preference, income differences, and cultivation challenges. The findings reveal that while Bt cotton offers higher yields and profitability, SAU varieties are preferred for their seed affordability and resilience to climatic stress. However, marketing and pest management challenges persist across both systems. The study underscores the importance of promoting context-specific cotton varieties, enhancing extension services, and ensuring better market linkages for improving farmers' welfare and sustainable cotton cultivation.
Summary
Source-checkedPlain-language reading of the full paper, prepared with AI and checked against the text. Each point links to the authors' own words.
Why it matters
- Cotton cultivation is essential for providing agricultural income and supporting rural livelihoods in Tamil Nadu. View evidence ↗
- There is a trade-off between Bt cotton, which provides higher profitability and yield, and State Agricultural University (SAU) varieties, which are more affordable and resilient to climate stress. View evidence ↗
The question
- The study aims to analyze the impact of cotton varieties released by State Agricultural Universities (SAUs) compared to Bt cotton in Tamil Nadu. View evidence ↗
What they did
- The research was conducted in the Virudhunagar and Perambalur districts, which were selected based on their large cotton cultivation areas. View evidence ↗
- The study sampled 60 farmers in total, with 30 from each district split equally between Bt cotton and SAU cotton users. View evidence ↗
- Primary data were gathered using structured face-to-face interviews with the participating farmers. View evidence ↗
- The researchers used a Probit Model to assess adoption factors and an Independent sample t-test to compare economic impacts. View evidence ↗
What they found
- Bt cotton farmers earned a significantly higher mean income (₹1,21,076) compared to SAU cotton farmers (₹84,898), a difference of ₹36,178. View evidence ↗
- The cost of cultivation was lower for Bt cotton (₹54,655) than for SAU cotton (₹57,400), with a mean difference of ₹2,745. View evidence ↗
- Bt cotton showed higher productivity, with a mean yield of 814.67 kg/ha compared to 605.67 kg/ha for SAU cotton. View evidence ↗
- Pesticide costs were lower for Bt cotton (₹9,585) than for SAU cotton (₹12,378), resulting in a saving of ₹2,793. View evidence ↗
- SAU cotton was perceived as slightly more sustainable than Bt cotton, with a mean score of 1.13 versus 1.00. View evidence ↗
- Socio-demographic factors, including age, education, and farm size, did not significantly influence the decision to adopt Bt cotton. View evidence ↗
What it means
- The authors conclude that while Bt cotton is the more profitable and cost-efficient choice, SAU cotton is viewed as slightly more sustainable. View evidence ↗
- The authors recommend policies to increase awareness of SAU varieties and improve their economic viability. View evidence ↗
Visual summary
1 visualsIllustrations explain the paper; they do not show study data.
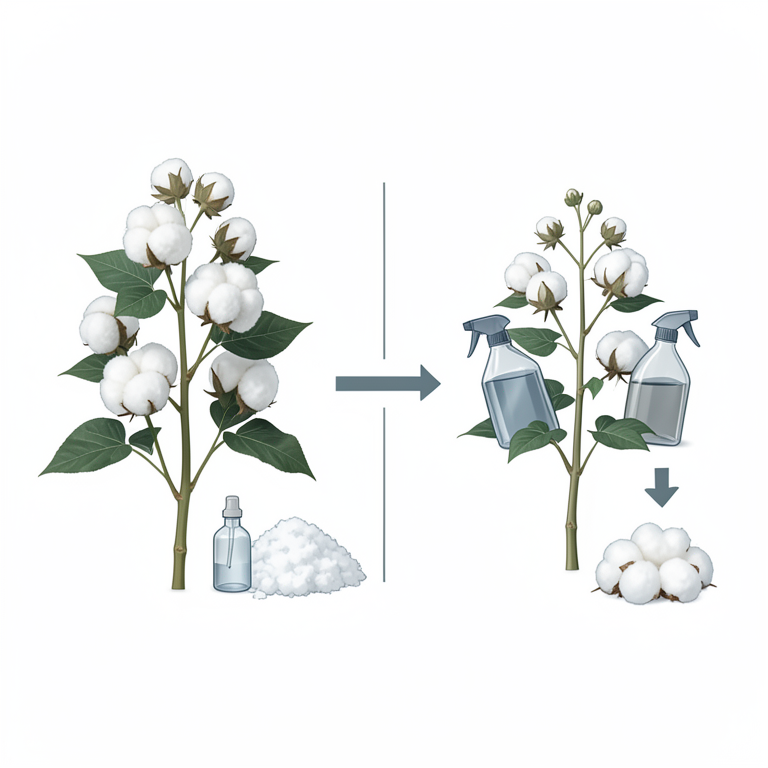
Economic Comparison of Cotton Varieties
AI-generated conceptual illustration (cotton plants (Gossypium hirsutum)). It explains the idea and does not show study data.
View source evidence ↗Figures & tables
From the original paper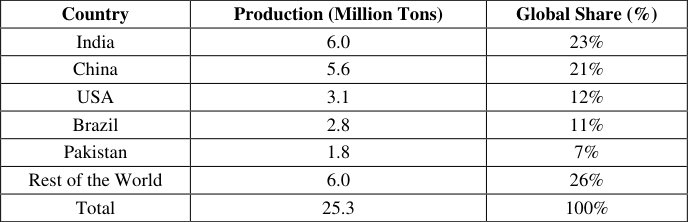 Table 1
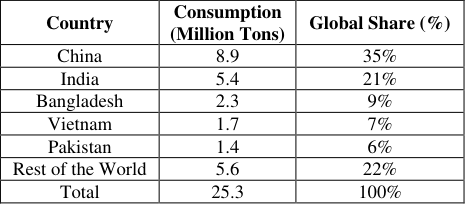 Table 2
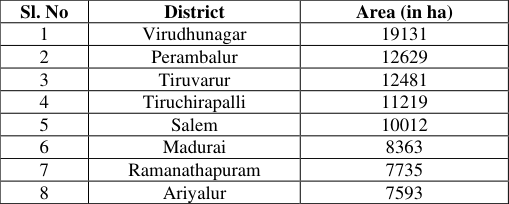 Table 3
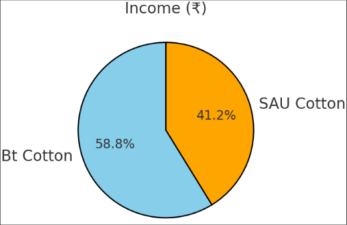 Figure 1
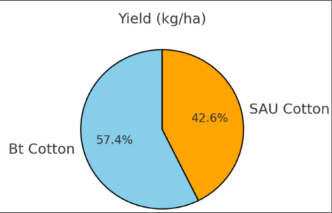 Figure 2
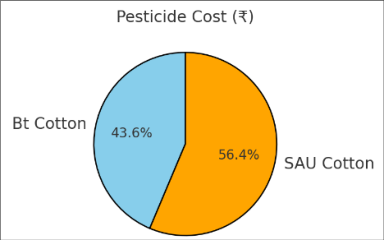 Figure 3
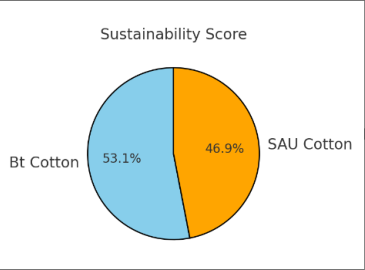 Figure 4
Introduction Global Cotton Production: Key Players
According to the United States Department of Agriculture (USDA) and International Cotton Advisory Committee (ICAC), the top five cotton-producing countries in 2024 are: India leads in cotton production, overtaking China and the USA, with over 12.5 million hectares under cultivation. China, although the second-largest producer, is the biggest consumer, utilizing most of its production domestically for textile manufacturing. The USA and Brazil dominate in cotton exports, while Pakistan heavily relies on cotton for its textile industry. China and India together account for over 50% of the world's cotton consumption. Bangladesh and Vietnam are emerging as major consumers due to their growing textile industries. The global demand for sustainable cotton is rising, with textile manufacturers increasingly sourcing organic and fair-trade cotton (Bhopala UD et al, 2023) [29] .
Global Cotton Trade: Leading Exporters and Importers
The global cotton trade is valued at over $60 billion annually, with raw cotton and cotton-based textiles being major commodities. India is a major exporter of raw cotton, with its primary markets being China, Bangladesh, and Vietnam. The USA and Brazil dominate in cotton exports due to their largescale mechanized farming and high productivity. China remains the largest cotton importer to support its textile industry.
Cotton's Role in the Textile Sector
Cotton is the backbone of India's textile industry, which is one of the largest in the world. Nearly 60% of the total fiber consumption in the textile sector comes from cotton. The industry spans the entire value chain, including, Ginning and spinning mills that process raw cotton into yarn. Weaving and knitting units that convert yarn into fabric. Garment and apparel manufacturing, which drives both domestic and export markets. The textile sector, heavily reliant on cotton, employs over 45 million people directly and another 60 million indirectly, making it one of the largest employment generators in the country. The export of cotton textiles contributes significantly to foreign exchange reserves, boosting the country's economy.
India's Cotton Export Market
India is a leading exporter of raw cotton, with China, Bangladesh, and Vietnam being the primary buyers. The country's abundant cotton production and competitive pricing make it a preferred supplier in the global market. Key factors driving India's cotton exports include, price competitiveness -Indian cotton is priced lower than that of many competitors, making it attractive to importers. Quality varieties: India offers a diverse range of cotton varieties, including Shankar-6 and MCU-5, which are highly sought after in the international market. Increasing global demand: Growing demand from textile industries in neighbouring countries, especially Bangladesh and Vietnam, boosts India's cotton export potential. In recent years, the devaluation of the Indian rupee has made cotton exports even more attractive, further strengthening India's position in the global market.
Objectives
The main objective of the present study is to analyse the Impact of Cotton Varieties Released by SAU's Vs Bt Cotton in Tamil Nadu. The specific objectives are; 1. To assess the adoption level and factors influencing farmer's preference for Bt cotton variety compared to SAU's cotton variety in Tamil Nadu. 2. To evaluate the economic impact of Bt cotton variety on farmer's income, cost of production, and profitability relative to SAU's cotton variety.
Hypotheses Null Hypothesis (Ho):
There is no significant difference in the adoption level between Bt cotton and SAU's cotton variety in Tamil Nadu.
Null Hypothesis (Ho): Bt cotton variety has no significant impact on farmer's income, cost of production, and profitability relative to SAU's cotton variety.
Review of literature 2.1 Yield Improvement
Peng Wan et al., (2017) [27] highlighted that hybridizing Bt cotton with non-Bt cotton slows pink bollworm resistance by creating a built-in refuge. An 11-year field study in China found that planting F2 hybrids (75% Bt, 25% non-Bt) reduced resistance while maintaining pest control. Farmers adopted the strategy for its economic benefits, including lower seed costs and reduced insecticide use. The study offers valuable insights into sustainable resistance management, relevant to your Bt cotton vs. SAU varieties research. Mallesh et al., (2021) revealed that Bt cotton fields had lower insect pest abundance and diversity compared to non-Bt fields. During the 2019-2020 cotton season, 25 insect pests were recorded in Bt cotton and 38 in non-Bt cotton. Hemiptera was the most dominant order, followed by Lepidoptera and Orthoptera. Non-Bt cotton fields exhibited higher pest diversity, indicating that Bt cotton is more effective in controlling insect pests. The study emphasizes the need for pest management strategies to sustain cotton productivity.
Environmental and Pest Control Effects
Wang et al., (2019) [28] analyzed the resistance mechanism of pink bollworm to Bt cotton in China. The study found that transposon insertion in the cadherin gene conferred resistance to Bt toxin Cry1Ac, reducing the efficacy of Bt cotton. This highlights the need for resistance management strategies.
Braswell et al., (2019) [7] [2] investigated the relationship between landscape composition and resistance selection in Bt cotton systems. The study found that the abundance of maize, cotton, and soybean influenced the effectiveness of resistance management strategies. Arshad et al., (2015) [4] compared the population dynamics of insect predators and parasitoids between Bt and non-Bt cotton fields in Pakistan. Field trials revealed no significant difference in the abundance of beneficial insects, concluding that Bt cotton does not negatively impact biological control agents under field conditions. Little et al., (2017) [13] evaluated the effectiveness of microbial and chemical insecticides for bollworm control on Bt and non-Bt cotton in the U.S. The study found that supplemental insecticide applications were effective on non-Bt cotton but unnecessary on Bt cotton due to lower bollworm densities. Malik et al., (2018) [15] assessed the efficacy of various insecticides in controlling sucking pests in Bt and non-Bt cotton fields in Pakistan. The study found that Bt cotton was more vulnerable to sucking pests due to reduced broadspectrum insecticide use, despite being effective against bollworms.
Li et al., (2015) [12] compared the physiological responses of Bt and conventional cotton under pathogen stress (Fusarium oxysporum). Bt cotton exhibited lower antioxidant enzyme activity and sugar content but higher protein content, along with reduced stomatal density, indicating physiological changes due to genetic modifications. Zeilinger et al., (2016) [30] investigated secondary pest outbreaks associated with Bt cotton in the southeastern USA. The study found that reduced broad-spectrum insecticide use in Bt cotton fields led to increased outbreaks of non-target pests (stink bugs), reducing the expected environmental and economic benefits.
Design of the study 3.1 Selection of Study Area
The study focuses on two districts: Virudhunagar and Perambalur, chosen through purposive sampling based on their significant cotton cultivation area. Virudhunagar has 19,131 hectares under cultivation and Perambalur covers 12,629 hectares.
Data Collection Methods
Primary Data: Collected through a structured interview schedule using face-to-face interviews. Secondary Data: Collected from government reports, TNAU publications, journals, and statistical records.
Sample Size
The total sample size is 60 farmers, distributed as follows, 30 farmers from Virudhunagar (15 Bt cotton + 15 SAU cotton) and 30 farmers from Perambalur (15 Bt cotton + 15 SAU cotton).
Sampling Technique
The study employs a two-stage sampling technique such as Stage 1: Purposive sampling for district selection based on cotton cultivation area. Stage 2: Snow ball sampling for farmer selection.
Tools and Analysis Objective 1: Probit Model
Objective 2: Independent sample t test
Results and Discussion
Results and Discussion
Objective 1: Adoption Level and Influencing Factors Objective:
To assess the adoption level and factors influencing farmers' preference for Bt cotton compared to SAU's cotton varieties in Tamil Nadu. A binary choice model used when the dependent variable is dichotomous (Bt cotton vs. SAU's cotton). Estimates the probability that a farmer chooses one variety over the other based on specific influencing factors. Suitable for modeling binary outcomes with relatively large sample sizes.
Key Findings 4.1.2 Goodness-of-Fit Test
Chi-Square: 0.933, Degrees of Freedom (df): 53, p-value: 1.000 → indicating a good model fit.
Interpretation
The Probit model results support the alternate hypothesis, confirming that yield is a statistically significant factor in Bt cotton adoption. Farmers prefer Bt cotton due to higher profits and increased production.
Objective 2: Economic Impact Comparison
Compares the means of two independent groups (Bt cotton vs. SAU's cotton) to determine if there is a statistically significant difference. Suitable when the data is approximately normally distributed with reasonable sample sizes.
Sustainability Perception
Bt Cotton (Mean Score): 1.00, SAU's Cotton (Mean Score): 1.13, Mean Difference: 0.133. SAU's cotton shows a slightly better sustainability perception. However, the difference is small and less impactful compared to yield and income differences.
Conclusion 5.1.1 Adoption Factors
The study revealed that yield is the most significant factor influencing farmer's adoption of Bt cotton over SAU's varieties in Tamil Nadu. The Probit model analysis demonstrated that the probability of farmers choosing Bt cotton increases substantially with higher yield potential. This indicates that farmers prioritize productivity and profit potential when selecting cotton varieties. The Goodness-of-Fit test confirmed the reliability of the model, with a chi-square value of 0.933, degrees of freedom of 53, and a p-value of 1.000, indicating a strong model fit. The results showed that variables such as age, education, and farm size had no significant impact on adoption decisions. This suggests that farmer's preference is primarily driven by yield performance rather than sociodemographic characteristics. The findings support the alternate hypothesis, confirming that Bt cotton's superior yield performance significantly influences adoption decisions. This aligns with previous research, which highlights that farmers adopt genetically modified (GM) crops primarily for their yield stability and pest-resistant properties. The higher yield potential makes Bt cotton the preferred choice, as it offers greater profitability and resilience against bollworm infestations, which are common in Tamil Nadu's cotton-growing regions.
Economic Impact
The Independent Sample t-test showed Bt cotton farmers earn significantly more than SAU cotton farmers, with average incomes of ₹1,21,076 and ₹84,898 respectively (mean difference ₹36,178; t = 6.583, p = 0.000). Key reasons for this income gap include: 1. Higher Yield: Bt cotton yielded 814.67 kg/ha vs. 605.67 kg/ha for SAU cotton (difference = 209 kg/ha; t = 20.398, p = 0.000). 2. Lower Pesticide Cost: Bt farmers spent ₹9,585 on pesticides, compared to ₹12,378 for SAU (difference = ₹2,793; t = -8.881, p = 0.000). 3. Lower Cultivation Cost: Bt cotton had a slightly lower average cost of cultivation (₹54,655 vs. ₹57,400; difference = ₹2,745; t = -1.296, p = 0.020).
However, SAU cotton scored slightly better on sustainability perception (mean score: 1.13 vs. 1.00; t = 2.112, p = 0.039), possibly due to its ecological adaptability. Conclusion: Bt cotton is more profitable due to better yield and cost-efficiency, but SAU cotton is seen as slightly more sustainable.
Policy Implications
Policy Implications
Acknowledgement
AcknowledgementsThe authors express their sincere gratitude to the Department of Agricultural Economics, Institute of Agriculture Research and Technology (IART), NMV University, Aruppukottai, Madurai, for their academic guidance and continuous support throughout this study.
Figures and tables from the paper
| Country | Production (Million Tons) | Global Share (%) |
|---|---|---|
| India | 6.0 | 23% |
| China | 5.6 | 21% |
| USA | 3.1 | 12% |
| Brazil | 2.8 | 11% |
| Pakistan | 1.8 | 7% |
| Rest of the World | 6.0 | 26% |
| Total | 25.3 | 100% |
Table text extracted from the original PDF; superscript letters are shown inline. The original table image is below.
View original table image
| Country | Consumption (Million Tons) | Global Share (%) |
|---|---|---|
| China | 8.9 | 35% |
| India | 5.4 | 21% |
| Bangladesh | 2.3 | 9% |
| Vietnam | 1.7 | 7% |
| Pakistan | 1.4 | 6% |
| Rest of the World | 5.6 | 22% |
| Total | 25.3 | 100% |
Table text extracted from the original PDF; superscript letters are shown inline. The original table image is below.
View original table image
| Sl. No | District | Area (in ha) |
|---|---|---|
| 1 | Virudhunagar | 19131 |
| 2 | Perambalur | 12629 |
| 3 | Tiruvarur | 12481 |
| 4 | Tiruchirapalli | 11219 |
| 5 | Salem | 10012 |
| 6 | Madurai | 8363 |
| 7 | Ramanathapuram | 7735 |
| 8 | Ariyalur | 7593 |
Table text extracted from the original PDF; superscript letters are shown inline. The original table image is below.
View original table image
References
30 in the original paper- Saravanan S, Mohanasundaram V. Development and adoption of Bt cotton in India: economic, environmental and health issues. 2016. p. 1-19.
- Orphal J. Comparative analysis of the economics of Bt and non-Bt cotton production. Inst. für Gartenbauökonomie; 2005. p. 1-7.
- Arends B, Haase E, Hohmann F, Hommel B, Vilcinskas A, Ehlers R-U. Effectiveness of the natural resistance management refuge for Bt-cotton is dominated by local abundance of soybean and maize. Sci Rep. 2021;11(1):17601.
- Arshad M, Suhail A, Aslam M, Abbas G, Karar H, Faheem M, et al. Incidence of insect predators and parasitoids on transgenic Bt cotton in comparison to non-Bt cotton varieties. Pak J Zool. 2015;47(3):823829.
- Ashok KR, Uma K, Prahadeeswaran M, Jeyanthi H. Economic and environmental impact of Bt cotton in India. Indian J Agric Econ. 2012;67(3):1-6.
- Ashok KR, Uma K, Prahadeeswaran M, Jeyanthi H. Economic and environmental impact of Bt cotton in India. Indian J Agric Econ. 2012;67:3.
- Braswell LR, Perera OP, O'Connell K, Siebert MW, Stewart SD, Greene JK, et al. Development and dispersal of Helicoverpa zea (Lepidoptera: Noctuidae) on non-Bt and Bt pyramided cotton. Environ Entomol. 2019;48(2):465-477.
- Gayathri R, Karunakaran KR. Impact of Bt cotton technology in an Indian cotton production system: a comparative econometric analysis between Maharashtra and Tamil Nadu. J Appl Nat Sci. 2022;1-6.
- Ibrahim M, Riaz M, Javed A, Iqbal M, Qaisrani SA, Shakoori AR. Studies on correlations between soil chemistry and bacterial population in rhizosphere of Bt and non-Bt cotton and characterization of rhizobacteria. J Taibah Univ Sci. 2020;14(1):1463-1474.
- Kathage J, Qaim M. Economic impacts and impact dynamics of Bt (Bacillus thuringiensis) cotton in India. Proc Natl Acad Sci U S A. 2012;109(29):11652-11656.
- Kranthi KR, Stone GD. Long-term impacts of Bt cotton in India. Nat Plants. 2020;6(3):188-196.
- Li X, Liu X, Wu J, Bai Y, Zeng J, Zhang Z, et al. Comparison of the physiological characteristics of transgenic insect-resistant cotton and conventional lines. Sci Rep. 2015;5(1):8739.
- Little NS, Luttrell RG, Allen KC, Greene JK, Temple JH, Lorenz GM, et al. Effectiveness of microbial and chemical insecticides for supplemental control of bollworm on Bt and non-Bt cottons. J Econ Entomol. 2017;110(3):1039-1051.
- Lu Y, Wu K, Jiang Y, Guo Y, Desneux N. Bt cotton area contraction drives regional pest resurgence, crop loss, and pesticide use. Plant Biotechnol J. 2022;20(2):390-398.
- Malik SU, Saeed Q, Iqbal J, Naeem M, Abbas G, Shah SAH, et al. Comparative efficacy of different insecticides and estimation of yield losses on Bt and non-Bt cotton for thrips, red cotton bug, and dusky cotton bug. J Entomol Zool Stud. 2018;6:505-512.
- Modala M, Sravanthy C. Seasonal diversity and abundance of insect pests in Bt and non-Bt cotton fields. Uttar Pradesh J Zool. 2021;42(22):88-96.
- Niranjan N, Udikeri SS. Incidence pattern of pink bollworm, Pectinophora gossypiella (Saund.) on different event Bt and non-Bt cottons. J Farm Sci. 2023;36(2):168-71.
- Noonari S, Kalwar GY, Jamroo AS. Comparative economics analysis of the Bt cotton vs conventional cotton production in Khairpur District, Sindh, Pakistan. Int J Bus Econ Res. 2015;4(3):72-85.
- Sadashivappa P. Socio-economic impacts of Bt cotton adoption in India: evidence from panel data. 2015. p. 193-208.
- Rani SU, Selvaraj G. Bt cotton in Tamil Nadu: an evaluation of farmers' experiences. Indian Res J Ext Educ. 2013;13(3):64-70.
- Marral R, Waseem M, Zia A, Nasir S, Razaq M, Ahmad M, et al. The influence of transgenic (Bt) and non-transgenic (non-Bt) cotton mulches on weed International Journal of Agriculture and Food Science https://www.agriculturaljournals.com dynamics, soil properties and productivity of different winter crops. PLoS One. 2020;15(9):e0238716.
- Samak ANR, Patil SS, Patil SC, Bhosale RR, Goud JV, Khadi BM. Genetic diversity analysis in Bt introgressed and non-Bt lines of upland cotton (Gossypium hirsutum L.). Electron J Plant Breed. 2021;12(4):1069-1074.
- Sankaranarayanan K, Chandrasekaran B, Balasubramanian TN, Somasundaram E, Sathyamoorthy P, Arokiaraj S, et al. Evaluation of Bt (Bacillus thuringiensis) and non-Bt cotton (Gossypium hirsutum) hybrids under varied planting time. Indian J Agron. 2011;56(1):68-73.
- Singh S. Transgenic cotton-its adoption, threats and challenges ahead: a review. J Entomol Zool Stud. 2018;6(5):1989-1997.
- Subramanian A. Sustainable agriculture and GM crops: the case of Bt cotton impact in Ballari District of India. Front Plant Sci. 2023;14:1102395.
- Tokel D, Genc BN, Ozyigit II. Economic impacts of Bt (Bacillus thuringiensis) cotton. J Nat Fibers. 2022;19(12):4622-4639.
- Wan P, Xu D, Cong S, Li H, Wu H, Huang M, et al. Hybridizing transgenic Bt cotton with non-Bt cotton counters resistance in pink bollworm. Proc Natl Acad Sci U S A. 2017;114(21):5413-5418.
- Wang L, He K, Zhang J, Zuo Y, Bai S, Wang Z, et al. Transposon insertion causes cadherin mis-splicing and confers resistance to Bt cotton in pink bollworm from China. Sci Rep. 2019;9(1):7479.
- Bhopala UD, Dhandhalya MG, Rathod RB. Spatiotemporal dynamics in cotton area, production and productivity: A worldwide scenario. Int J Stat Appl Math 2023;8(6):183-186. DOI: 10.22271/maths.2023.v8.i6b.1540
- Zeilinger AR, Olson DM, Andow DA. Competitive release and outbreaks of non-target pests associated with transgenic Bt cotton. Ecol Appl. 2016;26(4):10471054.