
Research article · 2026 · Full text
International Journal of Agriculture and NutritionEffectiveness of below-the-line marketing touchpoints on consumer awareness, engagement and dairy product preferences in Bengaluru, India
Volume 8(7) · Pages 41–46 · DOI: 10.33545/26646064.2026.v8.i7a.703 ↗
Research areasMarketing and Advertising StrategiesConsumer Behavior and Marketing InfluenceConsumer Behavior in Brand Consumption and Identification
Abstract
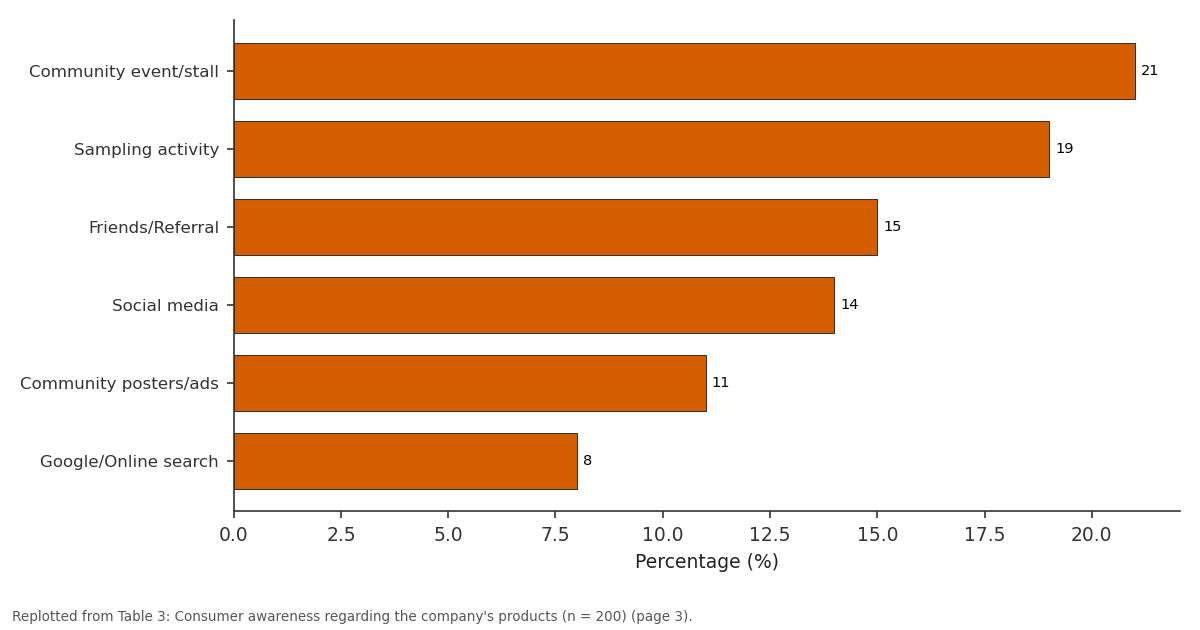
Author-writtenBelow-the-line (BTL) marketing has emerged as an effective promotional strategy for enhancing consumer awareness, engagement, and purchase behaviour in the premium dairy sector. The study evaluates the socio-economic profile of consumers, assesses their awareness of the company’s dairy products, examines the effectiveness of BTL touchpoints and analyses consumer preferences in Bengaluru city. Primary data were collected from 200 consumers using a structured questionnaire through purposive sampling. The collected data were analysed using descriptive statistics, Likert scale analysis, and Garrett ranking technique. The findings revealed that the majority of respondents were middle-aged (35-50 years), graduates, and belonged to higher-income households. Overall, consumer awareness regarding the company’s products was moderate, with 52.00 per cent of respondents being aware of the brand. Community events (21.00%) and product sampling (19.00%) were identified as the major sources of brand awareness, while product sampling (23.00%) emerged as the most effective BTL activity in enhancing consumer engagement. Milk was the most frequently purchased and preferred dairy product, with A2/Desi cow milk being the most preferred milk variant. Garrett ranking indicated that product quality, freshness, and trust and transparency were the primary factors influencing consumer preference for premium dairy brands, whereas quality testing, freshness and taste, and doorstep delivery were the leading reasons for preferring the company. The study concludes that experiential BTL activities, supported by superior product quality, transparency, and convenient delivery services, play a significant role in strengthening consumer awareness, engagement, preference, and long-term brand loyalty in Bengaluru's premium dairy market.
Summary
Source-checkedPlain-language reading of the full paper, prepared with AI and checked against the text. Each point links to the authors' own words.
Why it matters
- Milk is a critical part of the Indian diet and India is the world's largest producer, providing 25% of the global output. View evidence ↗
- Urbanization and increased health awareness have led consumers to prefer branded, packaged dairy products that prioritize safety and quality. View evidence ↗
- Below-the-line (BTL) marketing is valuable for premium brands because it allows consumers to experience quality directly, which reduces perceived risk and builds trust. View evidence ↗
The question
- The study aims to analyze the socio-economic profile of consumers in Bengaluru and evaluate how BTL promotional touchpoints influence their awareness, engagement, and preferences for a specific company's dairy products. View evidence ↗
What they did
- The researchers collected primary data from 200 consumers in Bengaluru using purposive sampling and structured questionnaires. View evidence ↗
- Data analysis was performed using frequency and percentage analysis, cross-tabulation, Likert scale weighted mean scores, and the Garrett ranking technique. View evidence ↗
What they found
- The sample consisted of a balanced age distribution, with the largest group being 35-50 years (34.5%), and 55.0% of respondents coming from higher-income households earning above ₹4,00,000 annually. View evidence ↗
- Consumer awareness of the company's brand was moderate, with 52.0% of respondents being aware and 48.0% unaware. View evidence ↗
- Community events/stalls (21.0%) and product sampling (19.0%) were the most effective sources of brand awareness, performing better than posters (11.0%) and Google searches (8.0%). View evidence ↗
- Product sampling was the most effective BTL activity for enhancing engagement (23.0%), followed by stall promotions (19.0%) and kids' engagement events (17.0%). View evidence ↗
- Milk was the most preferred (72.0%) and frequently purchased (48.5%) product, with A2/Desi cow milk being the most preferred variant (32.0%). View evidence ↗
- The primary drivers for selecting dairy brands were quality and freshness (21.0%), followed by price/value (19.0%), doorstep delivery (17.0%), and trust/transparency (16.0%). View evidence ↗
- The top reasons for preferring the specific company were quality testing (61.74), freshness and taste (56.35), and doorstep delivery (54.33). View evidence ↗
What it means
- The authors conclude that dairy companies can improve market performance by using regular sampling, community engagement, and interactive events to build awareness. View evidence ↗
- The study's findings may not be generalizable to all consumer groups because it was limited to purposively selected respondents in Bengaluru city. View evidence ↗
Visual summary
2 visualsIllustrations explain the paper; charts are replotted from the paper's own table values.
Percentage (%): Community event/stall vs Sampling activity vs Friends/Referral vs Social media vs Community posters/ads
Replotted from Table 3 (page 3) of the original paper. Every bar is the paper's own table value.
View source evidence ↗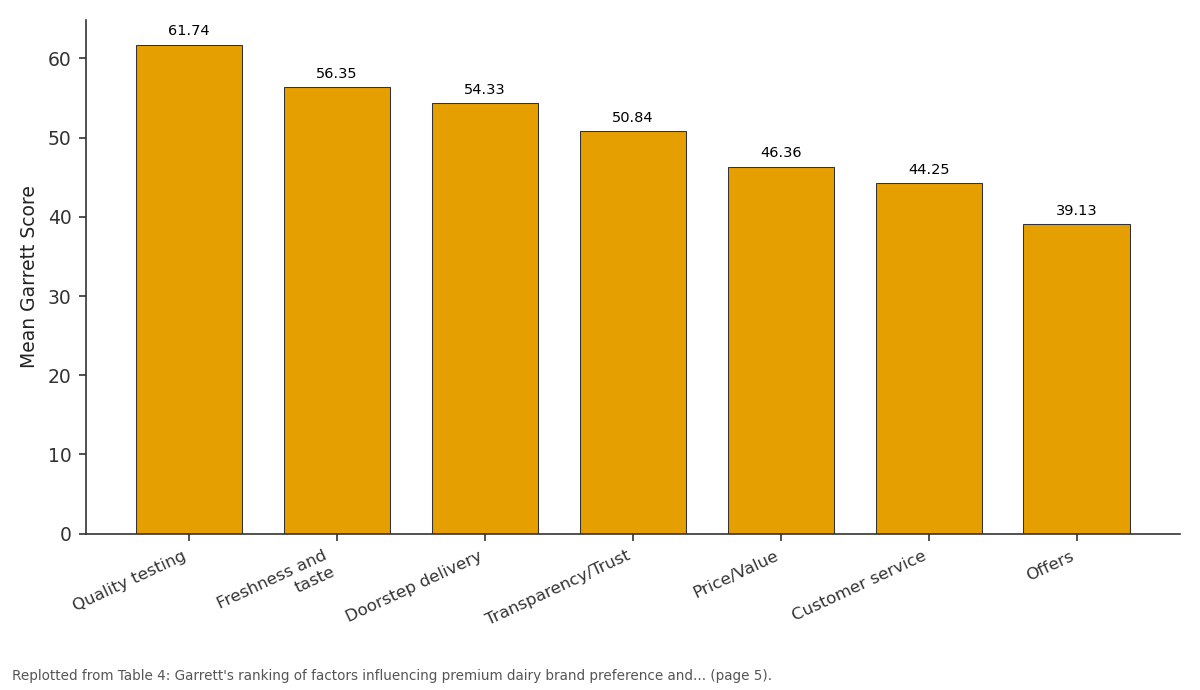
Mean Garrett Score: Quality testing vs Freshness and taste vs Doorstep delivery vs Transparency/Trust vs Price/Value
Replotted from Table 4 (page 5) of the original paper. Every bar is the paper's own table value.
View source evidence ↗Figures & tables
From the original paper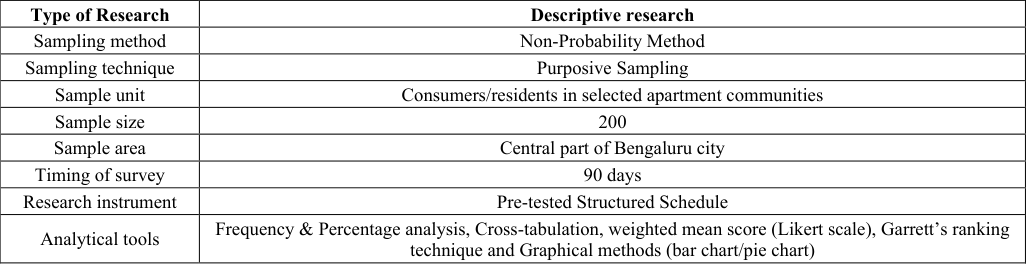 Table 1
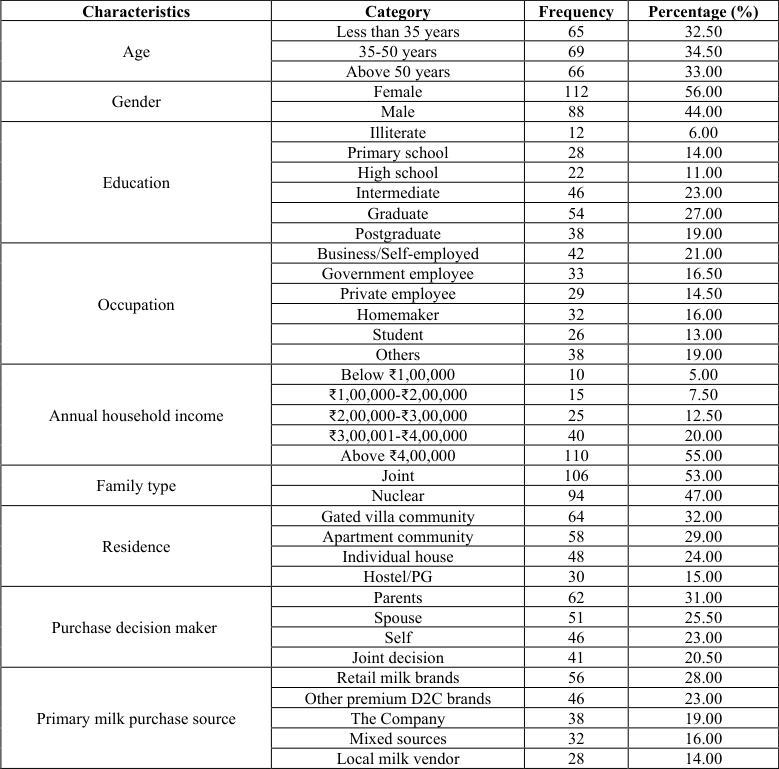 Table 2
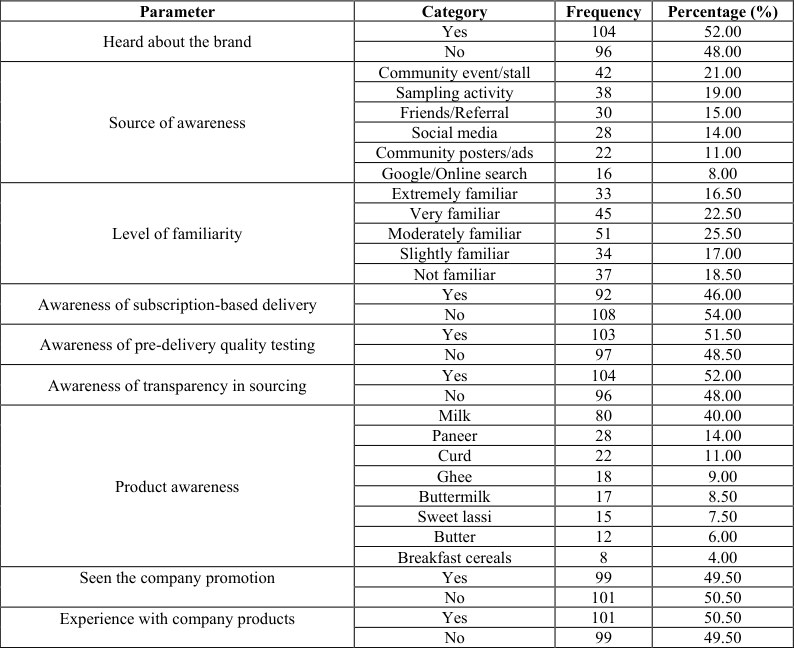 Table 3
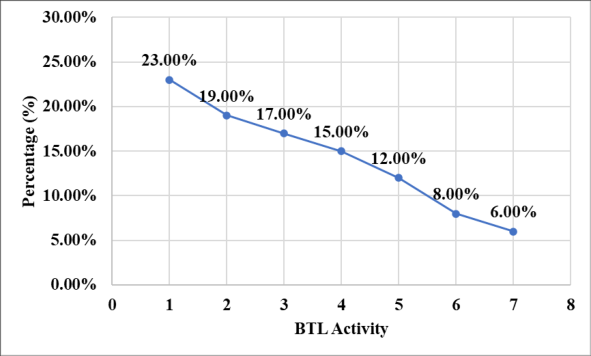 Figure 1
 Table 4
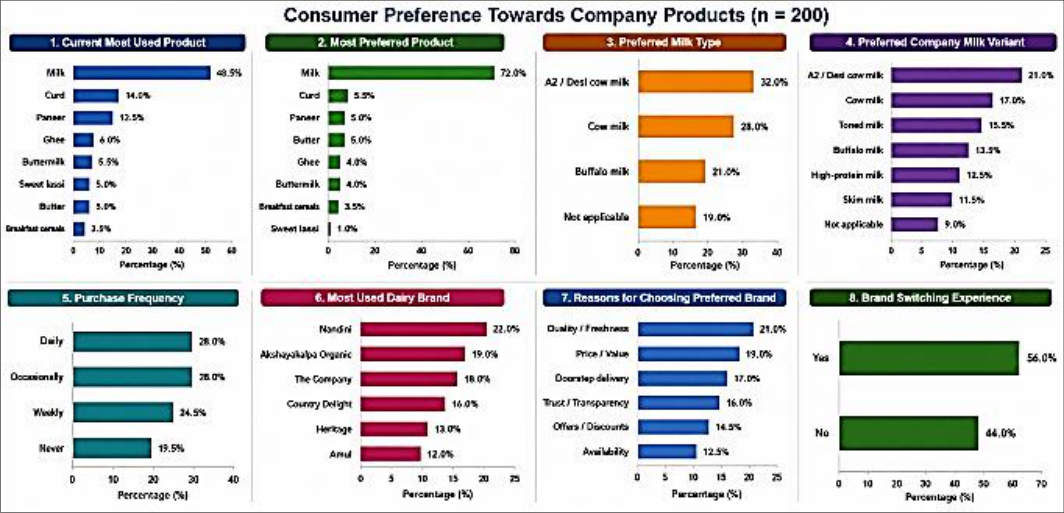 Figure 2
Introduction
Milk is integral to Indian diets, providing essential protein, calcium, and vitamins (FAO, 2025). India is the world's largest milk producer, contributing 25% of global output through improved productivity and infrastructure (PIB, 2024). The dairy sector is vital to the rural economy, supporting small farmers and national growth. Initiatives like the White Revolution and Operation Flood strengthened cooperative networks and distribution (NDDB, 2023; PIB, 2024). Urbanization and health awareness have shifted preferences toward packaged, branded products, with consumers prioritizing safety, quality, and transparency (Ali & Kapoor, 2010;FSSAI, 2019). Purchasing decisions now hinge on quality, freshness, and brand credibility (Tamilchelvi & Lavanya, 2019). Advances in food processing and quality preservation have further reinforced consumer demand for premium dairy and functional food products, highlighting the importance of maintaining physicochemical quality, bioactive compounds, and nutritional attributes throughout processing and distribution (Sen et al., 2026). Satisfaction depends on product attributes and service factors like timely delivery, which drive brand loyalty (Grunert, 2005;Kotler & Keller, 2016). Direct-to-Consumer (D2C) models have transformed supply chains by enabling direct producer-consumer interaction, reducing intermediary dependence, and enhancing convenience via digital subscription services (CARE Ratings, 2020; IBEF, 2024) [1, 2, 3, 4, 5, 7, 17, 18, 19] . Premium brand success requires effective marketing to build long-term relationships. Below-the-Line (BTL) activities, such as product sampling and community campaigns, are increasingly important. These strategies allow consumers to experience product quality directly, reducing purchase risk and strengthening trust. Such personalized approaches are highly effective for premium brands where customer experience influences decisions. Recent agricultural advances show that technological innovation, quality assurance, and consumer confidence are interconnected. Research on hydroinformatics, AI, and climate-resilient systems emphasizes data-driven decisionmaking and efficient resource management for productivity (Kumar et [8, 9, 10, 11, 13, 14, 16] . These factors are fundamental to market competitiveness in premium agri-food sectors. While studies examine dairy consumption, research on the effectiveness of Below-the-Line (BTL) promotional activities in the premium dairy segment is limited. Moreover, integrated studies on socio-economic characteristics, brand preferences, and brand-switching under a Direct-to-Consumer (D2C) model are scarce, particularly in cities like Bengaluru. Despite increasing adoption of experiential marketing by premium dairy brands, empirical evidence regarding the effectiveness of BTL touchpoints on consumer awareness, engagement and purchase preference remains limited, particularly in urban D2C dairy markets. Therefore, this study aims to analyse the socio-economic profile of consumers in Bengaluru city and examine their awareness, engagement and preferences towards the company's dairy products. It further evaluates the effectiveness of below-theline promotional touchpoints in influencing consumer behaviour.
Methodology
Primary data were collected through personal interaction with respondents by using a structured questionnaire from 200 consumers selected through purposive sampling in residential societies and apartment complexes. The responses obtained from the consumers were carefully analysed using appropriate statistical and analytical tools. The study focused on examining the socio-economic profile, consumption patterns, effectiveness of BTL promotional activities, and key factors influencing consumer purchase decisions towards premium dairy products.
Results and discussion
In line with the objectives of the study, this chapter presents and discusses the findings of the research titled "Evaluation of below-the-line touchpoints and dairy products preference in Bengaluru city." The results are based on primary data collected directly from consumers through personal interviews, providing a clear understanding of their awareness, preferences, and responses to BTL promotional activities in the dairy sector.
Socio-economic profile of consumers
The socio-economic profile ( Overall, these educated, stable, urban consumers are ideal for assessing preferences and BTL promotional effectiveness in the premium dairy sector.
Level of consumer awareness regarding the Company's products
Level of consumer awareness regarding the Company's products
Consumer Preference Towards Company Products
Figure 2 presents the consumer preference pattern for the company's dairy products. Milk emerged as both the most frequently purchased (48.5%) and the most preferred (72.0%) product, indicating its dominant position in the product portfolio. Traditional dairy products such as curd and paneer also recorded moderate consumer preference. In contrast, value-added products, including butter, sweet lassi, breakfast cereals, and buttermilk, received comparatively lower preference, suggesting greater acceptance of staple dairy products over processed alternatives. With respect to milk preference, A2/Desi cow milk was the most preferred milk type (32.0%), followed by regular cow milk (28.0%) and buffalo milk (21.0%). Similarly, among the company's milk variants, the A2/Desi cow milk variant ranked first (21.0%), followed by cow milk (17.0%) and toned milk (15.5%), reflecting increasing consumer inclination towards premium and health-oriented dairy products. The purchasing pattern showed that daily and occasional purchases each accounted for 28.0%, while 24.5% of respondents purchased products weekly, indicating regular consumer engagement with dairy products. However, 19.5% of respondents had never purchased the company's products, highlighting potential opportunities for customer acquisition. Among dairy brands, Nandini (22.0%) was the most widely used brand, followed by Akshayakalpa Organic (19.0%), while the company ranked third (18.0%), demonstrating strong competition in Bengaluru's organized dairy market. Consumers primarily selected dairy brands based on quality and freshness (21.0%), followed by price/value (19.0%), doorstep delivery (17.0%), and trust and transparency (16.0%), indicating that product quality and convenience were the major determinants of purchase decisions. Furthermore, 56.0% of respondents reported having switched dairy brands, suggesting that consumers are willing to change brands when they perceive better quality, freshness, value for money, convenience, or trust. Overall, the findings reveal that consumer preference in the premium dairy segment is primarily driven by product quality, health benefits, convenience, and brand reliability, while premium milk variants, particularly A2/Desi cow milk, are gaining increasing acceptance among urban consumers.
Factors influencing consumer preference for premium dairy brands and the company
The Garrett ranking analysis presented in Table 4 highlights the key factors influencing consumers' preference for premium dairy brands and the specific reasons for preferring the company. For premium dairy brands in general, quality of the product emerged as the most influential factor with the highest mean Garrett score (57.26), followed by freshness (53.21) and trust/transparency (52.33).
| Factors influencing premium dairy brand preference | Mean Garrett Score | Rank | Reasons for preferring the company | Mean Garrett Score | Rank |
|---|---|---|---|---|---|
| Quality of product | 57.26 | I | Quality testing | 61.74 | I |
| Freshness | 53.21 | II | Freshness and taste | 56.35 | II |
| Trust/Transparency | 52.33 | III | Doorstep delivery | 54.33 | III |
| Doorstep delivery | 51.28 | IV | Transparency/Trust | 50.84 | IV |
| Price | 48.32 | V | Price/Value | 46.36 | V |
| Brand image | 47.05 | VI | Customer service | 44.25 | VI |
| Offers/Discounts | 42.57 | VII | Offers | 39.13 | VII |
Table text extracted from the original PDF; superscript letters are shown inline. The original table image is below.
View original table image
preference, while price/value (46.36), customer service (44.25), and offers (39.13) were ranked lower. The similarity in rankings across both analyses demonstrates that consumers consistently prioritize quality assurance, product freshness, trust, and convenience over promotional benefits. Overall, the findings suggest that maintaining superior product quality, ensuring rigorous quality testing, enhancing transparency, and providing reliable doorstep delivery are the most effective strategies for strengthening consumer preference and brand loyalty in the premium dairy market.
Conclusion
The study revealed that the majority of consumers were middle-aged, well-educated, and belonged to moderate to high-income groups, reflecting typical urban household characteristics. Consumers showed moderate awareness and familiarity with dairy brands, indicating scope for improvement in deeper brand understanding. The findings highlight that consumers generally prefer fresh and highquality dairy products, with milk, curd, and paneer being the most commonly consumed items. However, despite the growing preference for premium dairy products, consumer decisions are influenced by multiple factors such as price, quality, convenience, and trust. The study also identified that while awareness exists, gaps remain in effective communication and understanding of certain product practices. These findings suggest that although the market potential is strong, improvements are required in awareness-building and consumer engagement strategies. Dairy companies can enhance their market performance by increasing consumer awareness through regular sampling activities, community engagement programmes, and interactive promotional events. These initiatives can help improve brand familiarity and build stronger connections with consumers. Efforts should also be made to communicate product benefits, quality standards, and practices more clearly to enhance consumer understanding and trust.
Limitations
The study is limited to Bengaluru city and purposively selected respondents. Therefore, the findings may not be generalized to all consumer groups. Future studies may employ probability sampling across multiple metropolitan cities.
Figures and tables from the paper
| Type of Research | Descriptive research |
|---|---|
| Sampling method | Non-Probability Method |
| Sampling technique | Purposive Sampling |
| Sample unit | Consumers/residents in selected apartment communities |
| Sample size | 200 |
| Sample area | Central part of Bengaluru city |
| Timing of survey | 90 days |
| Research instrument | Pre-tested Structured Schedule |
| Analytical tools | Frequency & Percentage analysis, Cross-tabulation, weighted mean score (Likert scale), Garrett’s ranking technique and Graphical methods (bar chart/pie chart) |
Table text extracted from the original PDF; superscript letters are shown inline. The original table image is below.
View original table image
| Characteristics | Category | Frequency | Percentage (%) |
|---|---|---|---|
| Age | Less than 35 years | 65 | 32.50 |
| 35-50 years | 69 | 34.50 | |
| Above 50 years | 66 | 33.00 | |
| Gender | Female | 112 | 56.00 |
| Male | 88 | 44.00 | |
| Education | Illiterate | 12 | 6.00 |
| Primary school | 28 | 14.00 | |
| High school | 22 | 11.00 | |
| Intermediate | 46 | 23.00 | |
| Graduate | 54 | 27.00 | |
| Postgraduate | 38 | 19.00 | |
| Occupation | Business/Self-employed | 42 | 21.00 |
| Government employee | 33 | 16.50 | |
| Private employee | 29 | 14.50 | |
| Homemaker | 32 | 16.00 | |
| Student | 26 | 13.00 | |
| Others | 38 | 19.00 | |
| Annual household income | Below ₹1,00,000 | 10 | 5.00 |
| ₹1,00,000-₹2,00,000 | 15 | 7.50 | |
| ₹2,00,000-₹3,00,000 | 25 | 12.50 | |
| ₹3,00,001-₹4,00,000 | 40 | 20.00 | |
| Above ₹4,00,000 | 110 | 55.00 | |
| Family type | Joint | 106 | 53.00 |
| Nuclear | 94 | 47.00 | |
| Residence | Gated villa community | 64 | 32.00 |
| Apartment community | 58 | 29.00 | |
| Individual house | 48 | 24.00 | |
| Hostel/PG | 30 | 15.00 | |
| Purchase decision maker | Parents | 62 | 31.00 |
| Spouse | 51 | 25.50 | |
| Self | 46 | 23.00 | |
| Joint decision | 41 | 20.50 | |
| Primary milk purchase source | Retail milk brands | 56 | 28.00 |
| Other premium D2C brands | 46 | 23.00 | |
| The Company | 38 | 19.00 | |
| Mixed sources | 32 | 16.00 | |
| Local milk vendor | 28 | 14.00 |
Table text extracted from the original PDF; superscript letters are shown inline. The original table image is below.
View original table image
| Parameter | Category | Frequency | Percentage (%) |
|---|---|---|---|
| Heard about the brand | Yes | 104 | 52.00 |
| No | 96 | 48.00 | |
| Source of awareness | Community event/stall | 42 | 21.00 |
| Sampling activity | 38 | 19.00 | |
| Friends/Referral | 30 | 15.00 | |
| Social media | 28 | 14.00 | |
| Community posters/ads | 22 | 11.00 | |
| Google/Online search | 16 | 8.00 | |
| Level of familiarity | Extremely familiar | 33 | 16.50 |
| Very familiar | 45 | 22.50 | |
| Moderately familiar | 51 | 25.50 | |
| Slightly familiar | 34 | 17.00 | |
| Not familiar | 37 | 18.50 | |
| Awareness of subscription-based delivery | Yes | 92 | 46.00 |
| No | 108 | 54.00 | |
| Awareness of pre-delivery quality testing | Yes | 103 | 51.50 |
| No | 97 | 48.50 | |
| Awareness of transparency in sourcing | Yes | 104 | 52.00 |
| No | 96 | 48.00 | |
| Product awareness | Milk | 80 | 40.00 |
| Paneer | 28 | 14.00 | |
| Curd | 22 | 11.00 | |
| Ghee | 18 | 9.00 | |
| Buttermilk | 17 | 8.50 | |
| Sweet lassi | 15 | 7.50 | |
| Butter | 12 | 6.00 | |
| Breakfast cereals | 8 | 4.00 | |
| Seen the company promotion | Yes | 99 | 49.50 |
| No | 101 | 50.50 | |
| Experience with company products | Yes | 101 | 50.50 |
| No | 99 | 49.50 |
Table text extracted from the original PDF; superscript letters are shown inline. The original table image is below.
View original table image
References
20 in the original paper- Ali J, Kapoor S. Buying behaviour of consumers for food products in an emerging economy. Br Food J. 2010;112(2):109-124.
- CARE Ratings. Indian dairy & dairy products industry. Special report. Mumbai: CARE Ratings; 2020.
- Food and Agriculture Organization of the United Nations. Per capita supply of milk (excluding butter). Rome: FAO; 2025.
- Food Safety and Standards Authority of India. National milk safety and quality survey 2018. New Delhi: FSSAI; 2019.
- Grunert KG. Food quality and safety: Consumer perception and demand. Eur Rev Agric Econ. 2005;32(3):369-391. DOI:10.1093/eurrag/jbi011.
- India Brand Equity Foundation. Dairy industry in India. New Delhi: IBEF; 2024.
- Kotler P, Keller KL. Marketing management. 15th ed. Noida: Pearson Education; 2016.
- Kumar N, Kumar D, Kumar R, Prajapati GV. Hydroinformatics-driven strategies for drought mitigation in agricultural systems. Dev Environ Sci. 2026;21:663-683.
- Kumar N, Kumar D, Kumar R, Prajapati GV, Kumari K. Assessing the impacts of climate and urban dynamics on peri-urban watershed vulnerability. Dev Environ Sci. 2026;21:13-34.
- Kumar N, Kumar D, Kumar R, Prajapati GV, Vadalia D. Integrating explainable AI with advanced learning models for groundwater management in semi-arid areas. In: Groundwater Depletion and Sustainability: A Methodology Utilizing Artificial Intelligence and Earth Observation Systems. Cham: Springer Nature Switzerland; 2026. p. 41-66.
- Kumar N, Kumar D, Kumar R, Prajapati GV, Vadalia D. Innovative AI and ML solutions for groundwater contamination and sustainable management. In: Groundwater Depletion and Sustainability: A Methodology Utilizing Artificial Intelligence and Earth Observation Systems. Cham: Springer Nature Switzerland; 2026. p. 29-52.
- Kumar N, Prajapati GV, Pandya PA, Kumar D. Leveraging drone technology to optimize irrigation practices through comprehensive soil and water monitoring. Plant Arch. 2025;25(Special Issue ICTPAIRS-JAU):211-216. DOI:10.51470/PLANTARCHIVES.2025.v25.SP.ICTP AIRS-033.
- Kumar N, Prajapati GV, Pandya PA, Das P, Bhargav AM, Parmar SH, et al. Comparative analysis of temporal spectral profiles of cumin and coriander using Sentinel2 imagery. Int J Agric Invent. 2026;11(1):293-299.
- Kumar N, Prajapati GV, Pandya P, Vadalia D, Parmar SH, Ranjan A. Integrated water resources management and hydrological innovations for climate resilience. In: Building Resilient Water and Food Systems under Climate Change. Academic Press; 2026. p. 161-174.
- Kumar N, Rai V, Kumar M, Chandra R, Aggarwal P, Jain SK. Assessing soil water dynamics and wheat growth under different irrigation and planting strategies using HYDRUS 2D. Hydrol Res. 2025;56(9):878-901.
- Kumari K, Dubey LR, Vahoniya DR, Bagda B, Sen S, Kumar N. A comparative analysis of socio-economic empowerment among tribal women SHG members and non-members in Gujarat, India. Arch Curr Res Int. 2026;26(4):633-645.
- National Dairy Development Board. NDDB and Operation Flood (White Revolution). Anand: NDDB; 2023.
- Press Information Bureau. India's milk production statistics. New Delhi: Government of India; 2024.
- Sen S, Chhetri PO, Tripathi AD, Singh GP, Agarwal A, Hooda A, et al. Physicochemical and metabolomic characterization of custard apple (Annona squamosa L.) pulp powder obtained by different drying methods. LWT. 2026;119:295.
- Tamilchelvi N, Lavanya M. A study on consumers awareness and consumption pattern of milk brands in Coimbatore city. J Emerg Technol Innov Res. 2019;6(2):585-590.