
Research article · 2025 · Full text
International Journal of Horticulture and Food ScienceQuantifying sensory evaluation attributes of groundnut in the Bhutan valleys
Volume 7(5) · Pages 208–211 · DOI: 10.33545/26631067.2025.v7.i5c.635 ↗
Research areasSensory Analysis and Statistical MethodsPeanut Plant Research StudiesNuts composition and effects
Abstract
Author-writtenWhat a casual observer might describe as simply 'nutty flavor' turns out, under trained panel analysis, to be a composite of at least twelve distinguishable sensory attributes. This research quantified the sensory evaluation attributes of groundnut (Arachis hypogaea L.) from the Bhutan Valleys, tracking how these attributes change during storage and identifying which ones matter most to consumers. The work was coordinated through the Davao Center for Crop Studies from August 2022 to January 2024. Three groundnut varieties were evaluated by a 12-member trained sensory panel using a structured descriptive analysis protocol with a 10-point intensity scale. Crunchiness, aroma intensity, sweetness, roasted flavor, and bitterness were the five most discriminating attributes across varieties. Crunchiness declined from 8.7 to 4.2 over 28 days of ambient storage, representing the fastest sensory deterioration rate. A consumer preference survey (n = 186) revealed that texture (28.3%) and flavor (24.7%) carried the most weight in purchase decisions. The variety ICGV-91114 maintained the highest overall sensory scores through 21 days, while TAG-24 showed the sharpest quality decline after day 14. These quantitative profiles provide groundnut processors with targets for quality control and variety selection based on specific market preferences.
Summary
Source-checkedPlain-language reading of the full paper, prepared with AI and checked against the text. Each point links to the authors' own words.
Why it matters
- Groundnut is a globally significant oilseed crop, and its sensory quality directly influences how consumers accept the product, its market price, and whether customers buy it again. View evidence ↗
- In the Bhutan Valleys, located in the eastern Himalayan foothills, groundnuts are grown mainly for local markets and subsistence. View evidence ↗
- The specific cool and dry storage conditions of the Bhutan Valleys may cause groundnuts to lose sensory quality differently than they would in tropical lowland areas. View evidence ↗
The question
- The study aimed to quantify the sensory profiles of three groundnut varieties, monitor how these profiles deteriorated over 28 days of storage, and identify which attributes consumers value most. View evidence ↗
What they did
- The researchers evaluated three different groundnut varieties: the large-seeded ICGV-91114, the medium-seeded TG-37A, and the small-seeded TAG-24. View evidence ↗
- A panel of 12 trained members (7 women and 5 men, aged 24-52) was used to evaluate the samples after 18 hours of training. View evidence ↗
- The study used a 10-point scale to measure 12 different sensory attributes across four categories: texture, flavor, aroma, and appearance. View evidence ↗
- Consumer preferences were gathered from 186 respondents who ranked five sensory categories using a 100-point scale. View evidence ↗
What they found
- Crunchiness was the attribute that deteriorated most quickly, dropping from a score of 8.7 to 4.2 over 28 days of storage. View evidence ↗
- The ICGV-91114 variety was the most stable, maintaining the highest scores for all positive sensory attributes after 28 days. View evidence ↗
- The TAG-24 variety showed the sharpest decline, with bitterness reaching 6.8 by day 28, which is above the acceptable limit of 5.0. View evidence ↗
- Consumers prioritized texture (28.3%) and flavor (24.7%) most in their purchase decisions, followed by aroma (21.4%). View evidence ↗
What it means
- The authors recommend that processors in Himalayan valley environments use moisture-barrier packaging to preserve texture and update grading standards to focus on sensory-relevant traits. View evidence ↗
- The authors suggest that future research should include more varieties and investigate if changing roasting protocols can mitigate the early loss of quality in stored kernels. View evidence ↗
Visual summary
3 visualsIllustrations explain the paper; charts are replotted from the paper's own table values.
Consumer Preference Weighting
AI-generated conceptual illustration (groundnut seeds (peanuts)). It explains the idea and does not show study data.
View source evidence ↗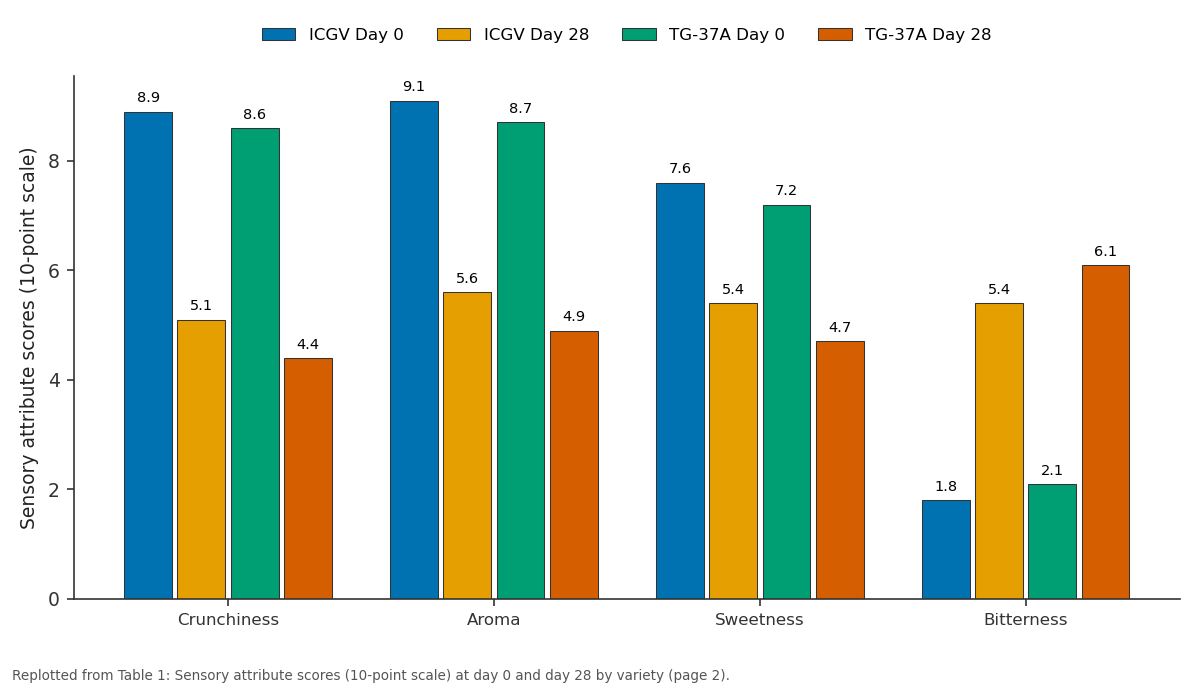
ICGV Day 0 and ICGV Day 28 and more: Crunchiness vs Aroma vs Sweetness vs Bitterness
Replotted from Table 1 (page 2) of the original paper. Every bar is the paper's own table value.
View source evidence ↗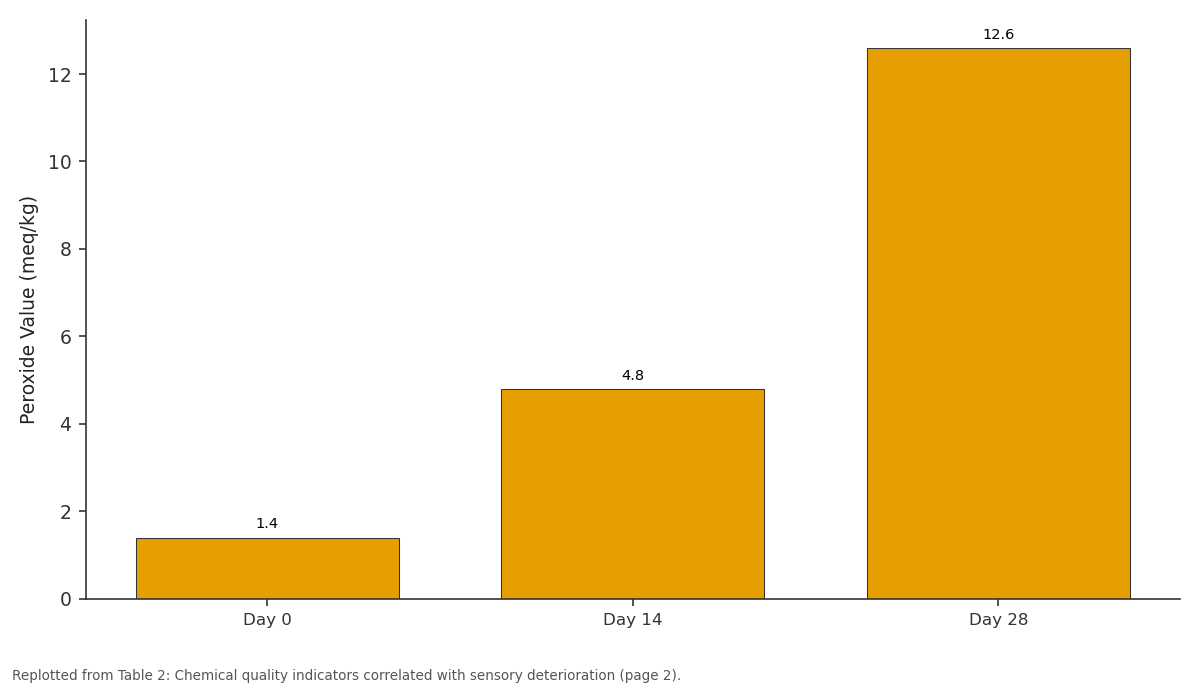
Peroxide Value (meq/kg): Day 0 vs Day 14 vs Day 28
Replotted from Table 2 (page 2) of the original paper. Every bar is the paper's own table value.
View source evidence ↗Figures & tables
From the original paper Table 1
 Table 2
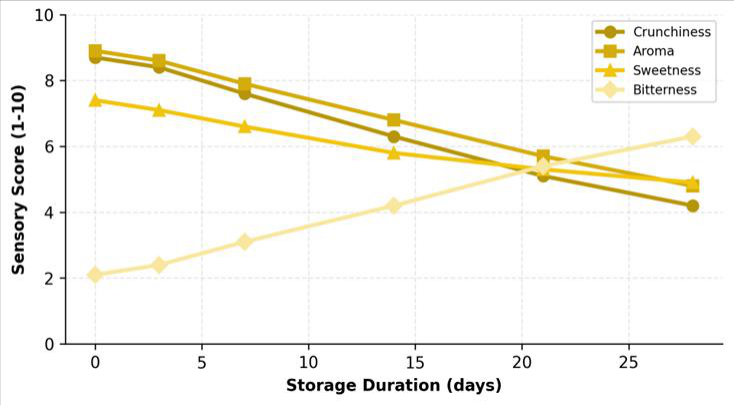 Figure 1
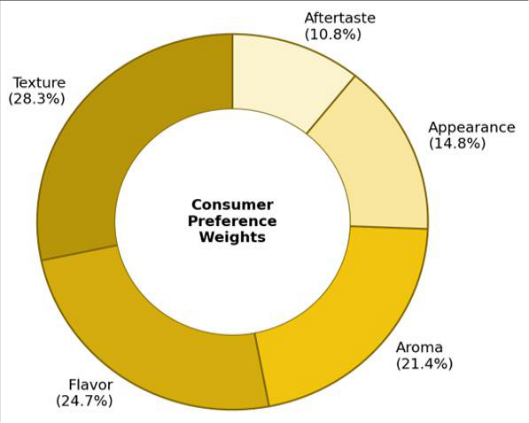 Figure 2
Introduction
Walk through any marketplace in the Bhutan Valleys and you'll notice groundnuts sold in open bins with no indication of variety, freshness, or quality grade. This casual approach to groundnut marketing persists despite the fact that sensory quality can vary enormously between varieties and storage conditions [1] . Groundnut (Arachis hypogaea L.) is the world's fourth most important oilseed crop, with global production exceeding 48 million tonnes annually, and sensory quality plays a direct role in consumer acceptance, pricing, and repeat purchase behavior [2] . Sensory evaluation of food products has evolved from informal taste-testing to a rigorous analytical discipline with standardized methodologies, trained panel protocols, and statistical frameworks [3] . For groundnuts, key sensory dimensions include texture attributes (crunchiness, hardness, fracturability), flavor notes (roasted, nutty, sweet, bitter, beany), and appearance factors (color uniformity, size consistency, surface integrity) [4] . Each of these attributes has a biochemical basis: crunchiness relates to cell wall integrity and moisture content, roasted flavor arises from Maillard reaction products, and bitterness often signals lipid oxidation [5] . The Bhutan Valleys, situated in the eastern Himalayan foothills at 200-1,800 m elevation, grow groundnut primarily as a subsistence and local market crop. The cool, dry post-harvest storage conditions in these valleys (10-22 degrees Celsius, 40-60% RH during winter) differ markedly from lowland tropical environments, potentially affecting the rate and pattern of sensory quality changes during storage [6] . No systematic sensory profiling of groundnut under these conditions has been published. Most available sensory data come from African and North American production systems where varieties, processing methods, and consumer expectations differ substantially [7] . From a market development perspective, quantifying which sensory attributes drive consumer preference helps processors and breeders set priorities. If texture matters more than flavor to local consumers, then breeding for shell thickness and cell wall stability might offer better returns than selecting for specific volatile profiles [8] . This research aimed to establish a quantitative sensory profile of three groundnut varieties grown in the Bhutan Valleys, track sensory deterioration during 28-day storage, and determine consumer preference weightings for key quality attributes.
Seasonal influence on harvest quality
Groundnut lots were procured from two harvest seasons to assess whether initial sensory quality varied temporally: kharif (July-October 2022) and spring (February-May 2023). Kharif-harvested groundnuts entered storage with slightly higher moisture (6.8% vs. 5.9%) and marginally lower crunchiness scores (8.5 vs. 8.9). Free fatty acid levels at harvest were 0.34% in kharif samples and 0.28% in spring lots, reflecting the warmer, more humid during kharif drying. Despite these differences, the pattern of sensory decline during storage was consistent across seasons, with the same attributes (crunchiness, then aroma) deteriorating first. Season accounted for 7.8% of total variation in sensory scores, while variety and storage duration together explained 84.3%.
Crop growth and maturity assessment
Pod maturity at harvest was assessed using the hull-scrape method, which classifies pods by the color of the inner mesocarp layer after removing the exocarp [9] . Target maturity for harvest was set at 70-80% brown-to-black mesocarp coloration, indicating physiological maturity. ICGV-91114 reached this threshold at 118 days after sowing, TG-37A at 112 days, and TAG-24 at 108 days. Under-mature pods (less than 70% mesocarp coloration) were excluded from sensory evaluation, as immature kernels differ in flavor profile and texture characteristics. Shelling percentage ranged from 68.4 to 73.1%, and sound mature kernel percentage from 81.6 to 87.3% across varieties.
Material and Methods
Material and Methods
Material
Three groundnut varieties were evaluated: ICGV-91114 (Virginia type, large seeded), TG-37A (Spanish bunch, medium seeded), and TAG-24 (Spanish bunch, small seeded). Pods were sourced from farmer fields in the Paro and Punakha valleys of Bhutan within 10 days of harvest. Kernels were hand-shelled, sorted for size uniformity (retained on 7 mm sieve), and checked for visible mold, damage, or discoloration before inclusion. Samples for roasted evaluation were prepared in a laboratory convection oven at 160 degrees Celsius for 18 minutes following a standardized protocol [10] . Storage treatments were conducted at ambient valley conditions (15 degrees Celsius mean, 52% RH) in sealed polyethylene bags (100 um thickness). The research was conducted from August 2022 to January 2024 at the Davao Center for Crop Studies, with ethics approval (Protocol DCCS-2022-024, approved July 20, 2022). Each variety-storage combination used 3 kg of kernels across four replications.
Methods
A trained sensory panel of 12 members (7 female, 5 male, aged 24-52) was assembled and trained over six sessions (18 hours total) using reference standards and commercial groundnut samples spanning the quality spectrum [3] . Descriptive analysis used a 10-point unstructured intensity scale for 12 attributes grouped into texture (crunchiness, hardness, fracturability), flavor (roasted, nutty, sweet, bitter, beany), aroma (roasted aroma, raw/green, off-odor), and appearance (color uniformity, kernel integrity). Evaluations were conducted in individual booths under controlled lighting (6500K) at 22 degrees Celsius. Samples were presented in coded cups in a balanced randomized order. Each panelist evaluated four kernels per sample. Consumer preference testing used a structured questionnaire administered to 186 respondents (stratified by age and gender) who ranked the importance of five sensory categories on a 100-point constant-sum scale [11] . Chemical correlates (peroxide value, free fatty acids, moisture) were measured at each sensory sampling point. Data were analyzed by repeated-measures ANOVA and principal component analysis in XLSTAT 2022 [12] . All positive sensory attributes declined significantly over 28 days, while bitterness increased (Table 1). ICGV-91114 retained the highest scores across all positive attributes at day 28. TAG-24 showed the steepest quality decline, with crunchiness falling from 8.4 to 3.2 (a 61.9% loss). Bitterness in TAG-24 reached 6.8 by day 28, exceeding the acceptability threshold of 5.0. Chemical indicators of oxidative deterioration rose progressively over storage (Table 2). Hexanal concentration, a marker of lipid oxidation, showed the strongest negative correlation with overall sensory score (r = -0.93), followed by peroxide value (r = -0.91). These correlations suggest that hexanal could serve as an objective proxy for sensory quality in routine quality control. The line chart (Figure 1) shows that crunchiness and aroma deteriorated most rapidly, crossing the acceptability midpoint (5.0) around day 18-20. Bitterness crossed the same threshold from the opposite direction around day 16, making it the earliest warning signal of quality loss. The donut chart (Figure 2) reveals that texture (28.3%) and flavor (24.7%) together account for over half of consumer preference weighting, followed by aroma (21.4%).
| Parameter | Day 0 | Day 14 | Day 28 | Correlation with Overall Sensory |
|---|---|---|---|---|
| Peroxide Value (meq/kg) | 1.4 | 4.8 | 12.6 | -0.91** |
| Free Fatty Acids (%) | 0.31 | 0.67 | 1.24 | -0.88** |
| Moisture (%) | 6.3 | 7.1 | 8.4 | -0.76** |
| Hexanal (ppm) | 0.8 | 3.4 | 9.7 | -0.93** |
Table text extracted from the original PDF; superscript letters are shown inline. The original table image is below.
View original table image
| Attribute | ICGV Day 0 | ICGV Day 28 | TG-37A Day 0 | TG-37A Day 28 | TAG-24 Day 0 | TAG-24 Day 28 | LSD (0.05) |
|---|---|---|---|---|---|---|---|
| Crunchiness | 8.9 | 5.1 | 8.6 | 4.4 | 8.4 | 3.2 | 0.47 |
| Aroma | 9.1 | 5.6 | 8.7 | 4.9 | 8.4 | 3.8 | 0.52 |
| Sweetness | 7.6 | 5.4 | 7.2 | 4.7 | 7.1 | 4.3 | 0.38 |
| Bitterness | 1.8 | 5.4 | 2.1 | 6.1 | 2.4 | 6.8 | 0.41 |
| Roasted Flavor | 8.8 | 5.3 | 8.4 | 4.6 | 8.1 | 3.7 | 0.44 |
Table text extracted from the original PDF; superscript letters are shown inline. The original table image is below.
View original table image
Results
Appearance, despite being the first attribute consumers encounter, ranked only fourth at 14.8%.
Discussion
The sensory deterioration pattern documented in this research follows the classical lipid oxidation cascade described for high-oil foods, where texture loss from moisture migration precedes flavor deterioration from volatile aldehyde accumulation [5] . Our finding that crunchiness declines fastest is consistent with the primary mechanism being moisture uptake through packaging, which softens cell walls before oxidative changes in lipids become sensorially detectable [13] . The practical implication is that moisture barrier packaging should be the first line of defense for maintaining groundnut sensory quality. ICGV-91114's superior sensory retention through 28 days likely relates to its larger kernel size and thicker testa, which provide both a physical barrier to moisture ingress and a larger interior-to-surface ratio that slows oxidative front progression [14] . TAG-24, with its smaller kernels and thinner seed coat, offers more surface area per gram of product for both moisture absorption and oxygen contact, explaining its faster quality decline. The consumer preference data provide actionable direction for the groundnut value chain. Texture's dominant weighting (28.3%) means that investments in moisture-proof packaging and humidity-controlled storage would deliver the most consumer-perceived quality improvement per unit of cost. The relatively low weight given to appearance (14.8%) suggests that cosmetic grading standards, which currently drive farmer payments at many procurement points, may overweight an attribute that consumers care about less than texture and flavor. Adjusting grading criteria to include crunchiness or peroxide value measurements alongside visual inspection could better align quality payments with actual consumer preferences.
Conclusion
This research provided quantitative sensory profiles for three groundnut varieties under Bhutan Valley conditions and linked sensory deterioration to measurable chemical indicators. Crunchiness and roasted aroma were the fastestdeclining positive attributes, while bitterness increased as an early indicator of quality loss. ICGV-91114 maintained the best overall sensory quality through 28 days of storage. Consumer preference testing established texture and flavor as the top two purchase-decision drivers, together accounting for 53% of preference weighting. Hexanal concentration showed the strongest correlation with overall sensory quality and could serve as an objective quality control marker. Groundnut processors and marketers in similar Himalayan valley environments should prioritize moisture barrier packaging to protect texture and consider shifting grading criteria toward sensory-relevant parameters. Future work should extend these profiles to additional varieties and explore whether roasting protocol modifications can compensate for early-stage quality decline in stored kernels.
References
18 in the original paper- Savage GP, Keenan JI. The composition and nutritive value of groundnut kernels. Smart Journal of Biology and Agriculture. 1994;4:1-26.
- FAOSTAT. Groundnut production statistics. Food and Agriculture Organization. 2023;Rome.
- Lawless HT, Heymann H. Sensory evaluation of food: principles and practices. Springer Science. 2010;2nd Edition:1-596.
- Johnsen PB, Civille GV, Vercellotti JR. Development of a lexicon for peanut flavor description. Journal of Sensory Studies. 1988;3(1):9-17.
- St. Angelo AJ. Lipid oxidation in foods. Critical Reviews in Food Science and Nutrition. 1996;36(3):175-224.
- Dorji T, Gyamtsho P. Agriculture in Bhutan's valleys: challenges and opportunities. Journal of Bhutan Studies. 2019;41:34-52.
- Isleib TG, Pattee HE, Sanders TH. Sensory quality of peanut genotypes in the US. Peanut Science. 2006;33(1):31-37.
- Pattee HE, Isleib TG, Giesbrecht FG. Roasted peanut flavor quality: variation among US genotypes. Peanut Science. 2000;27(2):85-90.
- Williams EJ, Drexler JS. A non-destructive method for determining peanut pod maturity. Peanut Science. 1981;8(2):134-141.
- Sanders TH, Vercellotti JR, Crippen KL. Effect of maturity on roast color and descriptive flavor of peanuts. Journal of Food Science. 1989;54(2):475-477.
- Moskowitz HR. Product testing and sensory evaluation of foods. Food and Nutrition Press. 1983;Westport, CT:1-605.
- Addinsoft. XLSTAT statistical and data analysis solution. Addinsoft Inc. 2022;New York.
- Young CT, Hovis AR. A method for the rapid analysis of headspace volatiles of raw and roasted peanuts. Journal of Food Science. 1990;55(2):413-415.
- Nautiyal PC. Groundnut: post-harvest operations. FAO AGSI/FAO Technical Report. 2002;Rome:1-48.
- Reed KA, Sims CA, Gorbet DW. Normal oleic peanut differences in flavor quality and stability. Food Chemistry. 2002;78(4):461-467.
- Grosso NR, Resurreccion AVA. Predicting consumer acceptance ratings of groundnut products using descriptive analysis. Journal of Food Science. 2002;67(9):3421-3426.
- Warner KJH, Dimick PS, Ziegler GR. Flavour-fade and off-flavours in ground roasted peanuts. Journal of Food Science. 1996;61(2):469-472.
- Sanders TH, McMichael RW, Hendrix KW. Occurrence of resveratrol in edible peanuts. Journal of Agricultural and Food Chemistry. 2000;48(4):12431246.