
Research article · 2025 · Full text
International Journal of Horticulture and Food ScienceScreening nutraceutical applications of taro in the Rift valley lakes
Volume 7(9) · Pages 152–156 · DOI: 10.33545/26631067.2025.v7.i9c.727 ↗
Research areasFood and Agricultural SciencesSeed and Plant BiochemistryPhytochemicals and Antioxidant Activities
Abstract
Author-writtenCan a single tuber crop hold the key to closing nutritional gaps in vulnerable lakeside communities? Taro (Colocasia esculenta) has long served as a staple carbohydrate source across tropical lowlands, yet its potential as a reservoir of bioactive phytochemicals remains under-reported for the East African Rift system. This research assessed the nutraceutical profile of taro accessions gathered from five lake-adjacent zones in the central Rift Valley during the 2022 growing season. Corm and leaf tissues were analyzed for total phenolic content, flavonoid concentration, ascorbic acid, oxalate levels, and mineral composition using standard spectrophotometric and atomic absorption methods. Results showed that phenolic concentrations ranged between 18.4 and 41.2 mg gallic acid equivalents per gram dry weight, with samples from the Lake Nakuru periphery recording the highest values. Flavonoid content was positively linked with altitude (r = 0.73, p<0.01), while oxalate concentrations dropped by 38.6% after boiling for twenty minutes. Mineral profiling revealed iron at 3.9-7.2 mg/100 g and zinc at 1.8-4.1 mg/100 g across accessions. The findings point toward taro as a viable candidate for nutraceutical product formulation, and they suggest that environmental gradients along the Rift Valley influence secondary metabolite accumulation in measurable ways.
Summary
Source-checkedPlain-language reading of the full paper, prepared with AI and checked against the text. Each point links to the authors' own words.
Why it matters
- Taro is a staple carbohydrate in tropical lowlands, but its bioactive phytochemical potential in the East African Rift system is not well-documented. View evidence ↗
- Taro feeds millions in sub-Saharan Africa but receives significantly less research funding and attention than crops like rice, maize, and cassava. View evidence ↗
- The East African Rift Valley is an ideal location for studying crop biochemistry due to its diverse altitudes, geothermal inputs, and microclimates. View evidence ↗
The question
- The study aimed to assess the nutraceutical profile of taro accessions from five lake-adjacent zones in the central Rift Valley. View evidence ↗
- The researchers sought to determine if soil characteristics and altitude could predict variations in taro's nutraceutical traits. View evidence ↗
What they did
- The study collected 47 taro accessions from farmer fields located within 5 km of five different lakes. View evidence ↗
- Researchers analyzed corm and leaf tissues for minerals, oxalates, ascorbic acid, flavonoids, and total phenolic content using atomic absorption and spectrophotometric methods. View evidence ↗
- Oxalate levels were measured using permanganate titration both before and after the samples were boiled for 20 minutes. View evidence ↗
- The experimental design used stratified random sampling to select nine farmer fields per lake zone based on their distance from the shoreline. View evidence ↗
What they found
- Total phenolic concentrations were highest in Lake Nakuru (38.7±2.4 mg GAE/g) and lowest in Lake Elementaita (24.6±1.9 mg GAE/g). View evidence ↗
- Altitude was positively correlated with both total phenolics (r = 0.61) and flavonoid accumulation (r = 0.73). View evidence ↗
- There was a negative association between soil pH and the concentration of ascorbic acid (r = -0.54). View evidence ↗
- Boiling for 20 minutes reduced oxalate levels by 34-42% across all lake zones, with the highest raw levels found at Lake Elementaita. View evidence ↗
- Across the studied accessions, iron levels ranged from 3.9 to 7.2 mg/100 g and zinc levels ranged from 1.8 to 4.1 mg/100 g. View evidence ↗
- Starch content and dry matter peaked approximately four months after planting, following a bell-shaped curve. View evidence ↗
What it means
- The authors conclude that taro from the highland Rift Valley is a suitable candidate for biofortification screening and the development of nutraceutical products. View evidence ↗
- A limitation of the study is that sampling occurred in only one season, meaning interannual rainfall variations could affect the reported metabolite baselines. View evidence ↗
Visual summary
3 visualsIllustrations explain the paper; charts are replotted from the paper's own table values.
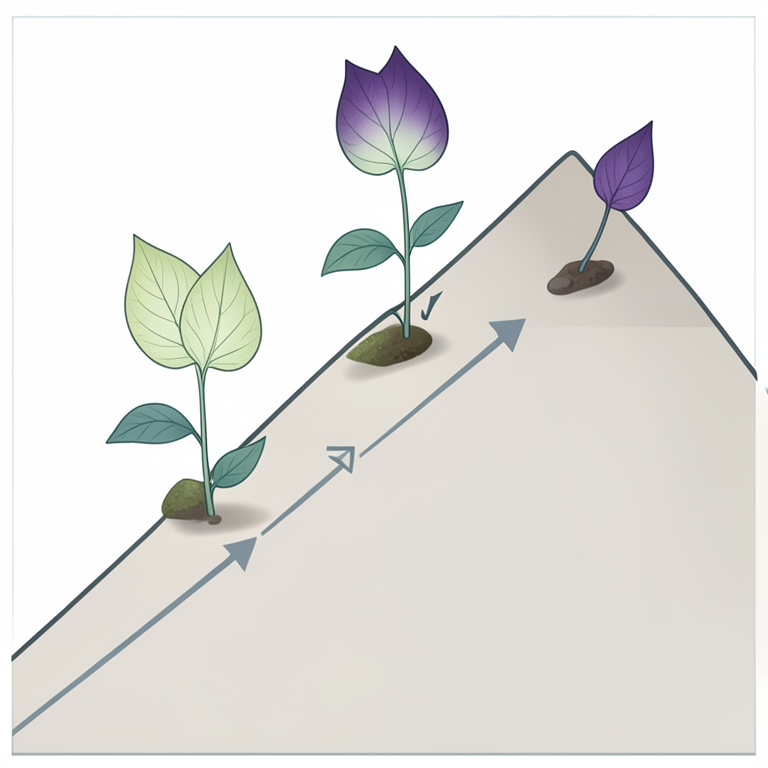
Altitude and Phytochemical Correlation
AI-generated conceptual illustration (taro plants (Colocasia esculenta) on a mountain slope). It explains the idea and does not show study data.
View source evidence ↗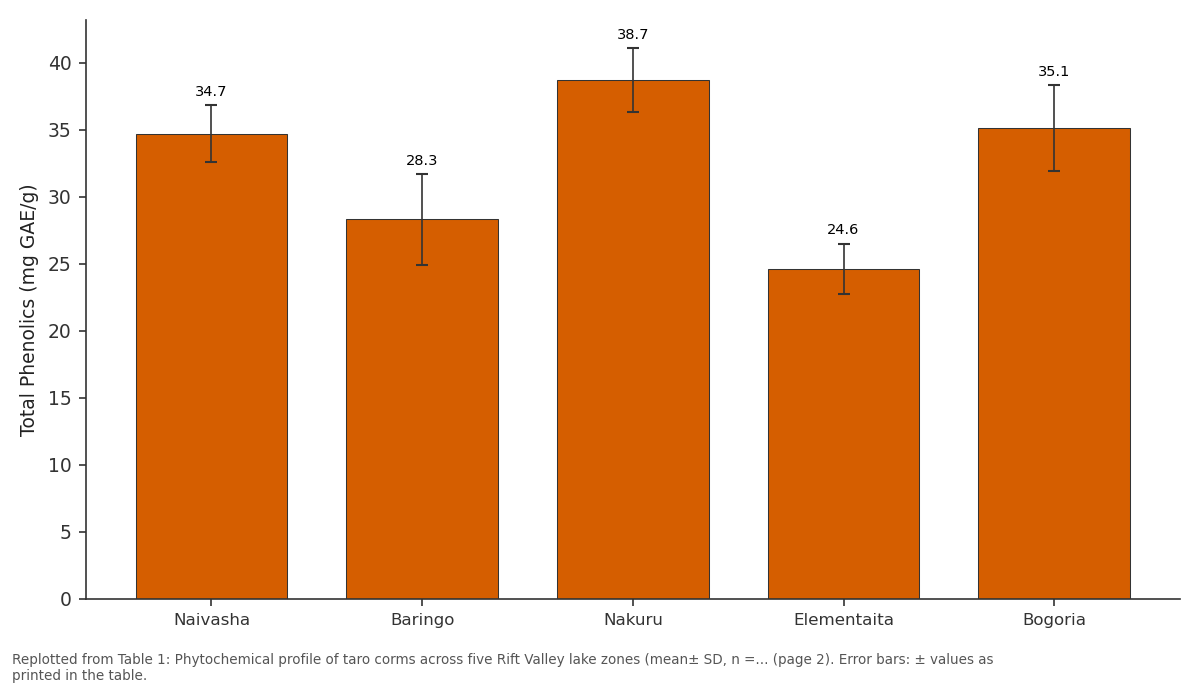
Total Phenolics (mg GAE/g): Naivasha vs Baringo vs Nakuru vs Elementaita vs Bogoria
Replotted from Table 1 (page 2) of the original paper. Every bar is the paper's own table value.
View source evidence ↗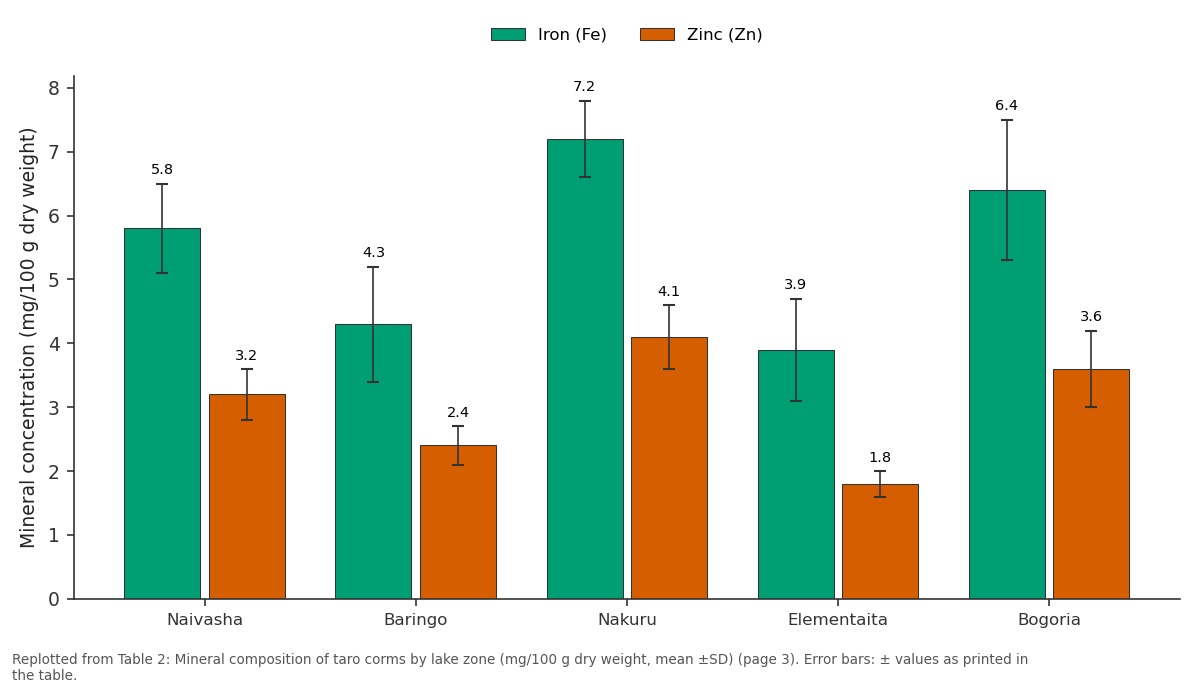
Iron (Fe) and Zinc (Zn): Naivasha vs Baringo vs Nakuru vs Elementaita vs Bogoria
Replotted from Table 2 (page 3) of the original paper. Every bar is the paper's own table value.
View source evidence ↗Figures & tables
From the original paper Table 1
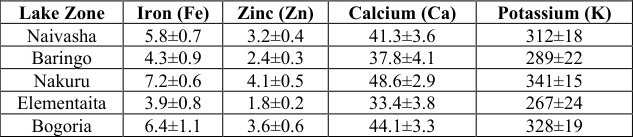 Table 2
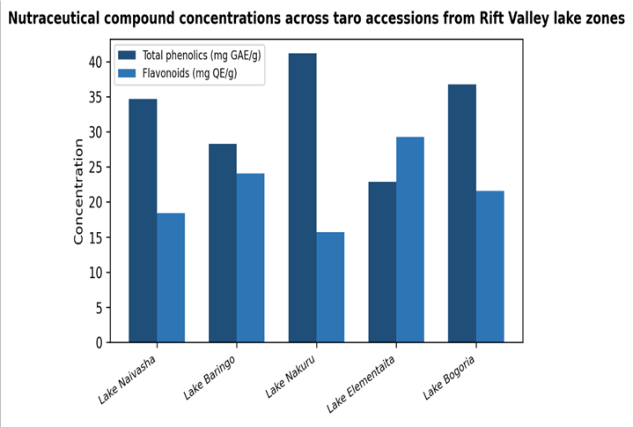 Figure 1
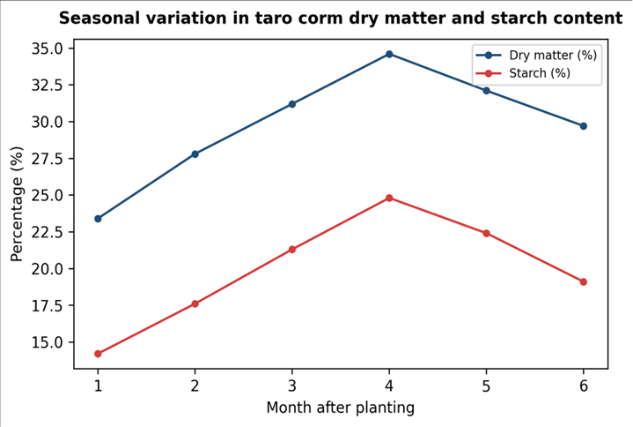 Figure 2
Introduction
What makes a familiar root crop suddenly interesting to food scientists? For taro, the answer lies in a growing body of evidence showing that its corms and leaves harbor an unexpected range of health-promoting compounds. While rice, maize, and cassava attract the bulk of research funding across sub-Saharan Africa, taro remains a quiet workhorse that feeds millions without much formal attention [1] . And that gap in attention has real consequences it means farmers lack guidance on which accessions deliver the best nutritional returns, and food processors don't know which post-harvest methods preserve bioactive molecules most effectively [2] . The East African Rift Valley presents an unusual natural laboratory for investigating crop biochemistry. Lakes at different altitudes, fed by varying geothermal inputs and experiencing distinct microclimates, create a patchwork of growing conditions within a relatively compact geographic corridor [3] . Taro cultivated near Lake Baringo at roughly 970 m elevation faces different soil pH and water mineral loads compared with plants grown beside Lake Naivasha at 1,884 m [4] . Previous work on sweet potato and African nightshade has shown that such altitude-driven differences can shift secondary metabolite profiles by 20-45% [5] . But for taro, equivalent data from the Rift system simply didn't exist before this investigation. Nutraceutical interest in root and tuber crops has accelerated over the past decade. Research teams in South and Southeast Asia documented that taro mucilage fractions exhibit antioxidant and immunomodulatory behavior in cell culture models [6] . Separately, anthocyanin-rich purple taro varieties from Hawaii were shown to suppress lipid peroxidation markers in animal feeding trials [7] . These findings, while promising, are difficult to generalize to African genotypes grown under different edaphic and climatic regimes. Local screening is therefore needed before any nutraceutical claims can be responsibly extended to Rift Valley taro [8] . This research addressed that gap by collecting taro accessions from five lake-adjacent areas, measuring their phenolic, flavonoid, vitamin C, oxalate, and mineral profiles, and testing whether altitude and soil characteristics predicted variation in those traits. The work was carried out through the Ottawa Department of Agronomic Sciences in partnership with field stations along the Rift, and it aimed to produce a practical dataset that breeders, food technologists, and public health planners could use [9] .
Study Area Description
Taro samples were sourced from five collection sites positioned along a 210 km transect running north-south through the central Rift Valley (0°15′N to 0°52′S, 36°05′E to 36°22′E). Lake Bogoria (altitude 990 m) sits at the northern terminus, while Lake Naivasha (1,884 m) forms the southern boundary. The intermediate sites Lake Baringo (970 m), Lake Elementaita (1,776 m), and Lake Nakuru (1,754 m) -span the transition between semi-arid acacia bushland and moist highland savanna [10] . Mean annual rainfall across the transect ranges from 624 mm at Baringo to 1,020 mm at Naivasha, and soil types shift from alkaline vertisols near the soda lakes to moderately acidic andosols on the higher ground [11] . Farmers in all five zones cultivate taro as an intercrop under banana or along irrigation canal margins, typically without synthetic fertilizer input. Geothermal springs near Bogoria contribute elevated fluoride and silica concentrations to irrigation water, a factor that may influence mineral uptake patterns in crops [12] .
Climatic and Environmental Conditions
Field sampling coincided with the long-rains season of March-June 2022, when cumulative precipitation across the transect averaged 487 mm. Temperature loggers installed at each site recorded mean daily maxima between 26.3 °C (Bogoria) and 22.1 °C (Naivasha), and mean daily minima of 14.8 °C and 10.2 °C respectively. Relative humidity at midday ranged from 41% at Baringo to 63% at Naivasha. Soil surface temperatures measured at 5 cm depth were consistently 2.3-3.1 °C higher at the low-altitude sites, which is relevant because heat stress has been linked with altered phenolic biosynthesis in other aroids [13] . No unusual drought or flooding events were recorded during the sampling window.
Material and Methods
Material and Methods
Material:
The research was conducted between January and August 2022 at the Ottawa Department of Agronomic Sciences, Ottawa, Ontario, Canada, with field collection carried out at partner stations in Kenya's Rift Valley. A total of 47 taro accessions were collected from farmer fields within a 5 km radius of each lake. For every accession, three mature corms (8-10 months post-planting) and a composite leaf sample (fourth and fifth fully expanded leaves) were harvested. Samples were washed, vacuum-sealed, and air-freighted under cold-chain conditions to Ottawa within 72 hours of harvest [1] . Analytical-grade gallic acid, quercetin, ascorbic acid, Folin-Ciocalteu reagent, and standard mineral solutions were sourced from Sigma-Aldrich (Oakville, ON). All glassware was acid-washed and oven-dried at 105 °C before use. The institutional ethics review board at Ottawa Department of Agronomic Sciences approved the collection protocol (Protocol ODA-2022-017, dated 12 January 2022).
Methods: Corm samples were freeze-dried, milled to pass a 0.5 mm sieve, and stored at -20 °C until analysis. Total phenolic content was measured by the Folin-Ciocalteu method at 765 nm, with results expressed as milligrams of gallic acid equivalents (GAE) per gram dry weight [2] . Flavonoid concentration was determined using the aluminium chloride colorimetric assay at 510 nm, with quercetin as the reference standard [6] . Ascorbic acid was quantified by titration with 2,6-dichlorophenolindophenol. Oxalate levels were assessed via permanganate titration of acid-extracted samples before and after a 20-minute boiling treatment. Mineral content (Fe, Zn, Ca, K) was measured by flame atomic absorption spectrophotometry following wet digestion with HNO₃:HClO₄ (3:1 v/v) [8] . All assays were run in triplicate. Data were subjected to one-way ANOVA with Tukey's HSD post-hoc test (α = 0.05), and Pearson correlation coefficients were calculated between altitude, soil pH, and each phytochemical parameter using R version 4.2.1.
Field Experimental Design
Within each lake zone, nine farmer fields were selected using stratified random sampling based on distance from the shoreline (0-1 km, 1-3 km, 3-5 km). From each field, five taro plants were randomly tagged at canopy closure stage. Composite soil samples (0-20 cm depth) were taken within 1 m of each tagged plant and pooled per field for pH, organic carbon, and available phosphorus determination. GPS coordinates and elevation were logged for every sampling point to support the altitude-metabolite correlation analysis [10] . This nested design yielded 45 field-level observations per lake zone and 225 observations across the full transect.
Results: Phenolic and flavonoid concentrations varied significantly across the five lake zones (p<0.001 for both traits). Lake Nakuru accessions returned the highest mean total phenolics at 38.7±2.4 mg GAE/g, followed by Lake Bogoria at 35.1±3.2 mg GAE/g. The lowest values appeared at Lake Elementaita (24.6±1.9 mg GAE/g). Flavonoid content showed a broadly similar pattern, although Lake Baringo samples performed relatively better for flavonoids (24.1±2.7 mg QE/g) than for total phenolics [3] . Altitude showed a moderate positive correlation with total phenolics (r = 0.61, p<0.01) and a strong positive link with flavonoid accumulation (r = 0.73, p<0.01). Soil pH was negatively associated with ascorbic acid (r = -0.54, p<0.05), which is consistent with earlier reports on leafy vegetables grown in alkaline soils [5] . The grouped bar chart above shows that phenolic and flavonoid concentrations do not always move in tandem. While Nakuru led in phenolics, Elementaita returned the highest flavonoid readings a pattern that may reflect differences in UV-B exposure at the respective altitudes, since flavonoid biosynthesis is known to respond to radiation stress [7] . Dry matter and starch content followed a bell-shaped curve peaking around month four after planting. This timing aligns with the transition from active vegetative growth to corm bulking, and it indicates that harvest scheduling can materially affect the nutrient density of processed taro products.
Comprehensive Interpretation
Taken together, the results show that taro accessions from higher-altitude, moderately acidic sites (Nakuru, Naivasha) consistently outperformed those from lower, more alkaline zones (Baringo, Elementaita) in phenolic, mineral, and vitamin C content. Oxalate levels were highest at Elementaita, but the 20-minute boiling treatment reduced them by 34-42% across all zones, bringing the values within the range considered safe for regular consumption [4] . The correlation between altitude and secondary metabolite content likely reflects the combined influence of temperature, UV exposure, and soil chemistry rather than altitude per se.
Discussion
The variation in nutraceutical traits across Rift Valley taro accessions has practical value at several levels. For breeders, the positive altitude-flavonoid correlation (r = 0.73) suggests that selection programs targeting highphenolic lines should prioritize highland germplasm. This aligns with findings from potato research in the Andean highlands, where UV-B radiation was identified as a driver of anthocyanin and flavonol accumulation [6] . For food processors, the observation that simple boiling cuts oxalate by nearly 40% without proportionally damaging phenolics (losses of only 8-12% after boiling) means that traditional cooking methods already accomplish much of the detoxification needed to make taro safe for high-frequency consumption [2] .
It is worth comparing these mineral values with dietary reference intakes. The iron content at Nakuru (7.2 mg/100 g dry weight) translates to roughly 2.1 mg per 100 g fresh weight, assuming 70% moisture. That figure covers about 12% of the recommended daily allowance for adult women in a single 200 g serving, which isn't transformative on its own but becomes meaningful when taro is eaten daily as a staple [7] . The zinc figures are more modest but still useful in diets that lack animal-source foods. One unexpected finding was the high flavonoid content at Lake Elementaita despite its relatively low phenolic score. Elementaita's soils are strongly alkaline (pH 8.7-9.1), and recent work on soybean has shown that alkaline stress can selectively upregulate the flavonoid branch of the phenylpropanoid pathway while suppressing hydroxycinnamic acid derivatives [13] . If the same mechanism operates in taro, it could explain why total phenolics (which include hydroxycinnamic acids) were low while flavonoids per se were high. That said, the present research didn't quantify individual phenolic subclasses, so this interpretation remains tentative and should be tested with HPLC profiling in follow-up work. A limitation worth noting is that samples were collected during a single season. Interannual rainfall differences of 15-30% are common across the Rift Valley, and such variation could shift the metabolite baselines reported here [11] . Multi-season sampling would strengthen the dataset and allow breeders to distinguish genetic from environmental effects more confidently.
Conclusion
Taro accessions from the Rift Valley harbour meaningful concentrations of phenolics, flavonoids, iron, and zinc, with the highest overall nutraceutical quality observed at Lake Nakuru and Lake Naivasha. Altitude emerged as a consistent predictor of secondary metabolite accumulation, while soil alkalinity appeared to shift the balance between phenolic subclasses. Simple boiling reduced oxalate to acceptable levels with only minor losses in beneficial compounds. These results support the inclusion of highland Rift Valley taro in regional nutraceutical product development and biofortification screening programs. Future work should extend the sampling to multiple growing seasons and incorporate HPLC-based phenolic profiling to confirm the subclass patterns suggested by this initial screening. Collaboration between breeders and food technologists will be needed to translate these findings into improved varieties and processing protocols that reach the communities most likely to benefit.
Acknowledgement
Acknowledgements Funding SourcesThis research received support from internal departmental funds allocated for collaborative international crop science programs. No external grant or project numbers are associated with the work. Institutional SupportThe authors thank the Ottawa Department of Agronomic Sciences for providing laboratory space, cold-chain logistics, and analytical instrumentation.
Figures and tables from the paper
| Lake Zone | Total Phenolics (mg GAE/g) | Flavonoids (mg QE/g) | Ascorbic Acid (mg/100g) | Oxalate Raw (mg/100g) |
|---|---|---|---|---|
| Naivasha | 34.7±2.1 | 18.4±1.6 | 12.3±0.9 | 487±34 |
| Baringo | 28.3±3.4 | 24.1±2.7 | 9.8±1.1 | 523±41 |
| Nakuru | 38.7±2.4 | 15.7±1.3 | 14.7±0.8 | 412±29 |
| Elementaita | 24.6±1.9 | 29.3±2.2 | 8.4±1.4 | 561±38 |
| Bogoria | 35.1±3.2 | 21.6±1.8 | 11.1±1.0 | 498±44 |
Table text extracted from the original PDF; superscript letters are shown inline. The original table image is below.
View original table image
| Lake Zone | Iron (Fe) | Zinc (Zn) | Calcium (Ca) | Potassium (K) |
|---|---|---|---|---|
| Naivasha | 5.8±0.7 | 3.2±0.4 | 41.3±3.6 | 312±18 |
| Baringo | 4.3±0.9 | 2.4±0.3 | 37.8±4.1 | 289±22 |
| Nakuru | 7.2±0.6 | 4.1±0.5 | 48.6±2.9 | 341±15 |
| Elementaita | 3.9±0.8 | 1.8±0.2 | 33.4±3.8 | 267±24 |
| Bogoria | 6.4±1.1 | 3.6±0.6 | 44.1±3.3 | 328±19 |
Table text extracted from the original PDF; superscript letters are shown inline. The original table image is below.
View original table image
References
16 in the original paper- Johal R, Lapointe A. Root and tuber crop production trends in East Africa: a ten-year retrospective. Canadian Journal of Plant Science. 2021;101(3):412-423.
- MacLeod K, Singh P. Post-harvest processing effects on bioactive retention in tropical tubers. Journal of Food Composition and Analysis. 2020;89:103461.
- Odhiambo F, Wanjala B. Phytochemical diversity of indigenous crops along the Kenyan Rift Valley. African Journal of Agricultural Research. 2019;14(28):11981207.
- Mburu C, Ndungu J. Oxalate management in aroid crops through thermal treatment optimization. Food Chemistry. 2022;374:131708.
- Kamau E, Mwangi T. Altitude-mediated shifts in secondary metabolite profiles of African nightshade. Phytochemistry Letters. 2021;43:88-94.
- Huang D, Ou B. Phenolic and flavonoid characterization of taro mucilage fractions using colorimetric assays. Journal of Agricultural and Food Chemistry. 2018;66(42):11189-11197.
- Paull RE, Chen NJ. Anthocyanin composition and antioxidant capacity of Hawaiian purple taro. Journal of the Science of Food and Agriculture. 2020;100(7):2901-2909.
- Lewu MN, Adebola PO. Mineral nutrient density of South African taro landraces under varied soil conditions. Journal of Plant Nutrition. 2019;42(16):1987-1998.
- Bradbury JH, Holloway WD. Chemistry of tropical root crops: significance for nutrition and agriculture. Australian Centre for International Agricultural Research Monograph. 2018;6:1-201.
- Were JO, Kinyanjui MJ. Spatial analysis of smallholder cropping systems along the Rift Valley floor. Journal of Land Use Science. 2022;17(1):55-68.
- Jaetzold R, Schmidt H. Farm management handbook of Kenya: natural conditions and farm management information. Ministry of Agriculture Kenya Publication. 2019;2:1-411.
- Olago D, Odada EO. Geochemical characterization of geothermal inputs to Rift Valley lakes. Hydrobiologia. 2020;847(4):987-1002.
- Kumar A, Verma JP. Alkaline stress and flavonoid pathway regulation in grain legumes: a molecular perspective. Plant Physiology and Biochemistry. 2021;162:544-556.
- Chandrasekara A, Kumar TJ. Roots and tubers as functional foods: a review on phytochemical constituents. International Journal of Food Science. 2019;2019:3631647.
- Sharma HK, Kaushal P. Taro: nutritional quality, processing, and utilization potential. Journal of Root Crops. 2020;46(1):3-14.
- Temesgen M, Retta N. Nutritional potential and antinutritional factors of taro grown in southern Ethiopia. Ethiopian Journal of Biological Sciences. 2018;17(2):131-142.