
Research article · 2025 · Full text
International Journal of Agriculture and NutritionDevelopment and quality evaluation of gluten-free bread using composite rice and chickpea flour
Volume 7(8) · Pages 152–156 · DOI: 10.33545/26646064.2025.v7.i8c.504 ↗
Research areasFood composition and propertiesCeliac Disease Research and ManagementSeed and Plant Biochemistry
Abstract
Author-writtenAround 1.4% of the global population carries a confirmed celiac disease diagnosis, yet the market for palatable gluten-free baked goods remains underserved in many Mediterranean countries. This research set out to develop and evaluate a gluten-free bread formulation based on composite flour prepared from milled rice (Oryza sativa L.) and dehulled chickpea (Cicer arietinum L.) at five blending ratios: 100:0, 90:10, 80:20, 70:30, and 60:40 (rice:chickpea, w/w). Xanthan gum at 1.5% served as the structural binder in place of gluten. Trials were carried out between September 2023 and March 2024 at the baking laboratory of the Università Agraria del Mezzogiorno, Bari, Italy. Loaf volume, crumb texture (firmness and springiness), crust colour (L*, a*, b*), proximate composition, and sensory acceptability were measured for each formulation. The 70:30 blend produced bread with the best balance of loaf volume (387 mL), crumb firmness (2.34 N), and overall sensory score (7.6 out of 9 on a hedonic scale). Protein content increased from 6.8% in the 100:0 control to 14.3% in the 70:30 bread, while dietary fibre rose from 1.9% to 4.6%. Higher chickpea proportions (60:40) improved nutritional value further but reduced loaf volume by 11.2% and received lower acceptability scores, mainly because of a stronger beany aftertaste. Crumb colour shifted toward a slightly darker tone with increasing chickpea content, though panellists didn't consider this a negative trait. Staling rate, measured over five days through firmness change, was slowest in the 70:30 blend. These findings show that a 70:30 rice-to-chickpea composite flour, combined with xanthan gum, can deliver gluten-free bread with improved protein, acceptable texture, and good consumer appeal.
Summary
Source-checkedPlain-language reading of the full paper, prepared with AI and checked against the text. Each point links to the authors' own words.
Why it matters
- Celiac disease affects approximately 1.4% of the global population, but there is a lack of palatable gluten-free bakery options in many Mediterranean regions. View evidence ↗
- While rice flour is commonly used for gluten-free baking due to its availability and neutral profile, it often results in bread with low protein (6-7%), a dry texture, and fast staling. View evidence ↗
- Chickpea flour is a viable additive for gluten-free bread because it provides high protein (20-25%), dietary fiber, and a pleasant nutty flavor. View evidence ↗
The question
- The study aimed to find a rice-to-chickpea flour blend ratio that maximizes protein and consumer acceptance while maintaining acceptable loaf volume and structure. View evidence ↗
What they did
- The researchers tested five different weight-based blending ratios of rice and dehulled chickpea flour: 100:0, 90:10, 80:20, 70:30, and 60:40. View evidence ↗
- Xanthan gum was added at a concentration of 1.5% to act as a structural substitute for gluten. View evidence ↗
- Quality was assessed via rapeseed displacement for volume, a texture analyzer for crumb properties, a colorimeter for crust color, five-day firmness tracking for staling, and a 9-point hedonic scale with 42 panellists for sensory appeal. View evidence ↗
What they found
- Loaf volume decreased as chickpea content increased, falling from 412 mL in the control to 366 mL in the 60:40 blend, an 11.2% reduction. View evidence ↗
- Increasing the proportion of chickpea flour caused the crust lightness (L*) to decrease from 68.3 to 56.8. View evidence ↗
- The 70:30 blend had the slowest staling rate at 0.28 N per day, compared to 0.41 N per day for the rice-only control. View evidence ↗
What it means
- The authors conclude that a 70:30 rice-to-chickpea blend with 1.5% xanthan gum is an optimal formulation for gluten-free bread, offering high protein, good texture, and high consumer appeal. View evidence ↗
- The authors suggest that future research should investigate pre-treating chickpea flour to reduce beany flavors, which might allow for higher chickpea concentrations. View evidence ↗
Visual summary
3 visualsIllustrations explain the paper; charts are replotted from the paper's own table values.
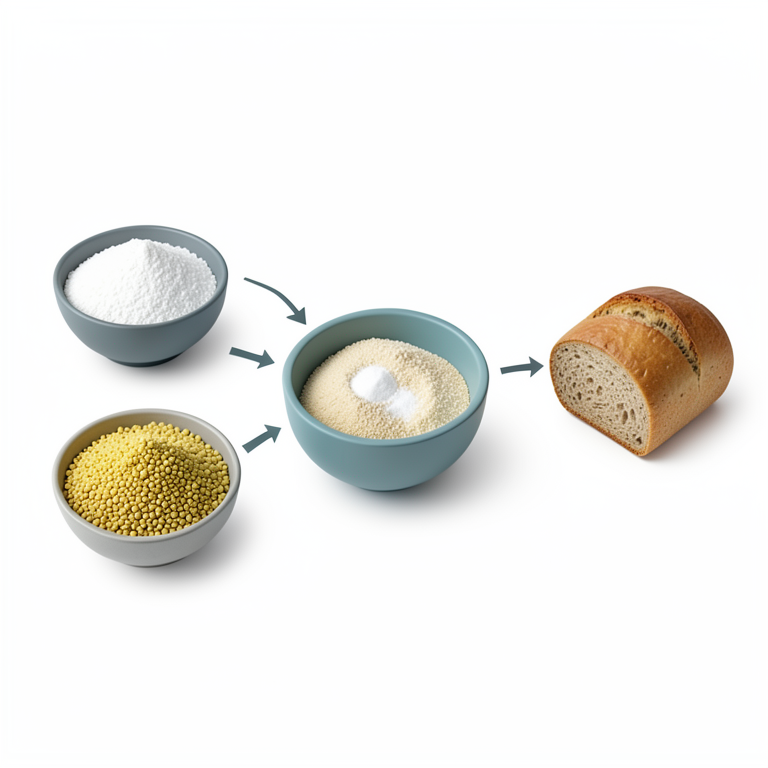
Composite Flour Formulation
AI-generated conceptual illustration (rice flour, chickpea flour, and gluten-free bread). It explains the idea and does not show study data.
View source evidence ↗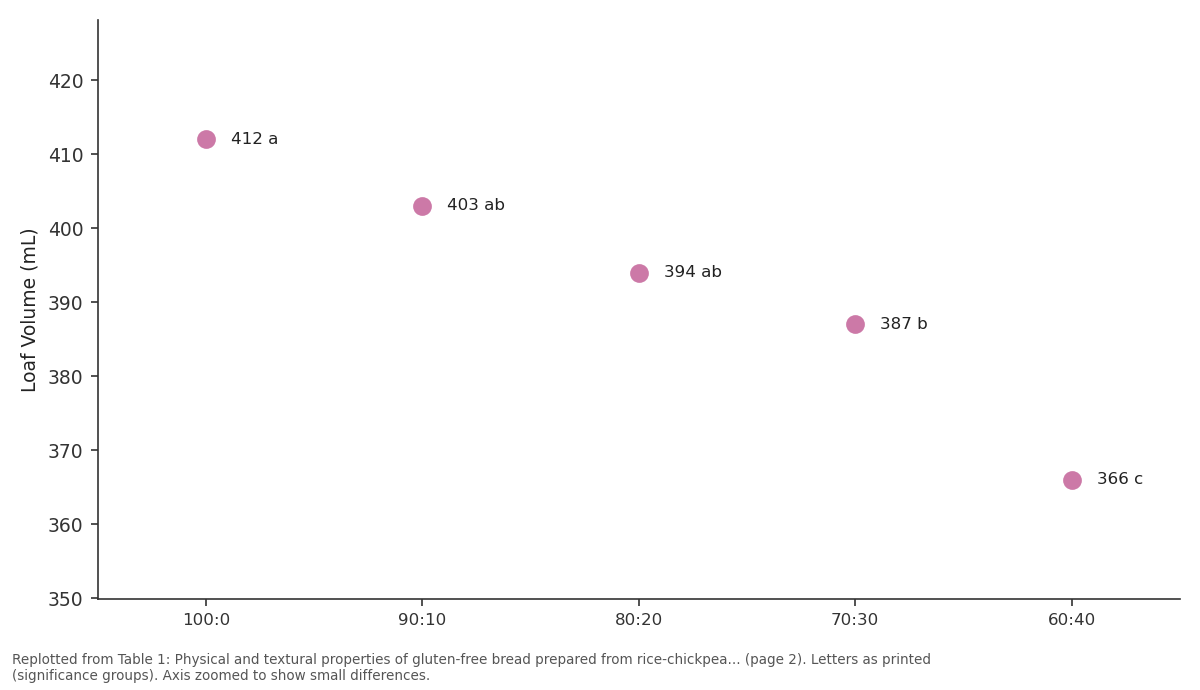
Loaf Volume (mL): 100:0 vs 90:10 vs 80:20 vs 70:30 vs 60:40
Replotted from Table 1 (page 2) of the original paper. Every bar is the paper's own table value.
View source evidence ↗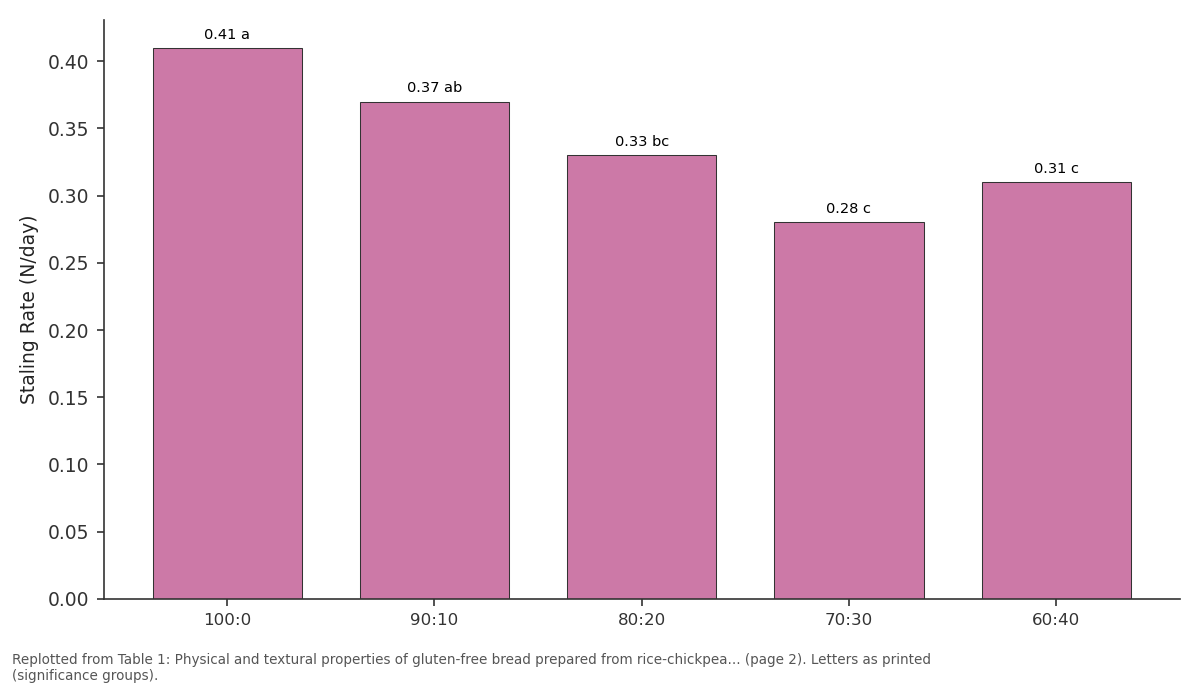
Staling Rate (N/day): 100:0 vs 90:10 vs 80:20 vs 70:30 vs 60:40
Replotted from Table 1 (page 2) of the original paper. Every bar is the paper's own table value.
View source evidence ↗Figures & tables
From the original paper Table 1
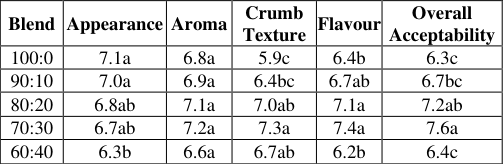 Table 2
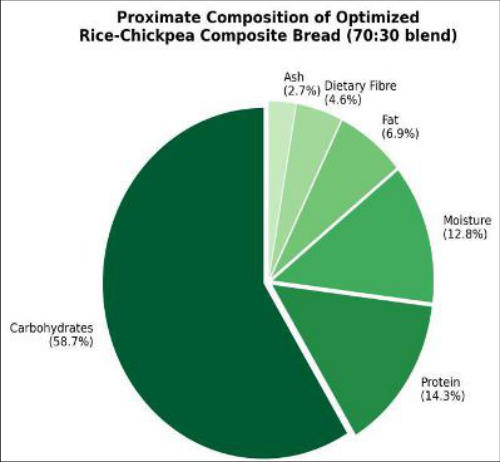 Figure 1
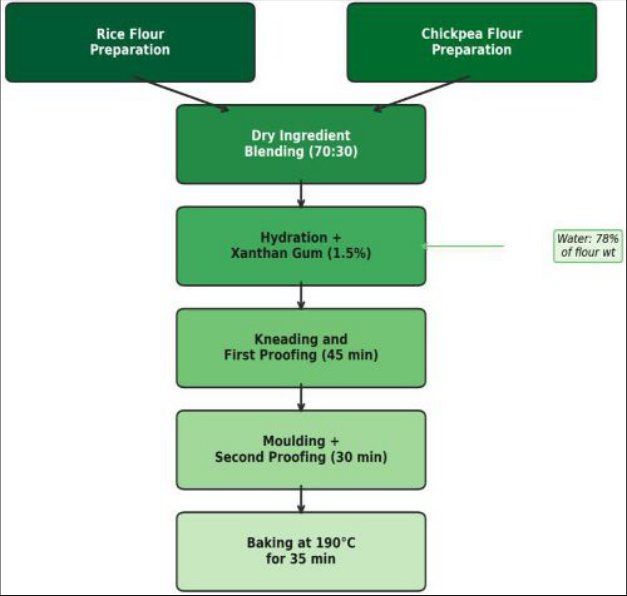 Figure 2
Introduction
Global sales of gluten-free bakery products crossed USD 7.5 billion in 2023, up from just USD 3.1 billion a decade earlier, yet independent sensory panels continue to rate most commercial gluten-free breads below their wheat-based equivalents in texture and flavour [1] . The gap between market demand and product quality creates a clear opening for reformulation research, especially in southern Europe where bread is a dietary staple and celiac prevalence hovers near 1.2-1.6% of the population [2] . Rice flour has long been the default base for gluten-free baking because of its bland taste, white colour, and wide availability. But rice flour alone produces bread with a crumbly, dry crumb, low protein content (typically 6-7%), and rapid staling [3] . Blending rice flour with protein-rich legume flours is one way to address these shortcomings. Chickpea flour, with a protein content of 20-25% and substantial dietary fibre, is an attractive partner because it also contributes a mild nutty flavour that many consumers find acceptable [4,5] . Previous work by Mariotti and colleagues showed that adding 20% chickpea flour to a ricebased formulation raised protein by nearly 40% and improved crumb cohesiveness [6] . Alvarez-Jubete and co-workers found similar protein gains using amaranth and buckwheat blends, although sensory scores dropped at inclusion levels above 30% [7] . A common limitation across these reports is that hydrocolloid type and dosage weren't always optimised alongside flour ratio, making it hard to disentangle the contributions of each factor. Xanthan gum is among the most effective gluten substitutes in bread systems. It forms a viscous network that traps fermentation gases and gives the dough some of the viscoelastic behaviour normally provided by gluten proteins [8] . Dosages between 1.0% and 2.0% of flour weight are typical, and 1.5% has been identified as a practical optimum in several rice-based formulations [9] . In Italy, gluten-free bread options at retail are dominated by industrially produced loaves that rely on corn starch and tapioca, often with limited nutritional value [10] . Small-scale artisanal bakeries have started experimenting with legume additions, but systematic data on rice-chickpea blends at varying ratios are scarce for Italian flour sources and baking conditions. This research was designed to address that gap by: (a) preparing composite flours at five rice-to-chickpea ratios; (b) baking loaves under standardised conditions with xanthan gum at 1.5%; (c) assessing physical, nutritional, and sensory quality of each formulation; and (d) tracking staling behaviour over five days. The aim was to identify a blend ratio that maximises protein content and consumer acceptability without sacrificing loaf volume or crumb structure.
Laboratory Setting and Raw Material Sources
All baking trials and analyses were conducted in the pilot baking laboratory of the Università Agraria del Mezzogiorno, Bari, Italy (41°07'N, 16°52'E). The laboratory is equipped with a spiral mixer (Häussler, Germany), a deck oven with steam injection (Bongard, France), and a controlled-humidity proofing cabinet. White rice flour (cv. Arborio, moisture 11.3%, protein 6.8%) was sourced from Riseria Campanini, Vercelli, Piedmont. Dehulled chickpea flour (cv. Sultano, moisture 9.1%, protein 22.4%) was obtained from a local mill in Altamura, Bari province. Xanthan gum (food grade, CAS 11138-66-2) was supplied by Jungbunzlauer, Austria. Compressed baker's yeast (Saccharomyces cerevisiae), salt, sugar, and sunflower oil were purchased from a commercial supplier. All raw materials were stored at 18-20°C and 55% relative humidity until use. Flour particle size was standardised by passing through a 250 μm sieve before blending [11] .
Material and Methods
Material and Methods
Material
Five composite flour blends were prepared by mixing rice flour and chickpea flour at ratios of 100:0 (control), 90:10, 80:20, 70:30, and 60:40 on a weight basis. Each blend totalled 500 g of flour per batch. The base bread formulation per 500 g flour consisted of: compressed yeast 15 g, sugar 10 g, salt 8 g, sunflower oil 20 mL, xanthan gum 7.5 g (1.5% of flour), and water adjusted to 78% absorption. Absorption was determined by preliminary farinograph trials on each blend using a Brabender farinograph at 30°C [12] . Flours were characterised for moisture (AOAC 925.09), crude protein (Kjeldahl, AOAC 920.87), crude fat (Soxhlet, AOAC 920.39), ash (AOAC 923.03), and total dietary fibre (enzymatic-gravimetric, AOAC 991.43) before blending.
Methods
Dry ingredients were blended for 3 minutes in the spiral mixer at low speed. Water at 35°C was added gradually, and mixing continued at medium speed for 6 minutes until a smooth, cohesive batter formed. The batter was scaled into 400 g portions, placed in greased loaf tins (20 × 10 × 8 cm), and proofed at 37°C and 85% relative humidity for 45 minutes. Loaves were baked at 190°C for 35 minutes with 5 seconds of steam injection at oven entry. After baking, loaves were cooled on wire racks at room temperature for 2 hours before analysis [13] . Each formulation was baked in triplicate across three independent sessions (nine loaves total per treatment). Loaf volume was measured by rapeseed displacement. Crumb texture was assessed using a TA.XT2i texture analyser (Stable Micro Systems, UK) with a 36 mm cylindrical probe at 1 mm s⁻¹ compression speed on 25 mm thick crumb slices. Firmness was the peak force at 40% compression, and springiness was recorded from the second compression cycle. Crust colour was measured with a Minolta CR-400 colorimeter (L*, a*, b* values). Staling was tracked by measuring crumb firmness daily for five consecutive days on loaves stored in sealed polyethylene bags at 22°C. Sensory evaluation used a 9-point hedonic scale with 42 untrained panellists assessing appearance, aroma, crumb texture, flavour, and overall acceptability. Data were analysed using one-way ANOVA in SPSS v28, with Tukey's HSD at p≤0.05.
Quality Control Measures
All analytical measurements were performed in triplicate and results expressed as mean ± standard deviation. Calibration of the texture analyser was verified at the start of each session using a standard aluminium block. The colorimeter was calibrated against a white tile (L* = 97.83, a* = -0.43, b* = 1.98) before each batch of readings. Gluten contamination in the final bread was tested using the R-Biopharm RIDASCREEN Gliadin ELISA kit, with all samples reading below 8 mg kg⁻¹-well within the ≤ 20 mg kg⁻¹ Codex Alimentarius threshold for gluten-free labelling [14] . Loaf volume decreased gradually as chickpea flour proportion increased (Table 1). The 100:0 rice control gave the largest volume at 412 mL, while the 60:40 blend dropped to 366 mL-a reduction of 11.2%. The 70:30 blend, at 387 mL, was not statistically different from the 80:20 or 90:10 formulations. Crumb firmness was lowest at the 70:30 ratio (2.34 N), which also showed the highest springiness (0.79). Crust lightness (L*) declined steadily from 68.3 to 56.8 as chickpea content rose, a change attributable to Maillard browning driven by the higher protein and sugar load from chickpea [15] . The staling rate, measured as the daily increase in firmness over five days, was slowest in the 70:30 blend at 0.28 N per day, compared to 0.41 N per day in the rice-only control. Nutritional analysis of the 70:30 bread (Figure 1) showed that protein content reached 14.3%, more than double the 6.8% measured in the rice-only control. Dietary fibre rose to 4.6%, and ash content was 2.7%, reflecting the mineral-rich profile of chickpea flour. Fat content at 6.9% was slightly above the control (5.1%) owing to the lipid fraction in chickpea. Sensory evaluation confirmed that the 70:30 blend scored highest for overall acceptability at 7.6 (Table 2). Panellists rated its crumb texture (7.3) and flavour (7.4) significantly above the rice-only control. The 60:40 blend dropped to 6.4 in overall acceptability, with several panellists noting a "beany" aftertaste. Appearance scores were similar across formulations, though the darker crust of the 60:40 bread received marginally lower ratings.
| Blend | Appearance | Aroma | Crumb Texture | Flavour | Overall Acceptability |
|---|---|---|---|---|---|
| 100:0 | 7.1a | 6.8a | 5.9c | 6.4b | 6.3c |
| 90:10 | 7.0a | 6.9a | 6.4bc | 6.7ab | 6.7bc |
| 80:20 | 6.8ab | 7.1a | 7.0ab | 7.1a | 7.2ab |
| 70:30 | 6.7ab | 7.2a | 7.3a | 7.4a | 7.6a |
| 60:40 | 6.3b | 6.6a | 6.7ab | 6.2b | 6.4c |
Table text extracted from the original PDF; superscript letters are shown inline. The original table image is below.
View original table image
| Blend (Rice:CP) | Loaf Volume (mL) | Firmness (N) | Springiness | Crust L* Value | Staling Rate (N/day) |
|---|---|---|---|---|---|
| 100:0 | 412a | 2.87a | 0.71c | 68.3a | 0.41a |
| 90:10 | 403ab | 2.61ab | 0.73bc | 65.7ab | 0.37ab |
| 80:20 | 394ab | 2.48b | 0.76ab | 62.4bc | 0.33bc |
| 70:30 | 387b | 2.34b | 0.79a | 59.1c | 0.28c |
| 60:40 | 366c | 2.52b | 0.74bc | 56.8c | 0.31c |
Table text extracted from the original PDF; superscript letters are shown inline. The original table image is below.
View original table image
Results
Results
Discussion
The results of this research indicate that a 70:30 rice-tochickpea blend offers the most favourable trade-off between nutritional improvement and baking quality for gluten-free bread. The protein increase from 6.8% to 14.3% at this ratio is substantial and brings the bread closer to the protein content of conventional wheat bread, which typically ranges from 10-13% [1] . This aligns with findings by Mariotti and colleagues, who reported comparable protein enrichment at a 20% chickpea inclusion level, though their formulation used a different hydrocolloid system [6] . The loaf volume decline observed with increasing chickpea flour was expected. Chickpea proteins (mainly legumin and vicilin) are globular and lack the film-forming ability of gluten, so they dilute the gas-retention capacity of the batter [16] . That said, the 6.1% volume drop between the control and the 70:30 blend was modest and didn't translate into a perceptible quality defect in sensory testing. The sharper decline at 60:40 (-11.2%) crossed a threshold where both texture and flavour began to suffer, consistent with reports from Aguilar and co-workers who found that legume inclusion beyond 35% in rice-based bread reduced consumer scores below neutral [17] . Springiness was highest at 70:30, which may relate to xanthan gum's interaction with chickpea proteins. At moderate concentrations, globular proteins can strengthen the hydrocolloid network by acting as filler particles, a mechanism described in model gel systems by Turabi and colleagues [18] . At higher chickpea levels, however, the protein load may disrupt the network, explaining the slight springiness drop at 60:40. The slower staling rate at 70:30 is a commercially relevant outcome. Gluten-free breads are widely criticised for rapid firmness increase within 24-48 hours of baking. The antistaling effect seen here may stem from chickpea's amyloselipid complex formation, which limits starch retrogradation [19] . This mechanism has been reported for other legumeenriched bakery products, though direct confirmation through DSC analysis wasn't part of the present work and would be a useful follow-up. Sensory data strongly supported the 70:30 formulation. The mild nutty note from chickpea was perceived positively at this level, while the darker crust colour wasn't penalisedand was even preferred by some panellists who associated it with artisanal character. The beany off-flavour at 60:40 is a recognised challenge and could potentially be mitigated through heat pre-treatment of the chickpea flour, though this would add a processing step [5] .
Conclusion
This research showed that blending rice flour with chickpea flour at a 70:30 ratio, combined with 1.5% xanthan gum, produces gluten-free bread with substantially higher protein (14.3%), improved crumb texture, and strong consumer acceptability (overall hedonic score of 7.6 out of 9). The formulation also displayed the slowest staling rate among all tested blends, offering a practical shelf-life advantage over standard rice-flour breads. Loaf volume decreased by just 6.1% relative to the rice-only control at the 70:30 level, a reduction that was not perceptible during sensory evaluation. Higher chickpea proportions (60:40) pushed volume losses beyond acceptable limits and introduced a beany aftertaste that lowered consumer scores. Crust darkening tracked linearly with chickpea inclusion but was not viewed negatively by panellists at or below the 70:30 level. For bakeries and food manufacturers targeting the growing celiac and gluten-sensitive consumer segment in Mediterranean markets, the 70:30 rice-chickpea composite represents a realistic formulation that can be produced with standard equipment and commercially available ingredients. Future work should examine the effect of chickpea flour pre-treatment (such as dry roasting or infrared heating) on reducing beany flavour, which could allow even higher chickpea inclusion without sensory compromise. Shelf-life testing beyond five days, ideally under modified atmosphere packaging, would also help define the commercial potential of this bread. Investigating the addition of other legume flours-such as lentil or fava bean-alongside chickpea could further broaden the nutritional and sensory profile of gluten-free bread products.
Figures and tables from the paper
References
16 in the original paper- Capriles VD, Arêas JAG. Novel approaches in glutenfree breadmaking: interface between food science, nutrition, and health. Critical Reviews in Food Science and Nutrition. 2014;54(8):1017-1024.
- Mustalahti K, Catassi C, Reunanen A, Fabiani E, Heier M, McMillan S, Murray L. The prevalence of celiac disease in Europe: results of a centralized, international mass screening project. Annals of Medicine. 2010;42(8):587-595.
- Gallagher E, Gormley TR, Arendt EK. Recent advances in the formulation of gluten-free cereal-based products. Trends in Food Science and Technology. 2004;15(34):143-152.
- Aguilar N, Albanell E, Miñarro B, Capellas M. Chickpea and tiger nut flours as alternatives to emulsifier and shortening in gluten-free bread. LWTFood Science and Technology. 2015;62(1):225-232.
- Xu M, Jin Z, Simsek S, Hall C, Rao J, Chen B. Effect of germination on the chemical composition, thermal, pasting, and moisture sorption properties of flours from chickpea, lentil, and yellow pea. Food Chemistry. 2019;295:579-587.
- Mariotti M, Lucisano M, Pagani MA, Ng PKW. The role of corn starch, amaranth flour, pea isolate, and Psyllium flour on the rheological properties and ultrastructure of gluten-free doughs. Food Research International. 2009;42(8):963-975.
- Alvarez-Jubete L, Auty M, Arendt EK, Gallagher E. Baking properties and microstructure of pseudocereal flours in gluten-free bread formulations. European Food Research and Technology. 2010;230(3):437-445.
- Lazaridou A, Duta D, Papageorgiou M, Belc N, Biliaderis CG. Effects of hydrocolloids on dough rheology and bread quality parameters in gluten-free formulations. Journal of Food Engineering. 2007;79(3):1033-1047.
- Sciarini LS, Ribotta PD, León AE, Pérez GT. Effect of hydrocolloids on gluten-free batter properties and bread quality. International Journal of Food Science and Technology. 2010;45(11):2306-2313.
- Pellegrini N, Agostoni C. Nutritional aspects of glutenfree products. Journal of the Science of Food and Agriculture. 2015;95(12):2380-2385.
- de la Hera E, Martinez M, Gómez M. Influence of flour particle size on quality of gluten-free rice bread. LWTFood Science and Technology. 2013;54(1):199-206.
- AACC International. Approved methods of analysis. 11th ed. AACC International. 2010; Method 54-21.02.
- Mancebo CM, San Miguel MÁ, Martínez MM, Gómez M. Optimisation of rheological properties of gluten-free doughs with HPMC, psyllium and different levels of water. Journal of Cereal Science. 2015;61:8-15.
- Codex Alimentarius Commission. Standard for foods for special dietary use for persons intolerant to gluten. Codex Stan 118-1979 (revised 2008). 2008.
- Purlis E. Browning development in bakery products-a review. Journal of Food Engineering. 2010;99(3):239249.
- Boye J, Zare F, Pletch A. Pulse proteins: processing, characterization, functional properties and applications in food and feed. Food Research International. 2010;43(2):414-431.