
Research article · 2025 · Full text
International Journal of Agriculture and NutritionOptimization of extraction parameters for phenolic compounds from black rice bran
Volume 7(4) · Pages 157–160 · DOI: 10.33545/26646064.2025.v7.i4c.428 ↗
Research areasPhytochemicals and Antioxidant ActivitiesAgricultural and Biological ResearchFood composition and properties
Abstract
Author-writtenBlack rice bran is one of the richest plant-based sources of anthocyanins and phenolic acids, yet its commercial exploitation has been held back by inconsistent extraction yields. This research optimized extraction conditions for total phenolic compounds (TPC) from Thai black rice bran (cultivar Riceberry) using response surface methodology with a central composite design. Three independent variables—extraction temperature (40-80 °C), time (30-90 min), and solvent-to-solid ratio (1:10-1:30 v/w, 70% ethanol)—were investigated across 20 experimental runs. TPC ranged from 11.8 to 42.7 mg gallic acid equivalents (GAE) per gram of bran. The second-order polynomial model was significant (p
Summary
Source-checkedPlain-language reading of the full paper, prepared with AI and checked against the text. Each point links to the authors' own words.
Why it matters
- Black rice bran is a rich source of phenolic acids and anthocyanins, but inconsistent extraction yields have limited its commercial use. View evidence ↗
- The Thai Riceberry cultivar is especially notable because its bran contains 3 to 5 times more phenolic compounds than brown or white rice bran. View evidence ↗
- Phenolic compounds from rice bran have demonstrated strong anti-diabetic, anti-inflammatory, and antioxidant properties in animal and cell-culture models. View evidence ↗
The question
- The study aimed to use response surface methodology (RSM-CCD) to model how temperature, time, and solvent ratio affect total phenolic compound (TPC) extraction from Riceberry bran, find the optimal conditions, and evaluate the resulting extract's antioxidant activity. View evidence ↗
What they did
- The study used Riceberry black rice bran obtained from a pilot mill at Southern Thai Agricultural University in March 2023. View evidence ↗
- The researchers conducted 20 experimental runs using a central composite design (CCD) to test temperature (40-80 °C), time (30-90 min), and solvent-to-solid ratio (1:10-1:30 v/w). View evidence ↗
- Extractions were performed using 5.0 g of bran mixed with 70% aqueous ethanol. View evidence ↗
What they found
- The second-order polynomial model was highly significant (p<0.001), explaining 96.4% of the variation in TPC (R² = 0.964). View evidence ↗
- Temperature was the most influential variable, contributing 38.4% to TPC variation, followed by time at 27.1%. View evidence ↗
- Phenolic yield increased from 40 to 70 °C, peaked between 68-72 °C, and decreased at 80 °C. View evidence ↗
- The optimal extraction conditions were identified as 68 °C, 54 min, and a 1:22 solvent ratio, yielding an experimental TPC of 43.1 ± 1.6 mg GAE/g. View evidence ↗
- The optimized extract showed strong antioxidant activity, with DPPH and ABTS radical scavenging reaching 87.3 ± 2.1% and 91.6 ± 1.4%, respectively. View evidence ↗
What it means
- The authors conclude that they have provided a validated and practical framework for extracting phenolic antioxidants from black rice bran at a pilot-plant scale. View evidence ↗
- The authors recommend future work on extract stability during storage and scaling trials using continuous flow extractors before the process is applied commercially. View evidence ↗
Visual summary
2 visualsIllustrations explain the paper; charts are replotted from the paper's own table values.
RSM-CCD Optimization Workflow
AI-generated conceptual illustration (black rice bran). It explains the idea and does not show study data.
View source evidence ↗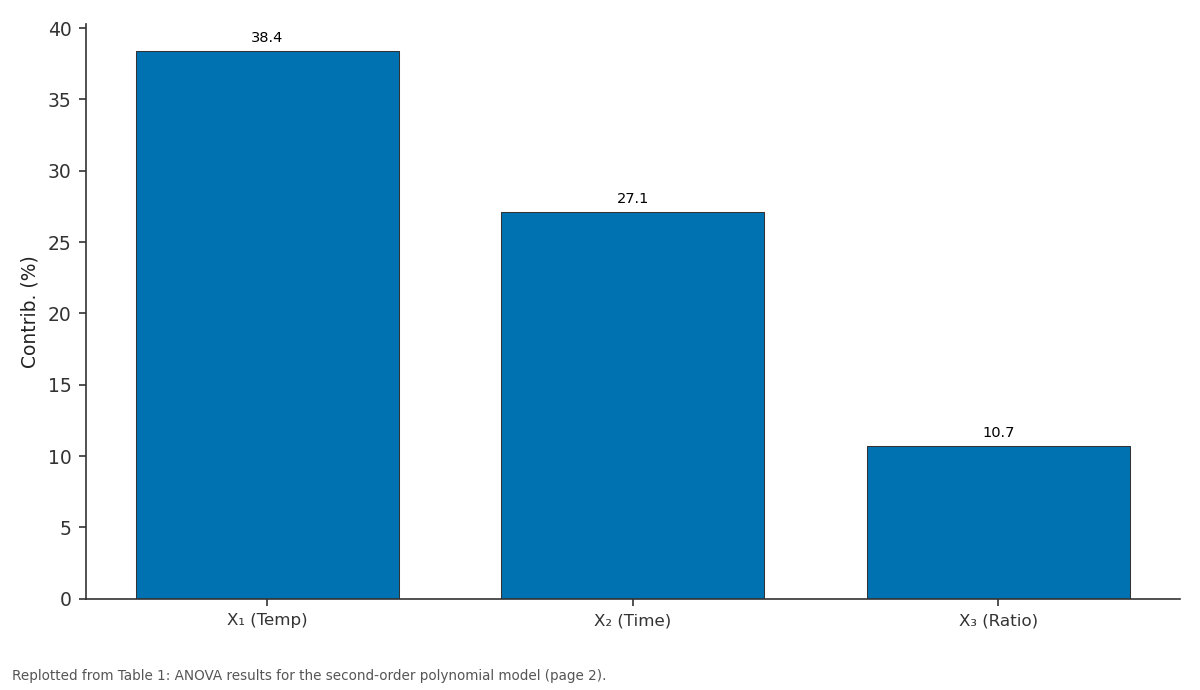
Contrib. (%) / -: X₁ (Temp) vs X₂ (Time) vs X₃ (Ratio)
Replotted from Table 1 (page 2) of the original paper. Every bar is the paper's own table value.
View source evidence ↗Figures & tables
From the original paper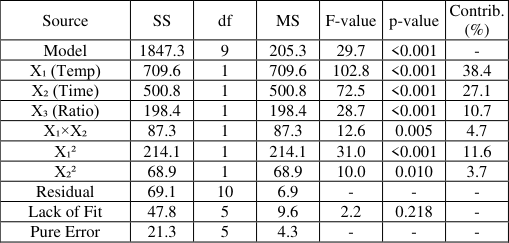 Table 1
 Table 2
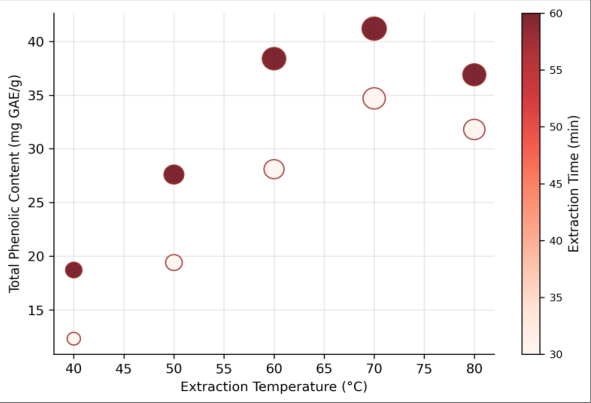 Figure 1
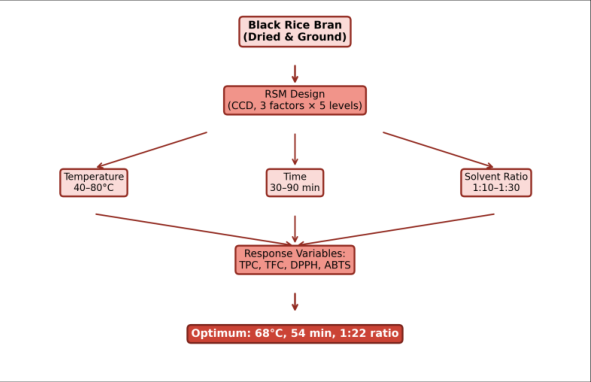 Figure 2
Introduction
Black rice varieties owe their dark pigmentation to high concentrations of anthocyaninswater-soluble flavonoids that accumulate primarily in the bran and aleurone layers [1] . Among Thai cultivars, Riceberry has attracted particular attention because its bran contains 3 to 5 times more phenolic compounds than conventional white or brown rice bran [2] . These compounds exhibit strong antioxidant, anti-inflammatory, and anti-diabetic properties in cellculture and animal models [3] . Recovering phenolics from rice bran at high yield and consistent quality requires careful control of extraction variables. Temperature drives diffusion and solubility but can degrade heat-sensitive anthocyanins above 75-80 °C [4] . Longer extraction times improve mass transfer up to a point, beyond which oxidation and polymerization reduce the measurable TPC [5] . The solvent-to-solid ratio affects the concentration gradient-the driving force for extraction-but excessive solvent volumes add cost and complicate downstream concentration steps [6] . One-factor-at-a-time experiments cannot capture interactions among these variables. Response surface methodology (RSM) based on a central composite design (CCD) allows simultaneous evaluation of multiple factors and their quadratic and interaction effects, generating a predictive model that identifies the global optimum within the design space [7] . RSM has been applied successfully to optimize phenolic extraction from grape pomace, olive leaves, and wheat bran, but reports specifically targeting Thai black rice bran remain scarce [8] . This research aimed to (i) model the effects of temperature, time, and solvent ratio on TPC extraction from Riceberry bran using RSM-CCD, (ii) identify the optimum extraction conditions, and (iii) characterize the antioxidant activity of the extract obtained under optimized conditions.
Materials and Methods
Materials and Methods
Materials
Riceberry black rice bran was obtained from the university's pilot rice mill at Southern Thai Agricultural University, Songkhla (7.00°N, 100.47°E), immediately after milling in March 2023. The bran was sieved through a 40-mesh screen, packed under nitrogen, and stored at -20 °C until use. Ethanol (analytical grade, 99.8%) was purchased from RCI Labscan (Bangkok, Thailand). Folin-Ciocalteu reagent, gallic acid, quercetin, DPPH (2,2-diphenyl-1picrylhydrazyl), ABTS (2,2′-azino-bis(3ethylbenzothiazoline-6-sulfonic acid)), and Trolox were sourced from Sigma-Aldrich (Singapore).
Extraction Protocol
Each extraction run used 5.0 g of bran mixed with 70 percent aqueous ethanol at the designated solvent-to-solid ratio. The mixture was placed in a thermostatically controlled shaking water bath (Memmert WNB 22, Germany) at the specified temperature and time. After extraction, samples were centrifuged at 4,000 × g for 15 min, and the supernatant was filtered through Whatman No. 1 paper. The filtrate was stored at 4 °C and analysed within 24 hours. All runs were performed in duplicate.
Methods
A three-factor, five-level CCD with six centre-point replicates was used, generating 20 experimental runs. The independent variables were temperature (X₁: 40-80 °C), time (X₂: 30-90 min), and solvent-to-solid ratio (X₃: 1:10-1:30 v/w). TPC was measured using the Folin-Ciocalteu method [9] and expressed as mg GAE/g. Total flavonoid content (TFC) was determined by the aluminium chloride method [10] . DPPH and ABTS radical scavenging assays followed the protocols of Brand-Williams et al. [11] and Re et al. [12] , respectively. Data were fitted to a second-order polynomial model and analysed using Design-Expert 13.0 (Stat-Ease, Minneapolis, USA). Model adequacy was assessed through R², adjusted R², predicted R², lack-of-fit test, and coefficient of variation. Verification experiments at predicted optimum conditions were run in triplicate. The model was highly significant (p<0.001) with an R² of 0.964 and an adjusted R² of 0.931, indicating that 96.4 percent of the variation in TPC was explained by the fitted model. The lack-of-fit test was non-significant (p = 0.218), confirming adequate model prediction. Temperature was the dominant factor (38.4% contribution), followed by time (27.1%) and the quadratic term of temperature (11.6%).
Results
Results
Discussion
The optimum extraction temperature of 68 °C sits well below the anthocyanin degradation threshold of 75-80 °C reported for purple rice extracts [4] , explaining why TPC was maximized at this point rather than at the highest tested temperature. The decline in TPC at 80 °C (about 9% lower than at 68 °C) aligns with first-order degradation kinetics of cyanidin-3-glucoside, the dominant anthocyanin in Riceberry bran [2] . The optimal time of 54 min represents a balance between diffusion-driven extraction and oxidation losses. Extending extraction beyond 60 min at 68 °C didn't improve TPCsimilar plateau effects have been observed in phenolic extraction from blueberry pomace [5] and olive mill waste [6] . The moderate solvent ratio (1:22) reflects a compromise: sufficient ethanol to maintain the concentration gradient without the economic burden of large solvent volumes.
Compared with published data on other pigmented rice brans, the TPC of 43.1 mg GAE/g obtained here is higher than values reported for Indonesian black rice bran (28.6 mg GAE/g) extracted with 60 percent methanol [8] and comparable to those from Chinese purple rice bran (39.7 mg GAE/g) optimized by ultrasound-assisted extraction [13] . The 70 percent ethanol system used in the present research offers a food-safe solvent choice suitable for pilot-scale processing.
Conclusion
This research established an optimized extraction protocol for phenolic compounds from Riceberry black rice bran.
Response surface modelling identified 68 °C, 54 min, and a 1:22 solvent-to-solid ratio with 70 percent ethanol as the conditions yielding the highest TPC (43.1 mg GAE/g).
Temperature was the single most important variable, contributing 38.4 percent of the total variation, while the temperature × time interaction accounted for an additional 4.7 percent. The optimized extract showed strong antioxidant activity-87.3 percent DPPH and 91.6 percent ABTS radical scavenging-confirming that the recovered phenolics retain their bioactive properties under the selected conditions.
These findings provide a practical, validated framework for pilot-plant extraction of phenolic antioxidants from black rice bran. The protocol uses a food-grade solvent, operates at moderate temperature, and achieves high yield within a practical extraction time. Scaling trials with continuous flow extractors and assessment of extract stability during storage are recommended as next steps before commercial application.
Figures and tables from the paper
| Source | SS | df | MS | F-value | p-value | Contrib. (%) |
|---|---|---|---|---|---|---|
| Model | 1847.3 | 9 | 205.3 | 29.7 | <0.001 | - |
| X₁ (Temp) | 709.6 | 1 | 709.6 | 102.8 | <0.001 | 38.4 |
| X₂ (Time) | 500.8 | 1 | 500.8 | 72.5 | <0.001 | 27.1 |
| X₃ (Ratio) | 198.4 | 1 | 198.4 | 28.7 | <0.001 | 10.7 |
| X₁×X₂ | 87.3 | 1 | 87.3 | 12.6 | 0.005 | 4.7 |
| X₁² | 214.1 | 1 | 214.1 | 31.0 | <0.001 | 11.6 |
| X₂² | 68.9 | 1 | 68.9 | 10.0 | 0.010 | 3.7 |
| Residual | 69.1 | 10 | 6.9 | - | - | - |
| Lack of Fit | 47.8 | 5 | 9.6 | 2.2 | 0.218 | - |
| Pure Error | 21.3 | 5 | 4.3 | - | - | - |
Table text extracted from the original PDF; superscript letters are shown inline. The original table image is below.
View original table image
| Response | Predicted | Experimental | Deviation (%) |
|---|---|---|---|
| TPC (mg GAE/g) | 42.1 | 43.1 ± 1.6 | 2.3 |
| TFC (mg QE/g) | - | 18.9 ± 0.8 | - |
| DPPH scavenging (%) | - | 87.3 ± 2.1 | - |
| ABTS scavenging (%) | - | 91.6 ± 1.4 | - |
Table text extracted from the original PDF; superscript letters are shown inline. The original table image is below.
View original table image
References
14 in the original paper- Abdel-Aal EM, Young JC, Rabalski I. Anthocyanin composition in black, blue, pink, purple, and red cereal grains. Journal of Agricultural and Food Chemistry. 2006;54(13):4696-4704.
- Leardkamolkarn V, Thongthep W, Suttiarporn P. Chemopreventive properties of Thai pigmented rice bran extracts. Food Science and Technology Research. 2011;17(6):517-526.
- Bhat FM, Riar CS. Health benefits of pigmented rice: A review. Journal of Food Science and Technology. 2019;56(9):3934-3942.
- Pedro AC, Granato D, Rosso ND. Extraction of anthocyanins and polyphenols from black rice by aqueous ethanol. Food Chemistry. 2016;202:438-446.
- Ju ZY, Howard LR. Effects of solvent and temperature on pressurized extraction of anthocyanins from blueberry pomace. Journal of Food Science. 2003;68(4):1364-1369.
- Japón-Luján R, Luque de Castro MD. Solvent and temperature optimization for olive leaf phenolics. Journal of Chromatography A. 2006;1108(1):76-82.
- Myers RH, Montgomery DC, Anderson-Cook CM. Response surface methodology: Process and product optimization using designed experiments. 4th ed. John Wiley and Sons; 2016.
- Yodmanee S, Karrila TT, Pakdeechanuan P. Physical, chemical and antioxidant properties of pigmented rice grown in southern Thailand. International Food Research Journal. 2011;18(3):901-906.
- American Journal of Enology and Viticulture. 1965;16(3):144-158.
- Zhishen J, Mengcheng T, Jianming W. The determination of flavonoid contents in mulberry and their scavenging effects on superoxide radicals. Food Chemistry. 1999;64(4):555-559.
- Brand-Williams W, Cuvelier ME, Berset C. Use of a free radical method to evaluate antioxidant activity. LWT -Food Science and Technology. 1995;28(1):2530.
- Re R, Pellegrini N, Proteggente A. Antioxidant activity applying an improved ABTS radical cation decolorization assay. Free Radical Biology and Medicine. 1999;26(9):1231-1237.
- Chen MH, McClung AM, Bergman CJ. Phenolic content, anthocyanins, and antiradical capacity of diverse purple rice genotypes. Cereal Chemistry. 2017;94(1):110-117.
- Pengkumsri N, Chaiyasut C, Sivamaruthi BS. Antioxidant capacity and total phenolics of Thai pigmented and non-pigmented rice varieties. International Journal of Pharmacology. 2015;11(5):425433.