
Research article · 2026 · Full text
International Journal of Biology SciencesOptimization of seaweed enriched fish cutlets: Nutritional, sensory, and textural characterization
Volume 8(2) · Pages 26–33 · DOI: 10.33545/26649926.2026.v8.i2a.570 ↗
Research areasSeaweed-derived Bioactive CompoundsProtein Hydrolysis and Bioactive PeptidesProbiotics and Fermented Foods
Abstract
Author-writtenIn order to improve nutritional, sensory, and textural qualities for better value-added food formulations, this study investigates the optimisation of fish cutlets fortified with Hypnea musciformis seaweed. Different concentrations of seaweed powder were added to tilapia-based cutlet mixtures to create formulations, which were then thoroughly examined. This study aims to strike a balance between consumer-preferred sensory and textural profiles in the optimization of seaweed-enriched foods. Seaweed's dietary fiber promotes gut microbiota health by functioning as a prebiotic in addition to improving texture and moisture retention, both of which are valued in sensory evaluation. Another beneficial feature is the potential for seaweed to partially replace fat, which could aid in the creation of healthier, lower-calorie foods without sacrificing flavour or consumer acceptance. By enabling the creation of functional fish products with enhanced shelf life, additional health benefits, and appealing sensory qualities, seaweed fortification introduces innovation to the seafood industry and positions seaweed-fortified cutlets as high-end, functional foods perfect for contemporary consumers looking for new flavours and healthier options.
Summary
Source-checkedPlain-language reading of the full paper, prepared with AI and checked against the text. Each point links to the authors' own words.
Why it matters
- Value addition transforms low-value commodities into products with better functionality, quality, and commercial appeal. View evidence ↗
- The dietary fiber in seaweed acts as a prebiotic for gut health and can improve the moisture retention and texture of food products. View evidence ↗
The question
- The study aims to optimize fish cutlets fortified with the red seaweed species Hypnea musciformis. View evidence ↗
- The research seeks to find a balance between textural profiles and sensory qualities preferred by consumers. View evidence ↗
What they did
- Fresh Nile tilapia (Oreochromis niloticus) from Egumitta fish farms in Nellore was used as the primary fish source. View evidence ↗
- Five different concentrations of Hypnea musciformis seaweed powder (1%, 2%, 3%, 4%, and 5%) were added to the cutlet mixtures. View evidence ↗
- Statistical significance across treatments was evaluated using a one-way ANOVA in SPSS based on triplicate measurements. View evidence ↗
What they found
- Ash content, indicating mineral levels, increased from 1.94 ± 0.06% in the control to 2.42 ± 0.01% in T5. View evidence ↗
- Protein content progressively decreased from 20.61 ± 0.71% in the control to 17.56 ± 0.30% in T5. View evidence ↗
- Fat content decreased significantly from 7.28 ± 0.05% in the control to 5.81 ± 0.04% in T5. View evidence ↗
- Textural hardness varied by less than 5% across treatments, ranging from 5.33 ± 0.09 in the control to 5.55 ± 0.05 in T5. View evidence ↗
- Springiness showed a progressive increase from 0.723 ± 0.05 in the control to 0.779 ± 0.05 in T5. View evidence ↗
- Treatment 3 was the most preferred sample, with an overall acceptability score of 8.5, compared to 7.8 for the control. View evidence ↗
- Higher concentrations of seaweed (T4 and T5) led to a decline in preference, with T5 scoring the lowest overall acceptability at 7.2. View evidence ↗
What it means
- Moderate seaweed inclusion is recommended to improve the nutritional and functional profile of fish cutlets without compromising sensory or textural quality. View evidence ↗
Visual summary
3 visualsIllustrations explain the paper; charts are replotted from the paper's own table values.
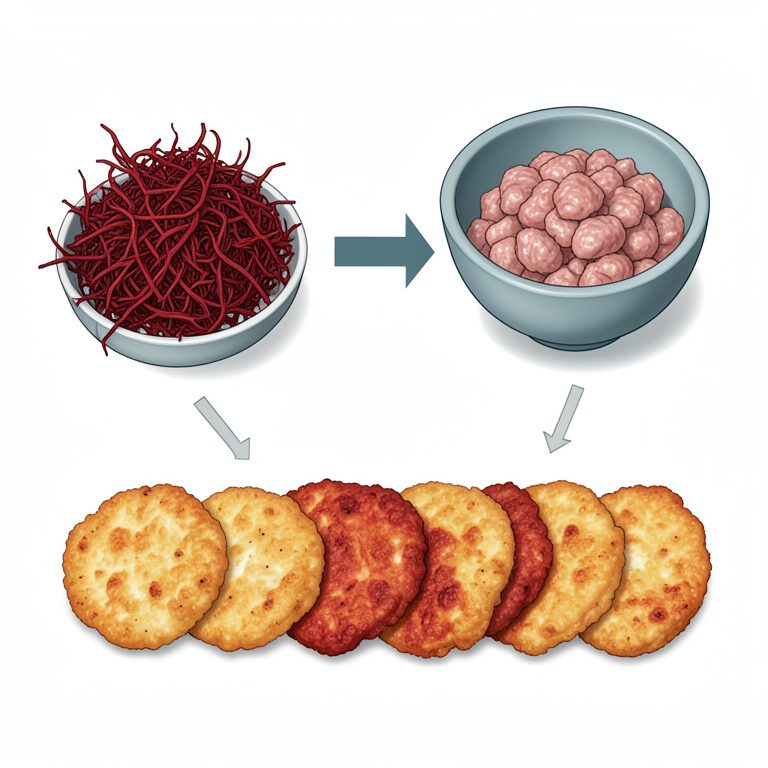
Experimental Setup
AI-generated conceptual illustration (Hypnea musciformis red seaweed and fish cutlets). It explains the idea and does not show study data.
View source evidence ↗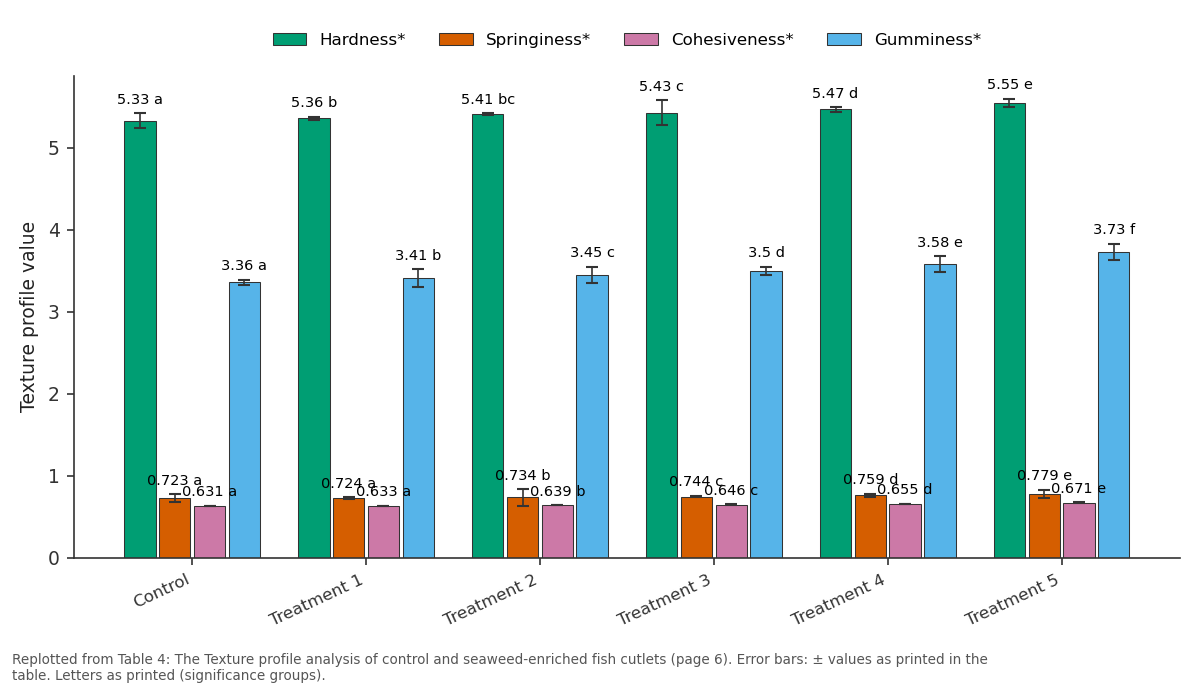
Hardness* and Springiness* and more: Control vs Treatment 1 vs Treatment 2 vs Treatment 3 vs Treatment 4
Replotted from Table 4 (page 6) of the original paper. Every bar is the paper's own table value.
View source evidence ↗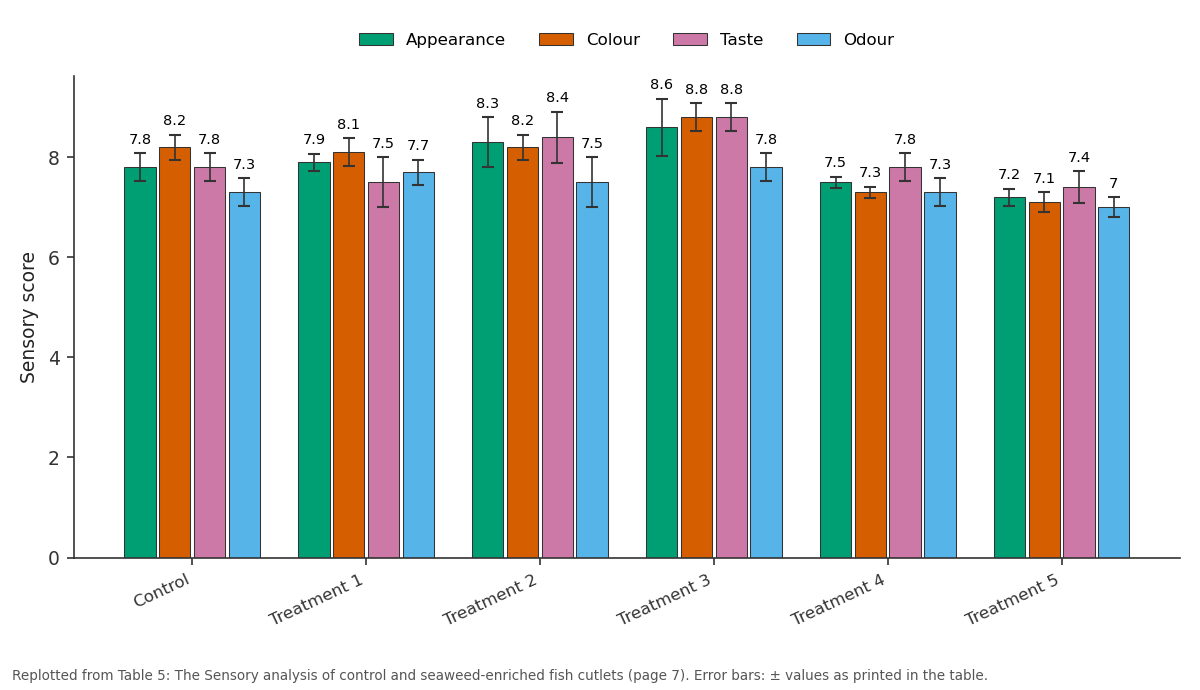
Appearance and Colour and more: Control vs Treatment 1 vs Treatment 2 vs Treatment 3 vs Treatment 4
Replotted from Table 5 (page 7) of the original paper. Every bar is the paper's own table value.
View source evidence ↗Figures & tables
From the original paper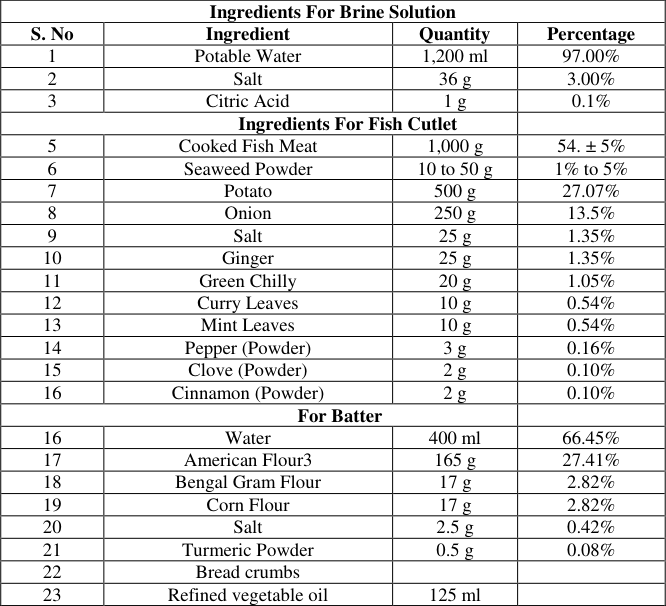 Table 1
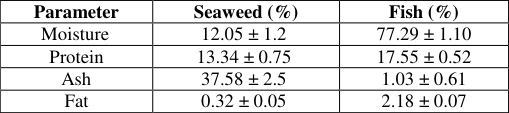 Table 2
 Table 3
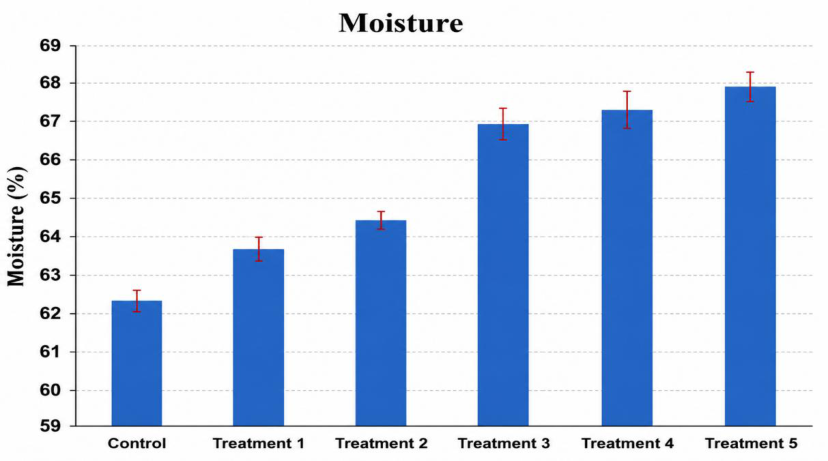 Figure 1
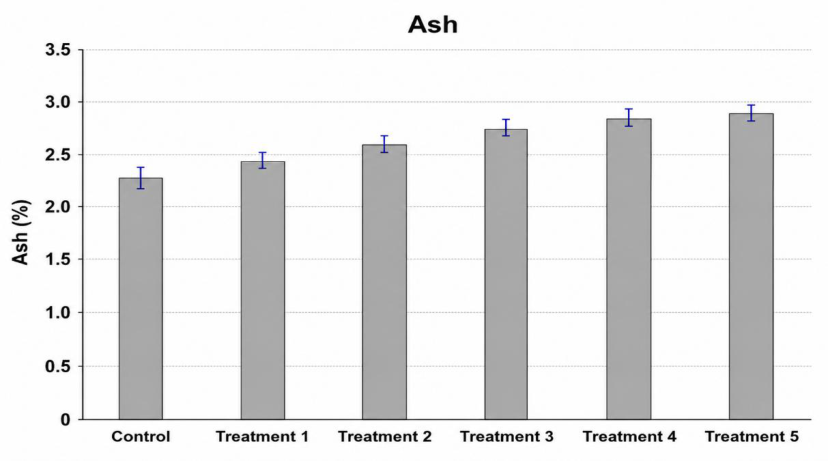 Figure 2
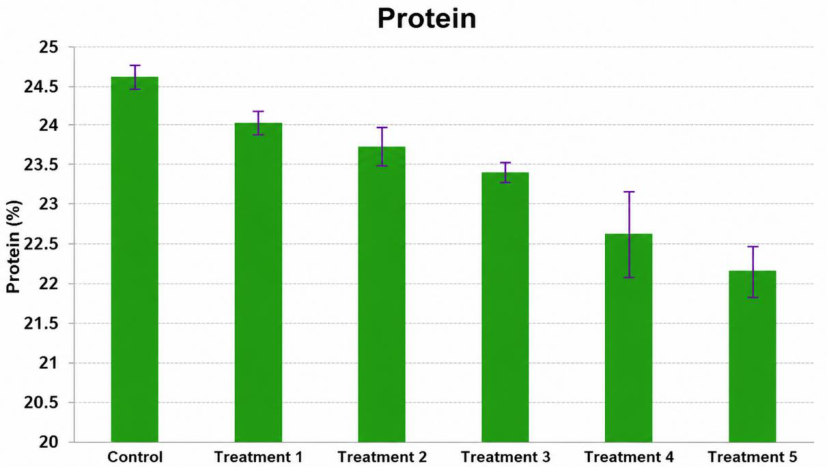 Figure 3
 Table 4
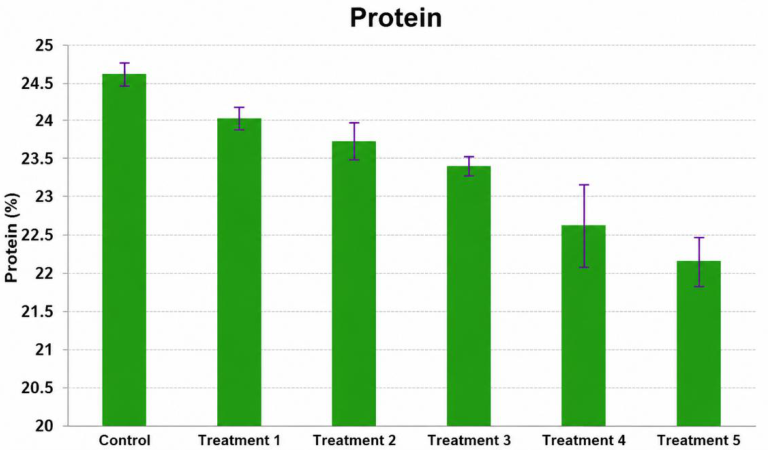 Figure 4
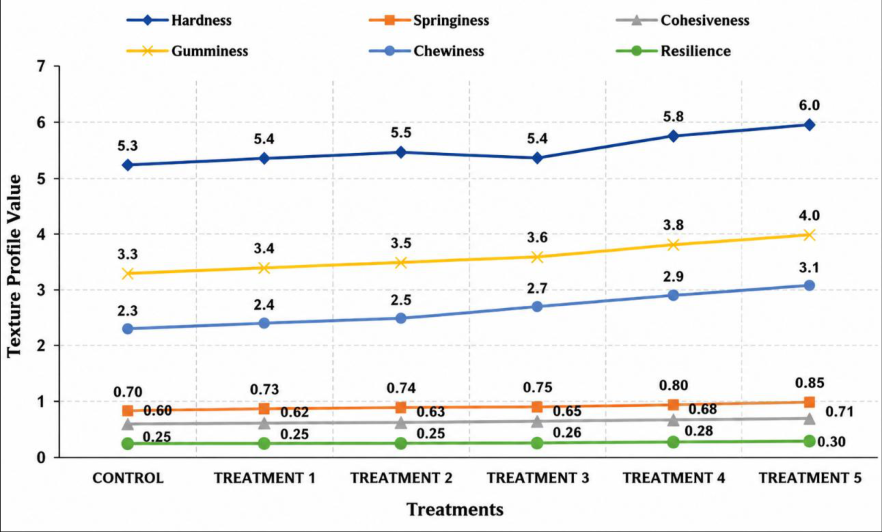 Figure 5
 Table 5
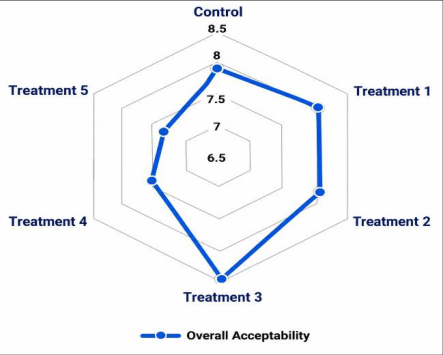 Figure 6
Introduction
Value addition is a process that transforms low-value commodities into goods with improved qualities, functionality, and enhanced commercial appeal. This concept has expanded beyond just financial considerations to include a variety of improvements, such as better nutrition, improved sensory attributes, sustainability, and health-promoting qualities. Value-added food products have varying market potential, depending on the product category and geographic location. Value addition, or upcycling of food, is crucial in addressing the global issue of food waste, which accounts for approximately 17% of the world's total food production (Di Fraia et al., 2024) [11] . One of the most rapidly growing markets for value addition is functional foods, whose estimated global market value is expected to reach USD 280 billion by 2025 (Hlaváčová et al., 2022) [14] . Coming to fish and fishery products, bioactive substances obtained from low-value fish and fishery waste have a lot of potential for use in pharmaceutical and nutraceutical applications. These substances have a number of advantageous qualities, such as anti-inflammatory, anti-hypertensive, antimicrobial, antioxidant, and anti-obesity effects (Jimenez-Champi et al., 2024) [15] . While in global agricultural markets, where primary commodities frequently experience price fluctuations and declining terms of trade, it is very important that significant economic benefits are produced throughout the value chain by value addition in fisheries. By making additional value from the same resource, value addition can boost profits for both fishermen and processors. Apart from that, Fishermen can improve income stability and lessen their exposure to market swings by diversifying into value-added products. This can be achieved through product differentiation and the creation of niche markets (Siddiqui et al., 2024) [30] . The focus on value-added foods as a preventive health strategy is growing due to the global rise in diet-related diseases, such as obesity, diabetes, cardiovascular conditions, and certain types of cancer. Functional food-rich diets have been shown to help regulate physiological processes and lower disease risk factors (Hlaváčová et al., 2022) [14] . Fish are known for their incredibly high-quality protein, essential amino acids, omega-3 fatty acids (EPA and DHA), and essential micronutrients like calcium, iron, zinc, selenium, and iodine. In addition to promoting the growth of muscles and tissues, these nutrients are essential for preventing malnutrition, particularly in young people. Value-added fish products, such as fish powder, fortified foods, fish oil capsules, and hydrolysates, can be consumed to help vulnerable groups, including children, pregnant women, and people at risk of chronic deficiencies, receive specialized nutrition. Value-added fish products contain polyunsaturated and monounsaturated fatty acids, which are known to improve cognitive function and reduce the risk of coronary heart disease. Additionally, value-added processing methods work to maintain these essential nutrients, guaranteeing high nutritional retention and promoting food security and improved health outcomes for a variety of communities (Ali et al., 2022; Noreen et al., 2025; Byrd et al., 2025) [1,21] . Seaweeds are becoming more and more recognized as "superfoods" that are nutrient-dense foods that provide substantial health advantages above and beyond simple nutrition. They are a valuable addition to the human diet because of their exceptional nutritional qualities. Proteins, dietary fibers, omega-3 and omega-6 unsaturated fatty acids, vitamins A, B, C, D, E, and K, and vital minerals like calcium, iron, iodine, magnesium, and potassium are all abundant in seaweeds (Leandro et al., 2020; Sobuj et al., 2025) [18,31] . Seaweeds are a rich source of bioactive substances, including polysaccharides like alginate, carrageenan, fucoidan, laminarin, and ulvan; polyphenols like phlorotannins; proteins; flavonoids; sterols; essential fatty acids (especially EPA and DHA); vitamins; minerals; and dietary fiber. A vast array of biological activities, including antioxidant, anti-inflammatory, antimicrobial, antiviral, anticoagulant, anti-diabetic, anti-tumor, and immunostimulatory effects, are facilitated by these substances. They offer further health benefits due to their higher concentrations of EPA and DHA than terrestrial plants. In addition, seaweed contains new metabolites like oxylipins and phlorotannins that have special medicinal and functional qualities (Ghaliaoui et al., 2024; Matos et al., 2024) [12,20] . Fucoidan, which is mostly present in brown seaweed, is particularly well-known for its antiviral, antitumor, antioxidative, and anti-inflammatory qualities, whereas laminarin boosts immunity and has nutraceutical advantages. (Lomartir and Gonçalves, 2022) [19] . Seaweeds vary greatly in their nutritional and functional characteristics. For example, brown species (such as Sargassum) tend to have higher levels of protein, iodine, and specialized polysaccharides like fucoidan, while red species (like Gracilaria) contain more protein and carrageenan (Ullah et al., 2023; Premarathna et al., 2022) [34,24] . These species-specific compounds, such as alginate, carrageenan, and ulvan, increase viscosity, moisture retention, and mouthfeel. Their rich nutritional profile, fiber, minerals, and antioxidants add functional value, while distinct marine flavors with umami and salt notes elevate sensory appeal. These properties vary by species, influencing both the taste and performance of the final product, making seaweed a versatile ingredient for clean-label, health-focused formulations. Mamatha et al. (2007) [28] prepared pakoda, a common traditional snack food in India, using Enteromorpha, is a green seaweed.
Materials and Methods Collection And Preparation of Fish and Seaweed
The Nile tilapia (Oreochromis niloticus) used in the present study was collected in very fresh condition, from Egumitta fish farms located in Nellore, and iced immediately after the catch in the ratio of 1:1 and transported to the Fish Processing laboratory of the College of Fishery Science, Muthukur. Red seaweed used in this study, Hypnea musciformis, was obtained from the RK Algae Project Centre, which was collected from the intertidal region of Mandapam of the Gulf of Mannar, South East coast of India. Seaweed was airdried without exposure to direct sunlight for two days in a clean and dry space. The dried seaweeds were powdered using an electric mixer, and the powder was sieved into minute particles. The seaweed powder was packed in polythene bags and stored at room temperature until further use for the preparation of products.
Characteristics of Hypnea musciformis
The red seaweed species Hypnea musciformis is distinguished by its cylindrical, loosely entwined branches that have flattened, hook-like tips. Its typical height is 10 to 20 cm. It has a lot of branches, is firm, cartilaginous, and frequently exhibits tendril-like branching. The seaweed, which grows in tide pools, rocky benches, and intertidal and shallow subtidal reef flats, is typically red but can turn yellowish-brown in conditions with low nutrient levels or intense light. Sulfated polysaccharides, especially carrageenans, which have strong anti-inflammatory, anticancer, and antioxidant effects, are abundant in Hypnea musciformis. Furthermore, it contains a wide range of phytochemicals, such as organic and fatty acids, amino acids, polyphenols like epicatechin, phloretin, and tannins, and others, which together give the seaweed its broadspectrum bioactivities, including antimicrobial, antiviral, anti-inflammatory, and anti-obesity properties (Rafiquzzaman et al., 2016; Rozo et al., 2019; Goutas et al., 2024) [25,26,13] . According to animal studies, supplementing with Hypnea musciformis reduces blood total cholesterol, triglycerides, and LDL cholesterol, which lowers risk factors for cardiovascular diseases (Saber et al., 2024) [27] .
Fish Cutlet Preparation
Fish cutlets were prepared using the standard recipe developed by the Central Institute of Fisheries Technology (CIFT), Kochi, with slight modifications. Seaweed-enriched fish cutlets were prepared with Hypnea musciformis seaweed powder, which was added in five different concentrations (designated as treatments T1 through T5) to create seaweed-enriched varieties. Following standardization, the enriched cutlets were subjected to traditional oil frying at 180-200 °C. In this study, nutritional quality, textural profile analysis, and sensory acceptability were used to estimate the effects of these treatments on the finished product. After cleaning, dressing, and cooking the fish for 15 minutes in 1.2 L of 3% brine (36 g salt and 1.2 g citric acid), the fish was drained and deboned. Then the meat is seasoned with salt and spices. Potatoes were washed and cooked, and added to the fish along with sautéed onions, ginger, and chili. Together with the fish meat, all ingredients were combined with 1-5% powdered Hypnea musciformis. After thoroughly mixing the seaweed, spices, and mashed potatoes, each 40 g cutlet was formed into a round shape. It was then coated in bread crumbs and dipped in batter, which is a mixture of maida, corn flour, Bengal gram, salt, and turmeric combined with water in a 1:2 ratio, followed by deep-frying at 180 to 200 °C. In order to determine and standardize the ideal concentration for product development, the prepared cutlets were then assessed using proximate composition, sensory profiling, and textural analysis. The mean and standard deviation obtained from triplicate measurements of each parameter were analyzed using SPSS to conduct a one-way ANOVA in order to evaluate statistical significance across treatments.
Clean and dress the whole fish ↓ Cook in a 3% brine solution for 15
Proximate Analysis
The proximate analysis of fish cutlets was conducted using validated protocols outlined by the Association of Official Analytical Chemists (AOAC, 2016) [3] . Moisture levels were measured through standardised drying procedures; protein concentration was estimated via the Kjeldahl nitrogen determination method; lipid content was isolated using Soxhlet extraction; and mineral residue (ash) was quantified following conventional incineration techniques.
Textural Profile Analysis
Texture Profile Analysis (TPA) was performed with XT2i Texture Analyzer (Stable Micro Systems, UK) following the protocol of (Kunnath et al., 2015) [17] to evaluate key mechanical attributes of the Fish cutlet samples, including hardness, adhesiveness, cohesiveness, springiness, and chewiness. A texture analyser equipped with a 50 kg load cell and a 75 mm cylindrical compression platen (P/75) was used for the analysis. Cutlets were evenly sliced into discs 2.5 cm thick. Each slice was gently placed flat on the analyser platform and subjected to a two-cycle compression test to simulate the chewing process. The platen compressed the sample at a constant speed of 1 mm/s. A trigger force of 10 g was applied for 2 seconds, with both the pre-test and post-test speeds set at 3 mm/s. Between compressions, the probe was retracted to a return distance of 35 mm to allow partial recovery of the sample before the second cycle.
Sensory Analysis
Sensory evaluation was performed using the Hedonic scale method, as described by Peryam and Girardot (1998) [23] , with slight modifications. This method involves systematically assessing key attributes, including appearance, colour, texture, odour, taste, and overall acceptability. These parameters are rated using a 9-point hedonic scale, which captures panel members' preferences ranging from "dislike extremely" to "like extremely," providing a structured framework for interpreting sensory responses.
Results and Discussion
Results and Discussion
Proximate composition
The proximate composition analysis showed clear nutritional differences between seaweed and fish. Seaweed contains a very high ash content (37.58 ± 2.5%), indicating its richness in minerals, whereas fish contains only 1.03 ± 0.61%. It also contained moderate levels of protein (13.34 ± 0.75%) and very low fat (0.32 ± 0.05%), while fish had a higher protein content (17.55 ± 0.52%) and fat level (2.18 ± 0.07%). In terms of moisture, fish contained substantially more (77.29 ± 1.10%) than seaweed (12.05 ± 1.2%). These findings highlight that while fish is superior in protein and fat content, seaweed serves as a valuable source of minerals with low fat, making it a functional complementary ingredient in fish-based products. [29] for H. musciformis collected in Bangladesh as: protein (18.64 ± 1.12%), ash (21.57 ± 1.04%), lipid (1.27 ± 0.41%), and moisture (11.54 ± 0.96%). And in another Olopade et al. (2016) [22] , analysing Nile tilapia (Oreochromis niloticus), reported moisture 81.32 ± 2.23%, protein 13.66 ± 2.19%, fat 0.54 ± 0.08%, and ash 1.36 ± 0.22%. This makes tilapia a lean, high-protein fish with lower mineral content
Proximate of seaweed-enriched cutlets
The moisture, ash, protein, and fat content of seaweed enriched cutlets increased significantly with the increase in seaweed concentration (Control to T5). The moisture content ranged from 53.17 ± 0.10% in the control to 55.61 ± 0.11% in T5. Similarly, ash content increased from 1.94 ± 0.06% to 2.42 ± 0.01%. The protein content showed a progressive decrease from 20.61 ± 0.71% in the control to 17.56 ± 0.30% in T5. Fat content also decreased significantly, ranging from 7.28 ± 0.05% in the control to 5.81 ± 0.04% in T5. These results clearly indicate that incorporation of seaweed in cutlets enhances their proximate composition, with notable improvements in moisture, ash, protein, and fat levels (Table 2). Incorporation of seaweed into value-added fish products has shown consistent effects on proximate composition in fish cutlets fortified with Eucheuma powder, Senthil et al. (2005) [28] reported that increasing the incorporation of seaweed from 0% to 15% raised the moisture content from 45.80 ± 0.37% to 55.43 ± 0.43% and ash from 5.54 ± 0.03% to 9.33 ± 0.04%, while protein and fat decreased from 22.97 ± 0.13% to 20.13 ± 0.05% and 44.00 ± 0.01% to 37.81 ± 0.03% and concluded that because of high hydrophilic fiber in seaweed increases water-holding capacity the moisture content also increases. Whereas the increase in ash content is due to increased mineral content present in seaweed. Seaweed addition has lower protein content than conventional protein sources (fish). This substitution reduces the overall protein percentage in the product (Kamunde et al., 2019) [16] , and the rigid seaweed cell wall structure (containing polysaccharides like carrageenan) can affect the overall protein percentage (Thiviya et al., 2022) [33] . Another study conducted by Choi et al. (2012) [8] on the effects of Laminaria japonica on pork patties when added at 0 to 5% (1%, 3% and 5%) showed similar results, which aligns with the current study. It is recorded that the moisture content increased from 49.39 ± 0.40% in the control to 56.29 ± 0.26% and ash from 2.31 ± 0.16% to 3.87 ± 0.24%, while protein and fat decreased from 20.88 ± 0.71% to 20.13 ± 0.45% and 13.71 ± 0.82% to 10.52 ± 0.84% which aligns with our study.
| Parameter | Seaweed (%) | Fish (%) |
|---|---|---|
| Moisture | 12.05 ± 1.2 | 77.29 ± 1.10 |
| Protein | 13.34 ± 0.75 | 17.55 ± 0.52 |
| Ash | 37.58 ± 2.5 | 1.03 ± 0.61 |
| Fat | 0.32 ± 0.05 | 2.18 ± 0.07 |
Table text extracted from the original PDF; superscript letters are shown inline. The original table image is below.
View original table image
Texture profile analysis
Despite statistical significance, the texture profile results show that hardness, springiness, cohesiveness, gumminess, chewiness, and resilience of the fish cutlet samples only marginally vary across treatments. Hardness, for instance, differs by less than 5%, ranging from 5.33 ± 0.09 in the control to 5.55 ± 0.05 in T5. Likewise, cohesiveness, gumminess, and chewiness all show slight increases between treatments, while springiness progressively rises from 0.723 ± 0.05 (control) to 0.779 ± 0.05 (T5). With values ranging from 0.34 ± 0.00 (control) to 0.27 ± 0.01 (T5), the observed differences in resilience are negligible and stay within a very small numerical range. According to these results, there are statistically significant differences, but with incremental treatment additions, the practical differences in texture measurements are very small.
Table 4:
The Texture profile analysis of control and seaweed-enriched fish cutlets [8] reported the effects of Laminaria japonica on pork patties at 0 to 5% (control, 1%, 3% and [9] , edible seaweeds slightly improve the textural profile of meat products by enhancing water retention and strengthening proteinpolysaccharide interactions through the formation of a more rigid protein gel matrix. Choi et al. (2012) [8] suggested that improvement in texture with seaweed incorporation can be attributed to the water-binding and dietary fibre in the seaweed. Taken together, the incorporation of seaweed powder effectively increases the desirable texture profile of the seafood and meat products. Thus, seaweed functions as a natural texture enhancer in value-added products.
Sensory evaluation
The sensory evaluation of seaweed-enriched cutlets showed notable variation across the control and treatments. The present study on fish cutlets fortified with seaweed at different concentrations demonstrated that moderate inclusion significantly improved sensory attributes, with Treatment 3 achieving the highest overall acceptability score (8.5), compared to the control (7.8) and Treatment 2 (8.0). Similar trends were reported by Cullano and Ann (2025) [10] in seafood crackers, where balanced seaweed levels enhanced crispness and palatability, but high inclusion led to rejection because of strong seaweed aroma.
In line with our findings, a study on the incorporation of Alaria esculenta into fish patties reported that seaweed addition did not significantly alter the odour or flavour compared to controls, although textural changes such as increased rubberiness were observed with certain treatments (Sund et al., 2025) [32] . This supports the observation in our study where moderate inclusion levels (T2 and T3) enhanced overall acceptability without compromising core sensory traits, while higher inclusion may negatively impact texture and consumer perception.
Conclusion
Seaweed fortification in fish cutlets results in increased moisture and ash content, alongside slight decreases in protein and fat levels. Among the treatments, T3 emerged as the optimal formulation, displaying the best balance between enhanced nutrition and sensory acceptability. Sensory evaluations revealed that T1, T2, and T3 had superior acceptability to the control, while T4 and T5, with excessive seaweed content, showed reduced preference. Textural profile analysis indicated only minor increases in parameters such as hardness and cohesiveness, suggesting that the textural integrity of the cutlets was well maintained with seaweed incorporation. The slight decline in protein and fat at higher inclusion levels is offset by mineral enrichment and moisture retention, highlighting the value addition through improved nutritional quality. This balance in T3 promotes consumer appeal without compromising product quality, emphasizing the importance of moderation in fortification to maximize benefits. Overall, the findings support that moderate seaweed inclusion enhances the functional and nutritional profile of fish cutlets while sustaining desirable sensory and textural characteristics, making T3 the most favourable formulation for producing value-added, health-promoting seafood products.
Figures and tables from the paper
| Ingredients For Brine Solution | — | — | — |
|---|---|---|---|
| S. No | Ingredient | Quantity | Percentage |
| 1 | Potable Water | 1,200 ml | 97.00% |
| 2 | Salt | 36 g | 3.00% |
| 3 | Citric Acid | 1 g | 0.1% |
| Ingredients For Fish Cutlet | |||
| 5 | Cooked Fish Meat | 1,000 g | 54. ± 5% |
| 6 | Seaweed Powder | 10 to 50 g | 1% to 5% |
| 7 | Potato | 500 g | 27.07% |
| 8 | Onion | 250 g | 13.5% |
| 9 | Salt | 25 g | 1.35% |
| 10 | Ginger | 25 g | 1.35% |
| 11 | Green Chilly | 20 g | 1.05% |
| 12 | Curry Leaves | 10 g | 0.54% |
| 13 | Mint Leaves | 10 g | 0.54% |
| 14 | Pepper (Powder) | 3 g | 0.16% |
| 15 | Clove (Powder) | 2 g | 0.10% |
| 16 | Cinnamon (Powder) | 2 g | 0.10% |
| For Batter | |||
| 16 | Water | 400 ml | 66.45% |
| 17 | American Flour3 | 165 g | 27.41% |
| 18 | Bengal Gram Flour | 17 g | 2.82% |
| 19 | Corn Flour | 17 g | 2.82% |
| 20 | Salt | 2.5 g | 0.42% |
| 21 | Turmeric Powder | 0.5 g | 0.08% |
| 22 | Bread crumbs | ||
| 23 | Refined vegetable oil | 125 ml |
Table text extracted from the original PDF; superscript letters are shown inline. The original table image is below.
View original table image
| — | Moisture* (%) | Ash* (%) | Protein* (%) | Fat* (%) |
|---|---|---|---|---|
| Control | 53.17 ± 0.10a | 1.94 ± 0.06a | 20.61 ± 0.71e | 7.28 ± 0.05f |
| Treatment 1 | 53.35 ± 0.03b | 2.01 ± 0.02b | 20.29 ± 0.08d | 7.03 ± 0.07e |
| Treatment 2 | 54.54 ± 0.04c | 2.15 ± 0.01c | 19.66 ± 0.17cd | 6.96 ± 0 .07d |
| Treatment 3 | 54.69 ± 0.48d | 2.24 ± 0.01d | 19.13 ± 0.10bc | 6.59 ± 0.09c |
| Treatment 4 | 55.23 ± 0.64e | 2.34 ± 0.01e | 18.37 ± 0.50ab | 6.16 ± 0.08b |
| Treatment 5 | 55.61 ± 0.11e | 2.42 ± 0.01f | 17.56 ± 0.30a | 5.81 ± 0.04a |
Table text extracted from the original PDF; superscript letters are shown inline. The original table image is below.
View original table image
| — | Hardness* | Springiness* | Cohesiveness* | Gumminess* | Chewiness* | Resilience* |
|---|---|---|---|---|---|---|
| Control | 5.33 ± 0.09a | 0.723 ± 0.05a | 0.631 ± 0.002a | 3.36 ± 0.03a | 2.41 ± 0.006a | 0.34 ± 0.00d |
| Treatment 1 | 5.36 ± 0.02b | 0.724 ± 0.01a | 0.633 ± 0.001a | 3.41 ± 0.11b | 2.53 ± 0.010b | 0.32 ± 0.01c |
| Treatment 2 | 5.41 ± 0.01bc | 0.734 ± 0.10b | 0.639 ± 0.001b | 3.45 ± 0.10c | 2.54 ± 0.010c | 0.30 ± 0.01b |
| Treatment 3 | 5.43 ± 0.15c | 0.744 ± 0.01c | 0.646 ± 0.003c | 3.50 ± 0.05d | 2.60 ± 0.001d | 0.29 ± 0.00ab |
| Treatment 4 | 5.47 ± 0.03d | 0.759 ± 0.02d | 0.655 ± 0.004d | 3.58 ± 0.10e | 2.71 ± 0.040e | 0.27 ± 0.01a |
| Treatment 5 | 5.55 ± 0.05e | 0.779 ± 0.05e | 0.671 ± 0.001e | 3.73 ± 0.10f | 2.90 ± 0.011f | 0.27 ± 0.01a |
Table text extracted from the original PDF; superscript letters are shown inline. The original table image is below.
View original table image
| — | Appearance | Colour | Taste | Odour | Texture | Overall Acceptability |
|---|---|---|---|---|---|---|
| Control | 7.8 ± 0.28 | 8.2 ± 0.25 | 7.8 ± 0.28 | 7.3 ± 0.28 | 8.0 ± 0.50 | 7.8 ± 0.15 |
| Treatment 1 | 7.9 ± 0.17 | 8.1 ± 0.28 | 7.5 ± 0.50 | 7.7 ± 0.25 | 7.8 ± 0.27 | 7.9 ± 0.14 |
| Treatment 2 | 8.3 ± 0.50 | 8.2 ± 0.25 | 8.4 ± 0.51 | 7.5 ± 0.50 | 7.9 ± 0.17 | 8.0 ± 0.22 |
| Treatment 3 | 8.6 ± 0.57 | 8.8 ± 0.28 | 8.8 ± 0.28 | 7.8 ± 0.28 | 8.3 ± 0.28 | 8.5 ± 0.10 |
| Treatment 4 | 7.5 ± 0.11 | 7.3 ± 0.11 | 7.8 ± 0.28 | 7.3 ± 0.28 | 7.6 ± 0.28 | 7.5 ± 0.12 |
| Treatment 5 | 7.2 ± 0.17 | 7.1 ± 0.20 | 7.4 ± 0.32 | 7.0 ± 0.20 | 7.1 ± 0.02 | 7.2 ± 0.10 |
Table text extracted from the original PDF; superscript letters are shown inline. The original table image is below.
View original table image
References
34 in the original paper- Ali A, Wei S, Ali A, Khan I, Sun Q, Xia Q, et al. Research progress on nutritional value, preservation, and processing of fish. A review. Foods. 2022;11(22):3669.
- AOAC. Official methods of analysis. 17th ed. Washington (DC): Association of Official Analytical Chemists; 2000.
- AOAC. Official method 928.08: Protein content analysis in fish and fish products. Washington (DC): Association of Official Analytical Chemists; 2016.
- AOAC. Official method 938.08: Ash content analysis in fish and fish products. Washington (DC): Association of Official Analytical Chemists; 2016.
- AOAC. Official method 950.46: Moisture content analysis in fish and fish products. Washington (DC): Association of Official Analytical Chemists; 2016.
- AOAC. Official method 991.36: Crude fat analysis in fish and fish products. Washington (DC): Association of Official Analytical Chemists; 2016.
- Byrd KA, Shieh J, Mork S, Pincus L, O'Meara L, Atkins M, et al. Fish and fish-based products for nutrition and health in the first 1000 days: A systematic review of the evidence from low and middle-income countries. Adv Nutr. 2022;13(6):2458-2487.
- Choi YS, Choi JH, Han DJ, Kim HY, Kim HW, Lee MA, et al. Effects of Laminaria japonica on the physico-chemical and sensory characteristics of reduced-fat pork patties. Meat Sci. 2012;91(1):1-7.
- Cofrades S, López-López I, Solas MT, Bravo L, Jiménez-Colmenero F. Influence of different types and proportions of added edible seaweeds on characteristics of low-salt gel/emulsion meat systems. Meat Sci. 2008;79(4):767-776.
- Cullano T, Ann R. Optimization of seafood crackers formulation as influenced by Eucheuma cottonii and Caulerpa lentillifera seaweed levels. J Appl Nat Sci. 2025;17(2).
- Di Fraia S, Sharmila VG, Banu JR, Massarotti N. A comprehensive review on upcycling of food waste into value-added products towards a circular economy: Holistic approaches and life cycle assessments. Trends Food Sci Technol. 2024;143:104288.
- Ghaliaoui N, Hazzit M, Mokrane H. Seaweeds as a potential source of bioactive compounds. Res Biotechnol Environ Sci. 2024;3(1):1-8.
- Goutas A, Goutzourelas N, Kevrekidou A, Kevrekidis DP, Malea P, Virgiliou C, et al. Hypnea musciformis seaweed extract protected human mesenchymal stem cells from oxidative stress through NRF2 activation. Food Sci Nutr. 2024;12(12):10816-10835.
- Hlaváčová Z, Ivanišová E, Hlaváč P, Kubík Ľ, Kunecová D, Božiková M, et al. Value-added foods: Characteristic, benefits, and physical properties. In: Trends and Innovations in Food Science. London: IntechOpen; 2022.
- Jiménez-Champi D, Romero-Orejon FL, Muñoz AM, Ramos-Escudero F. The revalorization of fishery byproducts: Types, bioactive compounds, and food applications. Int J Food Sci. 2024;2024(1):6624083.
- Kamunde C, Sappal R, Melegy TM. Brown seaweed (AquaArom) supplementation increases food intake and improves growth, antioxidant status, and resistance to temperature stress in Atlantic salmon, Salmo salar. PLoS One. 2019;14(7):e0219792.
- Kunnath S, Lekshmi M, Chouksey MK, Kannuchamy N, Gudipati V. Textural quality and oxidative stability of restructured pangasius mince: Effect of protein substrates mediated by transglutaminase. J Food Sci Technol. 2015;52(1):351-358.
- Leandro A, Pacheco D, Cotas J, Marques JC, Pereira L, Gonçalves AM. Seaweed's bioactive candidate compounds to food industry and global food security. Life. 2020;10(8):140.
- Lomartire S, Gonçalves AM. An overview of potential seaweed-derived bioactive compounds for pharmaceutical applications. Mar Drugs. 2022;20(2):141.
- Matos J, Cardoso C, Serralheiro ML, Bandarra NM, Afonso C. Seaweed bioactives potential as nutraceuticals and functional ingredients: A review. J Food Compos Anal. 2024;133:106453.
- Noreen S, Hashmi B, Aja PM, Atoki AV. Health benefits of fish and fish by-products-a nutritional and functional perspective. Front Nutr. 2025;12:1564315.
- Olopade OA, Taiwo IO, Lamidi AA, Awonaike OA. Proximate composition of Nile tilapia (Oreochromis niloticus) (Linnaeus, 1758) and tilapia hybrid (red tilapia) from Oyan Lake, Nigeria. Bull UASVM Food Sci Technol. 2016;73(1):19-23.
- Peryam DR, Girardot NF. Advanced taste-test method. Hedonic scale. 1998.
- Premarathna AD, Tuvikene R, Fernando PHP, Adhikari R, Perera MCN, Ranahewa TH, et al. Comparative analysis of proximate compositions, mineral and functional chemical groups of 15 different seaweed species. Sci Rep. 2022;12(1):19610.
- Rafiquzzaman SM, Ahmad MU, Lee JM, Kim EY, Kim YO, Kim DG, et al. Phytochemical composition and antioxidant activity of edible red alga Hypnea musciformis from Bangladesh. J Food Process Preserv. 2016;40(5):1074-1083.
- Rozo G, Rozo C, Puyana M, Ramos FA, Almonacid C, Castro H. Two compounds of the Colombian algae Hypnea musciformis prevent oxidative damage in human low-density lipoproteins LDLs. J Funct Foods. 2019;60:103399.
- Saber H, Rushdi MI, Saber AA, Abdelmohsen UR, Pereira L. Evaluation of the genus Hypnea phytochemical and pharmacological potential. Algal Res. 2024;81:103586.
- Senthil MA, Mamatha BS, Mahadevaswamy M. Effect of using seaweed (Eucheuma) powder on the quality of fish cutlet. Int J Food Sci Nutr. 2005;56(5):327-335.
- Siddique MAM, Aktar M, bin Mohd Khatib MA. Proximate chemical composition and amino acid profile of two red seaweeds (Hypnea pannosa and Hypnea musciformis) collected from St. Martin's Island, Bangladesh. J Fish Sci. 2013;7(2):178-186.
- Siddiqui S, Afshan H, Hashmi S, Srivastava A. Value addition of fish in Jammu and Kashmir: A review. J Aquac. 2024;69-78.
- Sobuj MKA, Raiyan MHI, Raihan MJ, Islam MA, Hasan MM, Rahman S. A cross-sectional study on consumer approaches towards seaweed value-added food products from Bangladesh. Int J Gastr Food Sci. 2025;39:101128.
- Sund R, Drobac G, Stévant P, Holdt SL, BangBerthelsen CH, Hyldig G, et al. Impact of post-harvest processing on Alaria esculenta and its application in a model fish-based product. Appl Food Res. 2025:101309.
- Thiviya P, Gamage A, Gama-Arachchige NS, Merah O, Madhujith T. Seaweeds as a source of functional proteins. Phycology. 2022;2(2):216-243.
- Ullah MR, Akhter M, Khan ABS, Yasmin F, Hasan MM, Bosu A, et al. Comparative estimation of nutritionally important chemical constituents of red seaweed, Gracilariopsis longissima, affected by different drying methods. J Food Qual. 2023;2023(1):6623247.