
Research article · 2025 · Full text
International Journal of Agriculture and Food ScienceDevelopment and Evaluation of Barnyard Millet-Makhana Fortified Biscuits for Nutritional and Functional Enhancement
Volume 7(10) · Pages 548–553 · DOI: 10.33545/2664844x.2025.v7.i10h.921 ↗
Research areasFood composition and propertiesSeed and Plant BiochemistryFood Industry and Aquatic Biology
Abstract
Author-writtenNutrient-dense cereals and aquatic seeds can improve the health profile of baked snacks, yet many wheat-based biscuits remain low in protein, minerals and functional lipids. Addressing this limitation, we formulated barnyard millet and makhana fortified biscuits to enhance macro & micronutrients while maintaining consumer acceptability and shelf stability. A control sample of 100 % wheat flour was compared with three formulations V1, V2 and V3 substituting barnyard millet with sorghum and makhana in varying ratios. Physical property analysis showed significant changes in spread and thickness. Diameter increased in fortified samples with V1 and V2 recording F values of 248.16 and 246.58 respectively at p > 0.05. Thickness was highest in V1 with F value 305.86 while weight increased significantly in V1 and V3. Proximate composition confirmed strong nutritional improvements. Moisture declined from 10.98 % in control to 8.71 % in V3 while carbohydrates decreased from 52.24 to 35.34 %. Protein content rise from 9.55 to 16.49 % and fat from 9.08 to 24.49 %. Energy values increased from 311.57 kcal to 396.53 kcal. Mineral fortification was evident with calcium rising from 128.87 to 147.98 mg per 100 g and iron from 3.46 to 4.38 mg per 100 g in V3. Ash increased from 2.32 to 2.84 %. One-way ANOVA indicated large variations in all chemical parameters with large F values of 4679.96 and 474.45 for iron and calcium, respectively. Panel testing with five-point scale and 30 panelists resulted in V2 being the most preferred with score of 4.6 for overall acceptability. Shelf-life testing of V2 for 30 days resulted in moisture increasing up to 14.94 % against 5.6 % in the control while free fatty acid values remained constant. These are confirmation of the existence of V2 as a nutritious, consumer-acceptable and stable functional biscuit.
Summary
Source-checkedPlain-language reading of the full paper, prepared with AI and checked against the text. Each point links to the authors' own words.
Why it matters
- Barnyard millet and makhana are nutrient-dense, low-glycemic ingredients rich in fiber, protein, and minerals like iron and calcium, making them suitable for healthy food alternatives. View evidence ↗
- Replacing wheat flour in biscuits removes gluten, which can lead to poor texture and mouthfeel, necessitating a careful balance of substitute flours to maintain quality. View evidence ↗
The question
- The study aimed to develop a new biscuit formulation using barnyard millet and makhana flour and evaluate the effect of different concentration levels of these flours. View evidence ↗
What they did
- Biscuits were baked at 170°C for 20 minutes and stored in HDPE pouches for analysis. View evidence ↗
- Sensory acceptability was tested by 30 untrained judges using a 5-point hedonic scale. View evidence ↗
- The most preferred variant underwent a 30-day shelf-life study at ambient conditions, monitoring free fatty acids and sensory attributes at 0, 15, and 30 days. View evidence ↗
What they found
- Fortification significantly altered the biscuit diameter and spread ratio, with V1 and V2 showing the most pronounced increases. View evidence ↗
- Variation V2 maintained thickness and weight most similar to the control biscuit, unlike V1 and V3 which showed significant changes. View evidence ↗
- Fortification in V3 significantly increased protein (9.55% to 16.49%), fat (9.08% to 24.49%), and energy (311.57 kcal to 396.53 kcal). View evidence ↗
- Mineral content increased in V3, with calcium rising from 128.87 to 147.98 mg/100g and iron from 3.46 to 4.38 mg/100g. View evidence ↗
- Variation V2 was the most preferred by the panel, achieving the highest overall acceptability score of 4.6/5. View evidence ↗
What it means
- The authors conclude that V2 is the most effective formulation for enhancing nutrition while maintaining quality, suggesting that moisture-proof packaging can preserve its quality for at least one month. View evidence ↗
- The authors note that the fortified flour blend in V2 is more hygroscopic, which may negatively impact the crispness of the biscuits during long-term storage. View evidence ↗
Visual summary
2 visualsIllustrations explain the paper; charts are replotted from the paper's own table values.
Nutritional Shift from Control to V3
AI-generated conceptual illustration (wheat biscuits, barnyard millet grains, and makhana seeds). It explains the idea and does not show study data.
View source evidence ↗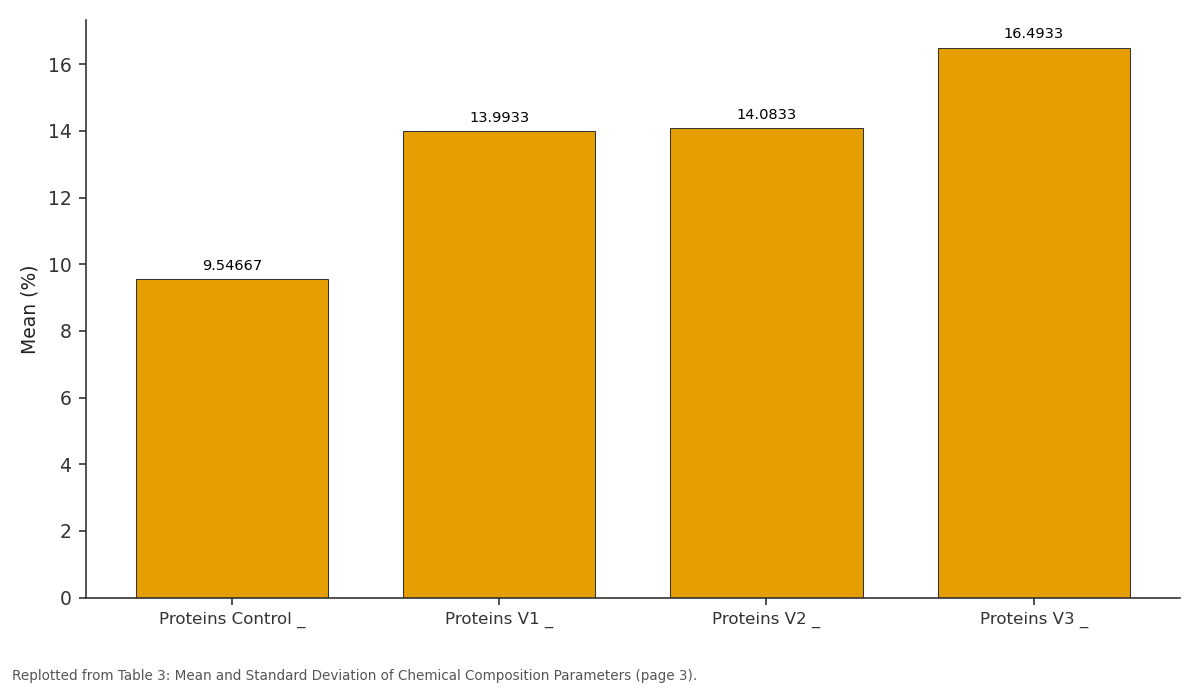
Mean: Proteins Control _ vs Proteins V1 _ vs Proteins V2 _ vs Proteins V3 _
Replotted from Table 3 (page 3) of the original paper. Every bar is the paper's own table value.
View source evidence ↗Figures & tables
From the original paper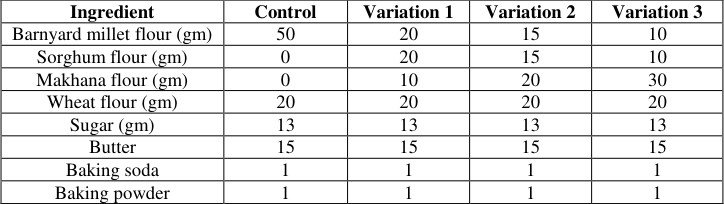 Table 1
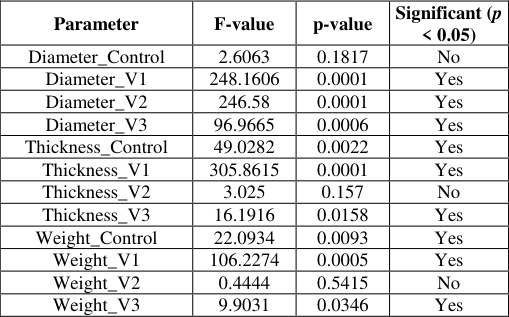 Table 2
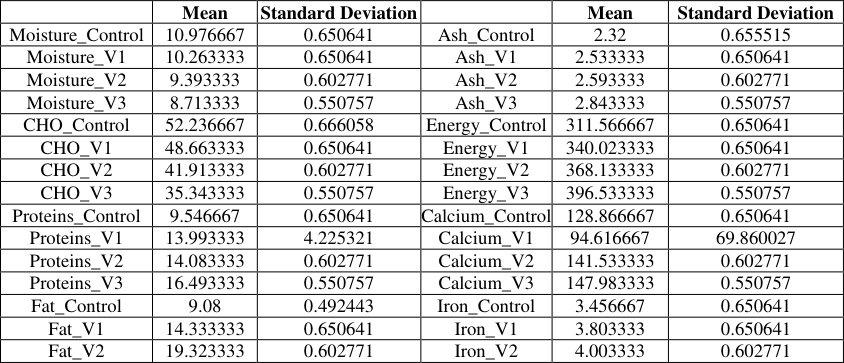 Table 3
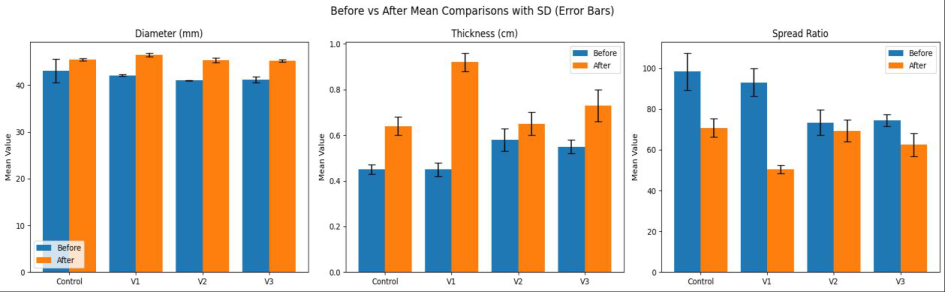 Figure 1
 Table 4
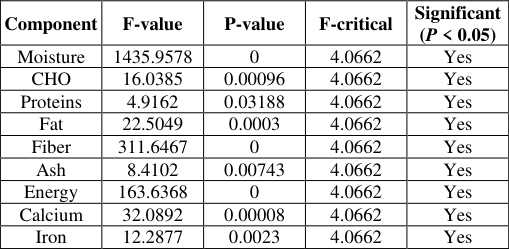 Table 4
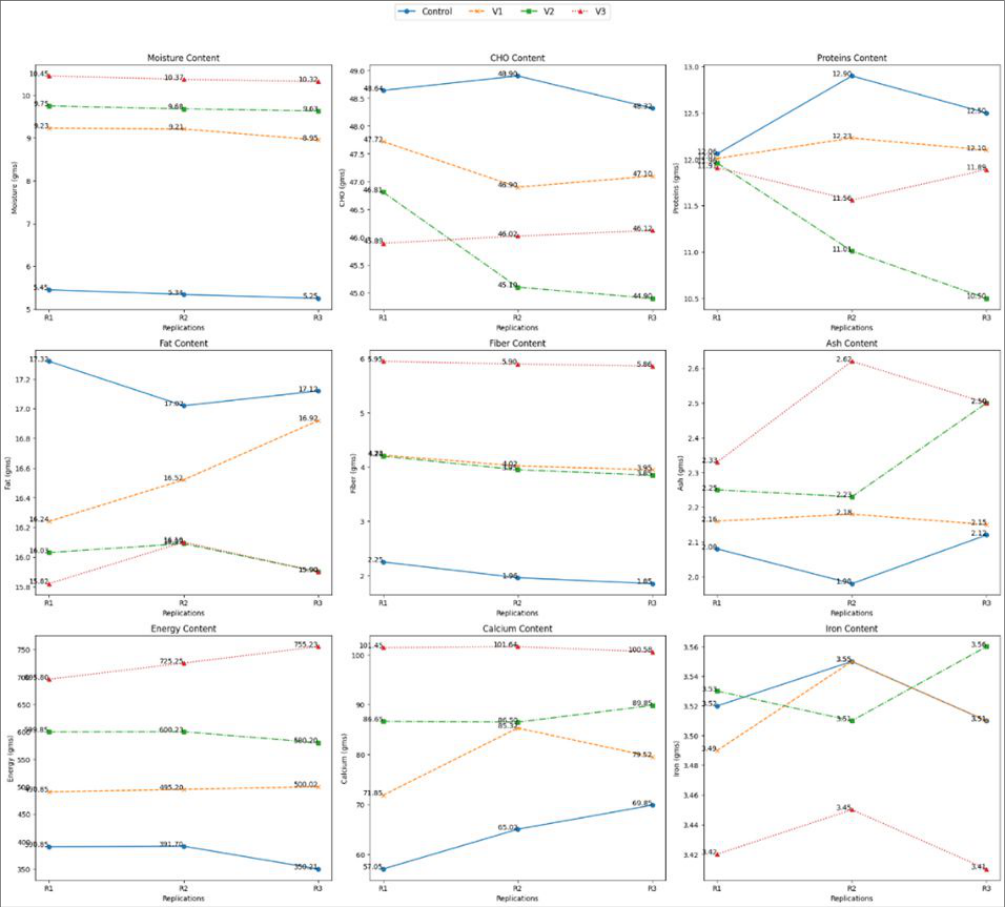 Figure 2
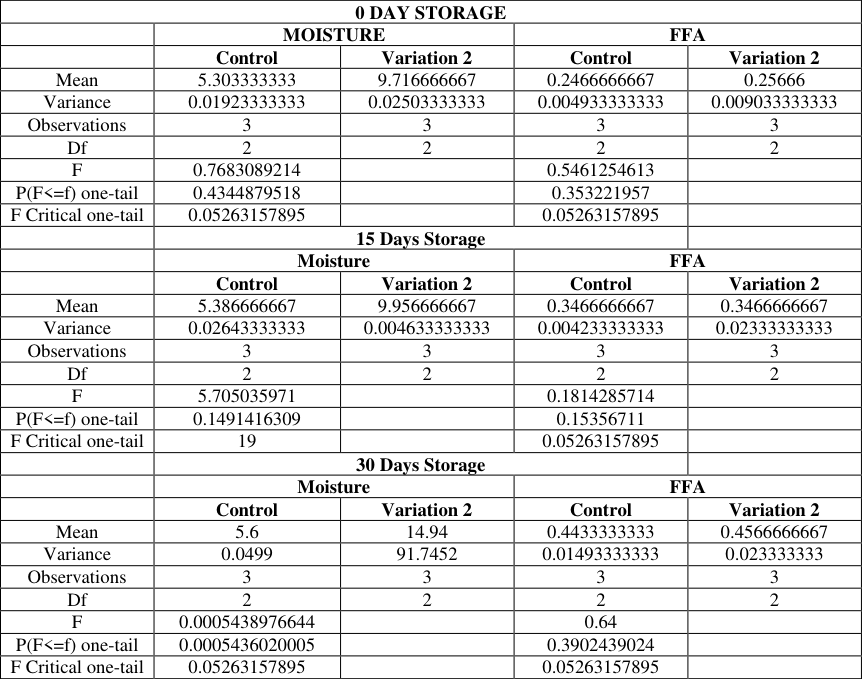 Table 5
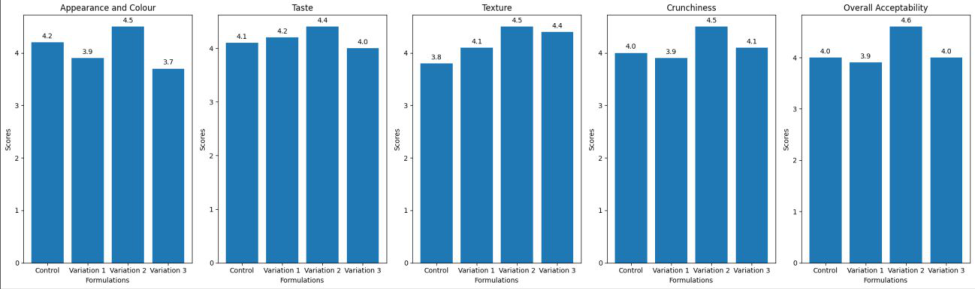 Figure 3
Introduction
The global trend towards healthier dietary is inspiring new concepts in the functional food sector, particularly in replacing conventional snacks that generally contain minimal nutrients. An ideal case is the popular biscuit, which normally contains much refined wheat flour and sugars. This combination gives rise to what is popularly referred to as "empty calories" and is attributed to an increased chance of medical issues such as obesity and type 2 diabetes (Goubgou et al., 2021) [13] . This non-nutritious content, as well as an increasing number of people with metabolic disorders and celiac disease, indicate a huge demand for food types that are healthy and also popular among the masses (Patil et al., 2023) [18] . An encouraging solution is the application of nutrient-rich, gluten-free types of flour from less popular plants. Barnyard millet (Echinochloa frumentacea), a hardy ancient cereal, is rich in dietary fiber and valuable minerals such as iron and calcium. It is also rich in glycemic index (GI) that keeps glucose levels stable in the body (Nani & Krishnaswamy, 2021) [17] . Makhana (Euryale ferox) is rich in protein, low in fat, with good minerals and low glycemic index (GI) and hence is a desirable option for healthy food (Ekal & Kumbamoorthy, 2024) [7] . It can be able to combine such ingredients and create a product better than ordinary gluten-free biscuits, typically prepared from weak rice or corn flour. Altering the formula of biscuits from barnyard millet and makhana benefits the health of the people in two ways: it enriches nutrition with slow-carb release, rich in fibres and beneficial vitamins and minerals, and it promotes sustainable agriculture with drought-resistant crop with poor soil adaptability (Goubgou et al., 2021; Maharajan et al., 2024) [13,15] . Altering the recipe, however, is not merely an exercise in nutrition; it must also solve major technical and taste problems. Without the gluten, the valuable component of wheat, the product ends up with poor texture and poor mouthfeel. So, it is crucial to balance the quantities of such substitute flours with care and prepare a product as delicious as it is nutritious (Ravi & Rana, 2024) [21] . This necessitates an examination of the behavior of the dough and the characteristics and chemistry of the final product with a careful consideration of the effect of the mixed flours, including spread ratio, physical and chemical characteristics, protein content and dietary fiber (Singh et al., 2023) [16] . Though we are aware that makhana and barnyard millet are beneficial, their combined usage in bakery products such as biscuits is not deeply studied. At the moment, there is an increasing demand for millet-based products such as multi-millet biscuits and gluten-free cookies, and people are increasingly consuming them (Porwal et al., 2023; Ravi & Rana, 2024) [19,21] . This study follows through on that trend by devising a new product formulation using barnyard and makhana flour and to evaluate the use of these flours at different concentration levels in the fortified biscuits.
Materials and Methods
Materials and Methods
Raw Material Procurement and Biscuit Formulation
Organic barnyard millet, sorghum, makhana and whole wheat flours were procured from organic stores of Guntur. Refined sugar, unsalted butter, baking powder and baking soda were purchased from local market of Guntur. Four biscuit variants were formulated as Control and three variations (V1, V2, V3) with progressive substitution of barnyard millet flour with makhana and sorghum flours (Table 1).
| Ingredient | Control | Variation 1 | Variation 2 | Variation 3 |
|---|---|---|---|---|
| Barnyard millet flour (gm) | 50 | 20 | 15 | 10 |
| Sorghum flour (gm) | 0 | 20 | 15 | 10 |
| Makhana flour (gm) | 0 | 10 | 20 | 30 |
| Wheat flour (gm) | 20 | 20 | 20 | 20 |
| Sugar (gm) | 13 | 13 | 13 | 13 |
| Butter | 15 | 15 | 15 | 15 |
| Baking soda | 1 | 1 | 1 | 1 |
| Baking powder | 1 | 1 | 1 | 1 |
Table text extracted from the original PDF; superscript letters are shown inline. The original table image is below.
View original table image
Preparation of Fortified Biscuits
Fortified biscuits were prepared by the method adapted from with the slight modifications. Butter and sugar were creamed to a light, fluffy consistency. The composite flours and leavening agents were sieved together (60-mesh) and gradually incorporated into the creamed mixture. The dough was kneaded, rested for 15 minutes at 4°C, sheeted to a 5 mm thickness and cut into uniform shapes. The biscuits were baked at 170°C for 20 minutes in a preheated oven, cooled to ambient temperature and packaged in HDPE pouches for subsequent analysis.
Physical and Chemical Analysis Physical Parameters Diameter
The diameter of the biscuits was measured using the AACC (2000). Six biscuits were placed edge to edge, and their total diameter was measured in millimeters using vernier callipers. This procedure was repeated to obtain an average value and the results were reported in centimeters (cm).
Thickness
The thickness of biscuits was measured using the AACC (2000) method. Six biscuits were stacked on top of one another, and the total height was measured in millimetres using vernier callipers. This procedure was repeated to obtain an average value, and the results were reported in centimetres
Spread ratio
The spread ratio was determined by measuring the diameter (D) and thickness (T) of six biscuits from each variant using a vernier callipers. The spread factor (SF) was calculated as SF = (D/T) × CF × 10 where CF is the correction factor (0.1).
Proximate Composition
The fortified biscuits were analysed for moisture contents, ash content, crude fat, crude protein, crude fibre and total carbohydrates contents using the standard AOAC (2000) methods. The energy content was estimated using the Atwater general conversion factors as described by Ahmed et al., (2022) [2] . Minerals like calcium and iron were analysed by using AOAC (2005) and AOAC (1998) respectively.
Sensory Evaluation
The organoleptic acceptability of the biscuit variants was evaluated by a panel of 30 untrained judges using a 5-point hedonic scale (1 = dislike extremely to 5 = like extremely) as described by Rohith et al., (2020) [22] . Attributes evaluated included appearance, flavour, texture, taste and overall acceptability. Samples were presented randomly under controlled lighting conditions.
Shelf-Life Study
The most acceptable variant from sensory analysis was selected for a 30-day shelf-life study. Biscuits were stored in HDPE pouches at ambient conditions. Analyses were conducted at 0, 15 and 30 days for free fatty acids (FFA) and sensory attributes by the methods described by Fatemeh et al., (1999) [11] .
Statistical Analysis
All analyses were performed in triplicate. Data were subjected to one-way analysis of variance (ANOVA) and mean differences were compared using Duncan's Multiple Range Test (DMRT) at a 5% significance level (p < 0.05) using SPSS software (version 16.0).
Results and Discussion
International Journal of Agriculture and Food Science https://www.agriculturaljournals.com Biscuits fortified with barnyard millet and makhana flour as partial substitutes for wheat flour were tried in the formulation. The results are systematically presented and discussed.
Physical Properties:
The physical characteristics, diameter, thickness and weight of the control (100% wheat) and three variations (V1, V2, V3 with increasing barnyard millet and makhana flour) were assessed to understand the impact of fortification on biscuit structure. The results, analyzed via One-Way ANOVA, are summarized in Table 2. Variations V1, V2 and V3 showed statistically significant differences (p < 0.05) in diameter, indicating that fortification altered the spread ratio during baking. This is visually supported by Figure 1, which shows a pronounced increase in post-baking diameter for V1 and V2. The high Fvalues suggest strong variation, likely due to differences in water absorption and gluten dilution affecting dough viscosity and spread. These results were consistent with previous studies where incorporation of non-wheat flours reduced dough elasticity and altered spread behavior (Singh et al., 2020) [18] . For thickness, V1 and V3 exhibited significant changes, while V2 did not differ significantly from the control. This indicates that the specific flour blend in V2 maintained a structural height comparable to wheat flour, potentially due to a balanced protein-starch matrix.
The control sample also showed a significant difference, underscoring the sensitivity of biscuit height to minor recipe alterations. The post-baking thickness increase was most substantial in V1 in Figure 1, correlating with its highest Fvalue (305.86). Weight was significantly affected in the control, V1, and V3, but not in V2. This aligns with the thickness data, suggesting V2's composition resulted in a product with physical properties (mass and height) most similar to the conventional biscuit, a crucial factor for consumer acceptance and production standardization.
Chemical Composition and Nutritional Enhancement
The proximate composition revealed a substantial nutritional improvement with fortification in Table 3. A progressive decline in moisture content from control (10.98%) to V3 (8.71%) was observed, which can enhance shelf stability. Carbohydrate content decreased inversely with the level of substitution (52.24% in control to 35.34% in V3). [14,25] , who demonstrated that composite flours enhance protein, fiber, and mineral contents in bakery products. The consistency of these trends across replications is visually confirmed in the line plots in Figure 2. One-Way ANOVA confirmed that all chemical parameters differed significantly (p < 0.05) among the formulations in Table 4, with exceptionally high F-values for moisture (F=1435.96), fiber (F=311.65), and energy (F=163.64). This statistical validation confirms that fortification significantly and positively altered the nutritional matrix of the biscuits.
| Component | F-value | P-value | F-critical | Significant (P < 0.05) |
|---|---|---|---|---|
| Moisture | 1435.9578 | 0 | 4.0662 | Yes |
| CHO | 16.0385 | 0.00096 | 4.0662 | Yes |
| Proteins | 4.9162 | 0.03188 | 4.0662 | Yes |
| Fat | 22.5049 | 0.0003 | 4.0662 | Yes |
| Fiber | 311.6467 | 0 | 4.0662 | Yes |
| Ash | 8.4102 | 0.00743 | 4.0662 | Yes |
| Energy | 163.6368 | 0 | 4.0662 | Yes |
| Calcium | 32.0892 | 0.00008 | 4.0662 | Yes |
| Iron | 12.2877 | 0.0023 | 4.0662 | Yes |
Table text extracted from the original PDF; superscript letters are shown inline. The original table image is below.
View original table image
Organoleptic Acceptance
Sensory evaluation in Figure 3 revealed that Variation 2 (V2) was the most preferred formulation. It scored highest in appearance & colour (4.5/5), taste (4.4/5), texture (4.5/5), crunchiness (4.5/5) and overall acceptability (4.6/5). This suggests that the specific flour ratio in V2 achieved an optimal balance, enhancing nutritional value without compromising sensory properties. The control sample performed moderately, while V3, despite its superior nutritional profile, received lower scores, likely due to a more pronounced earthy taste and denser texture from the highest level of fortification. Similar findings were observed by Devi et al. (2019) [6] , who noted that 20-30% substitution with non-wheat flours like legume flour and millet flour maintained desirable sensory characteristics in biscuits. Based on sensory results, V2 was selected for a 30-day shelf-life study against the control, monitoring moisture and free fatty acids (FFA) as indicators of staling and rancidity in Table 5. While V2 initially had higher moisture, the difference was not statistically significant (p > 0.05) until day 30, when its moisture content rose sharply to 14.94% compared to the control's 5.6% (p < 0.05). This indicates a higher hygroscopicity of the fortified flour blend, which could affect crispness over extended storage. Conversely, FFA levels increased gradually in both samples but showed no statistically significant difference (p > 0.05) at any interval. This indicates that V2 was not more susceptible to hydrolytic rancidity than the control wheat biscuit over the one-month time interval. These results are consistent with Gajera et al. (2020) [5] , who reported that millet-based
| 0 DAY STORAGE | — | — | — | — |
|---|---|---|---|---|
| MOISTURE | FFA | |||
| Control | Variation 2 | Control | Variation 2 | |
| Mean | 5.303333333 | 9.716666667 | 0.2466666667 | 0.25666 |
| Variance | 0.01923333333 | 0.02503333333 | 0.004933333333 | 0.009033333333 |
| Observations | 3 | 3 | 3 | 3 |
| Df | 2 | 2 | 2 | 2 |
| F | 0.7683089214 | 0.5461254613 | ||
| P(F<=f) one-tail | 0.4344879518 | 0.353221957 | ||
| F Critical one-tail | 0.05263157895 | 0.05263157895 | ||
| 15 Days Storage | ||||
| Moisture | FFA | |||
| Control | Variation 2 | Control | Variation 2 | |
| Mean | 5.386666667 | 9.956666667 | 0.3466666667 | 0.3466666667 |
| Variance | 0.02643333333 | 0.004633333333 | 0.004233333333 | 0.02333333333 |
| Observations | 3 | 3 | 3 | 3 |
| Df | 2 | 2 | 2 | 2 |
| F | 5.705035971 | 0.1814285714 | ||
| P(F<=f) one-tail | 0.1491416309 | 0.15356711 | ||
| F Critical one-tail | 19 | 0.05263157895 | ||
| 30 Days Storage | ||||
| Moisture | FFA | |||
| Control | Variation 2 | Control | Variation 2 | |
| Mean | 5.6 | 14.94 | 0.4433333333 | 0.4566666667 |
| Variance | 0.0499 | 91.7452 | 0.01493333333 | 0.023333333 |
| Observations | 3 | 3 | 3 | 3 |
| Df | 2 | 2 | 2 | 2 |
| F | 0.0005438976644 | 0.64 | ||
| P(F<=f) one-tail | 0.0005436020005 | 0.3902439024 | ||
| F Critical one-tail | 0.05263157895 | 0.05263157895 |
Table text extracted from the original PDF; superscript letters are shown inline. The original table image is below.
View original table image
International Journal of Agriculture and Food Science https://www.agriculturaljournals.com biscuits maintain acceptable oxidative quality when stored under ambient conditions. Results indicate that barnyard millet and makhana flour are functional constituents with potential for enriching biscuits. V2 was the most efficacious formulation that was successful in improving protein, fat, and mineral enrichment along with physical characteristics and sensory scores comparable to the control product.
Overall acceptability was the best of all samples. Even though there was higher moisture uptake in the case of V2 over a span of 30 days, stability against rancidity was comparable with the control. This suggests that with appropriate moisture-proof packaging, there is potential for retaining quality for at least one month in the case of V2 biscuits. Thus, V2 is a potential, nutrient-rich functional food with huge consumer acceptance.
Conclusion
Fortification with barnyard millet and makhana significantly enhanced the nutritional and qualitative value of biscuits. Protein increased from 9.55 percent in the control biscuits to 16.49 percent in V3 and fat content increased to 24.49 percent, increasing the energy to 396.53 kcal/100 g. Minerals were enhanced with calcium up to 147.98 mg and iron up to 4.38 mg, indicating that the composite flours are rich in their nutrient profile. The taste panel ranked V2 as the best choice with an overall score of 4.6 while maintaining a desirable texture and flavor. Shelf-life studies indicated that although the fortified biscuits absorbed higher moisture at 14.94 percent after 30 days, the biscuits did not become rancid and the free fatty acids remained around 0.46. These outcomes confirm that barnyard millet and makhana are potential materials for manufacturing glutenfree biscuits with extensive nutrition, attractiveness, and storable for a short period.
References
25 in the original paper- AACC. Approved methods of the American Association of Cereal Chemists. St. Paul (MN): American Association of Cereal Chemists; 2000.
- Ahmed T, Sarwar N, Rahman N, Kauser-Ul-Alam M. Formulation, development and quality evaluation of a fortified biscuit with antidiabetic potential. Int J Nutr Sci. 2022;7(1):41-49.
- AOAC. Official methods of analysis of AOAC International. 12th ed. Washington (DC): Association of Official Analytical Chemists; 2000.
- AOAC. Official methods of analysis of AOAC International. 18th ed. Arlington (VA): Association of Official Analytical Chemists; 2005. Method 923.03.
- AOAC. Official methods of analysis. 16th ed. Washington (DC): Association of Official Analytical Chemists; 1998.
- Devi A, Khatkar BS, Sharma S. Influence of partial replacement of wheat flour with legume and millet flours on biscuit quality. Int J Food Stud. 2019;8(2):139-148.
- Ekal V, Kumbamoorthy S. Formulation and proximate analysis of makhana-enriched laddoos. Int J Nutr Pharmacol Neurol Dis. 2024;14(2):205-212.
- Elavarasan K, Malini M, Ninan G, Ravishankar CN, Dayakar B. Millet flour as a potential ingredient in fish sausage for health and sustainability. Sustain Food Technol. 2024;2(4):1088-1100.
- Elkatry HO, Almubarak SM, Mohamed HM, Ramadan KMA, Abdelrahman AM. Potential of using bisr date powder as a novel ingredient in biscuits made of wheat flour only or mixed with barley. Foods. 2024;13(12):1940.
- Eyenga EF, Mouafo HT, Achu MB, Mbacham WF, Ndindeng SA. Optimization of the formulation of rice biscuits supplemented with Dacryodes edulis powder using response surface methodology. Int J Food Sci. 2021;2021:1-12.
- Fatemeh S, Mahmoud A, Parisa P. Shelf-life assessment of protein-rich biscuits: Evaluation techniques and preservation approaches. Food Chem. 2019;289:512-520.
- Gajera HP, Patel RH, Dabhi BK. Shelf life and oxidative stability of value-added biscuits made with millet and legume flour blends. Food Res Int. 2020;132:109086.
- Goubgou M, Songre-Ouattara LT, Bationo F, Sawadogo-Lingani H, Traoré Y, Savadogo A. Biscuits: A systematic review and meta-analysis of improving the nutritional quality and health benefits. Food Prod Process Nutr. 2021;3(1):26.
- Kumar N, Gupta P, Sharma P. Nutritional evaluation of multigrain biscuits developed from millet and legume flours. Int J Food Sci Nutr. 2019;4(2):45-50.
- Maharajan T, Krishna TPA, Krishnakumar TV, Vetriventhan M, Kudapa H, Ceasar SA. Role of genome sequences of major and minor millets in strengthening food and nutritional security for future generations. Agriculture. 2024;14(5):670.
- Murya RK, Kumar D, Verma VK, Singh D. Studies on textural and sensory quality attributes of biscuits using wheat, sorghum and groundnut blend flour. Food Sci Res J. 2020;11(2):151-157.
- Nani M, Krishnaswamy K. Physical and functional properties of ancient grains and flours and their potential contribution to sustainable food processing. Int J Food Prop. 2021;24(1):1529-1547.
- Patil P, Singh S, Patel P. Functional properties and health benefits of finger millet (Eleusine coracana L.): A review. J Phytopharmacol. 2023;12(3):196-202.
- Porwal A, Bhagwat G, Sawarkar J, Kamble P, Rode M. Overview of millets as nutri-cereals: Nutritional profile, health benefits and sustainable cultivation approach. Int J Sci Res Arch. 2023;10(1):841-859.
- Ramezanzadeh FM, Rao RM, Prinyawiwatkul W, Marshall WE, Windhauser M. Effects of microwave heat, packaging and storage temperature on fatty acid and proximate compositions in rice bran. J Agric Food Chem. 1999;48(2):464-467.
- Ravi J, Rana SS. Maximizing the nutritional benefits and prolonging the shelf life of millets through effective processing techniques: A review. ACS Omega. 2024;9(37):38327-38347.
- Rohith MK, Srinivasan S, Megha R. Sensory evaluation of functional and fortified biscuits: Methods and approaches. J Food Sci Technol. 2020;57(4):11231132.
- Singh R, Singh RK, Singh P, Singh OP. Climate smart foods: Nutritional composition and health benefits of millets. Int J Environ Clim Change. 2023;13(11):11121122.
- Singh S, Devi R, Kaur M. Effect of composite flour blends on physical and textural properties of biscuits. J Food Sci Technol. 2020;57(3):1121-1128.
- Thilagavathi T, Saravanan S, Anitha L. Development and quality evaluation of barnyard millet incorporated baked snacks. J Food Process Preserv. 2021;45(6):e15509.