
Research article · 2025 · Full text
International Journal of Agriculture and Food SciencePreparation of food grade glycerol using fuzzy mathematics combined with response surface methodology
Volume 7(5) · Pages 47–54 · DOI: 10.33545/2664844x.2025.v7.i5a.379 ↗
Research areasPolysaccharides Composition and ApplicationsFood Chemistry and Fat AnalysisFood composition and properties
Abstract
Author-writtenAs a food additive, glycerol exhibits moisture-retaining and water-preserving properties, making it widely applicable in the food industry. This study utilized 72% crude glycerol, with adsorbent ratio (A), decolorizer dosage (B), and decolorization temperature (C) as single factors. The purification process was optimized through fuzzy mathematics coupled with response surface methodology (RSM), followed by reproducibility validation. The optimal purification parameters were determined as follows: an adsorbent ratio of 1.5:1, a decolorizer dosage of 1.0%, and a decolorization temperature of 80°C. Under these conditions, the predicted glycerol content reached 99.36%, while experimental results from repeated trials showed (99.55±0.07)%, demonstrating minimal deviation from the predicted value and confirming the reliability of the fuzzy mathematics-RSM model. The refined glycerol exhibited a light yellow color, pure aroma, and high purity without residual impurities, meeting food-grade specifications. These findings provide a technical foundation for industrial-scale production of food-grade glycerol.
Summary
Source-checkedPlain-language reading of the full paper, prepared with AI and checked against the text. Each point links to the authors' own words.
Why it matters
- Glycerol is widely used in the food industry as a food additive due to its ability to retain and preserve moisture. View evidence ↗
- In food applications, glycerol serves as a humectant and preservative, enhancing nutrition and providing a refreshing sensation. View evidence ↗
- There is currently limited domestic and international research regarding the purification of crude glycerol specifically for food industry applications. View evidence ↗
The question
- The study aimed to identify an optimized refining process to increase the concentration of crude glycerol using ion exchange, decolorizing agents, and self-made adsorbents. View evidence ↗
What they did
- The researchers used crude glycerol with 72% purity and tested three single factors: decolorization temperature, decolorizer dosage, and adsorbent ratio. View evidence ↗
- The purification process was optimized using a combination of response surface methodology (RSM) and fuzzy mathematics, with subsequent validation for reproducibility. View evidence ↗
- A panel of 10 healthy non-smoking and non-drinking experts aged 20-45 evaluated the glycerol samples based on viscosity, transparency, odor, and color. View evidence ↗
What they found
- A decolorant dosage of 1.0% was identified as optimal, providing improved filtration performance and a pale yellow effluent. View evidence ↗
- Based on filtration efficiency and glycerol content, the optimal decolorization temperature was determined to be 80°C. View evidence ↗
- The regression model showed strong predictive capability and excellent goodness-of-fit, with an R² of 0.9927 and an Radj² of 0.9833. View evidence ↗
- Using the optimal parameters (1.5:1 adsorbent ratio, 1.0% decolorizer dosage, and 80°C temperature), the experimental glycerol content was (99.55±0.07)%, close to the predicted 99.36%. View evidence ↗
- The purification process increased the glycerol content from 72% in the crude glycerol to 99.8% in the refined glycerol. View evidence ↗
- The purified glycerol's physicochemical properties were found to comply with the GB 29950-2013 National Food Safety Standard. View evidence ↗
What it means
- The authors conclude that the refined glycerol meets all food-grade specifications and has broad application prospects due to its excellent moisturizing and water-retention properties. View evidence ↗
Visual summary
3 visualsIllustrations explain the paper; charts are replotted from the paper's own table values.
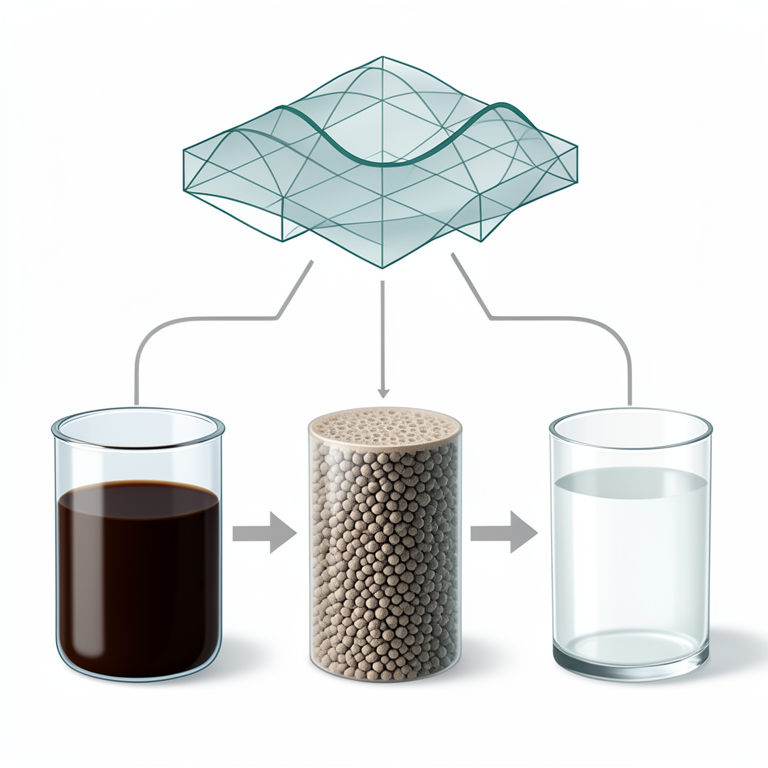
Purification Optimization Workflow
AI-generated conceptual illustration (crude glycerol liquid and purification equipment). It explains the idea and does not show study data.
View source evidence ↗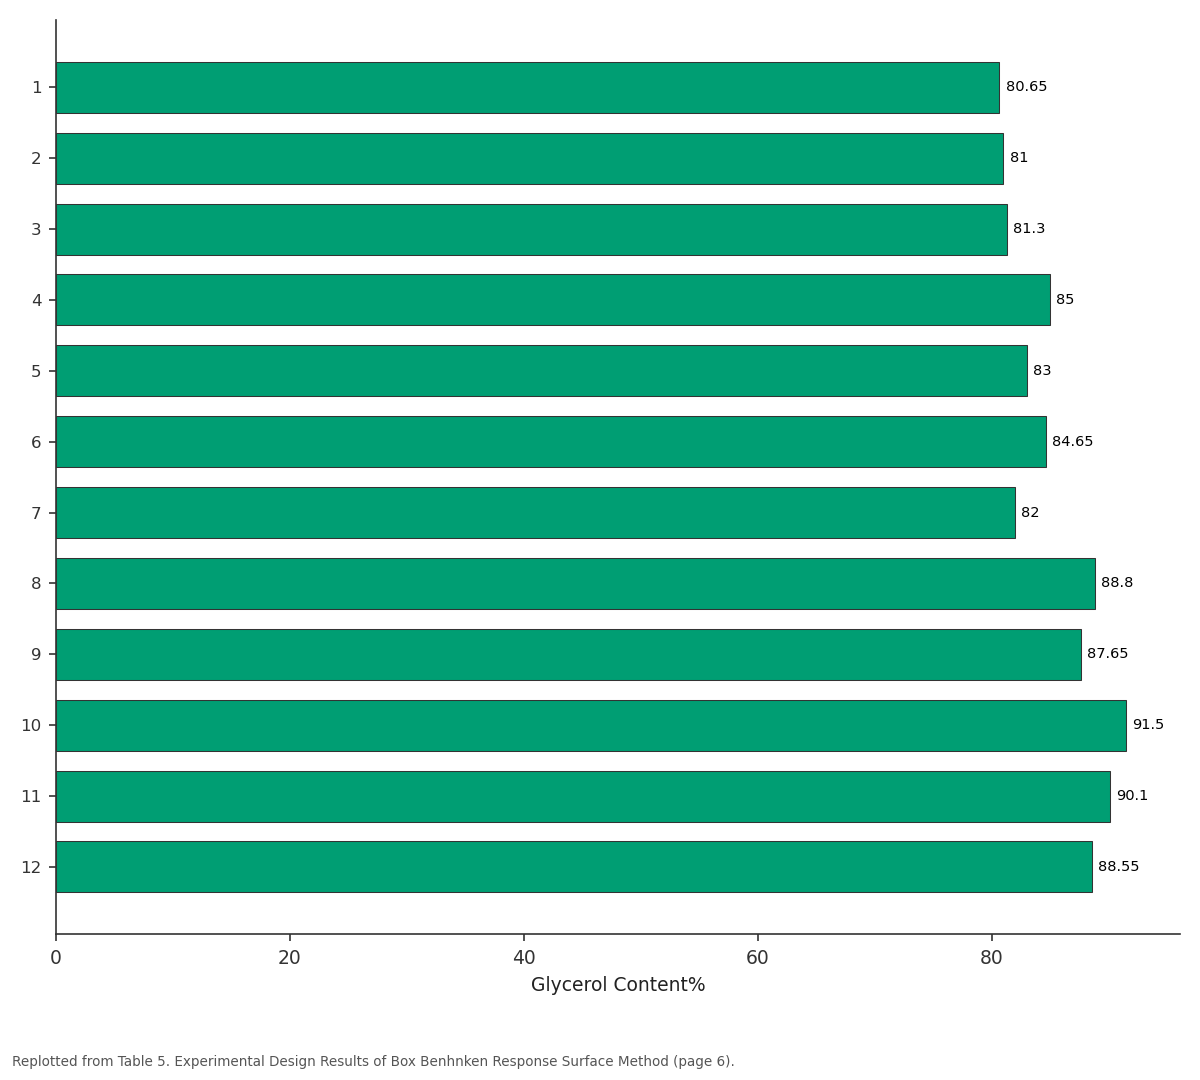
Glycerol Content%: 1 vs 2 vs 3 vs 4 vs 5
Replotted from Table 5 (page 6) of the original paper. Every bar is the paper's own table value.
View source evidence ↗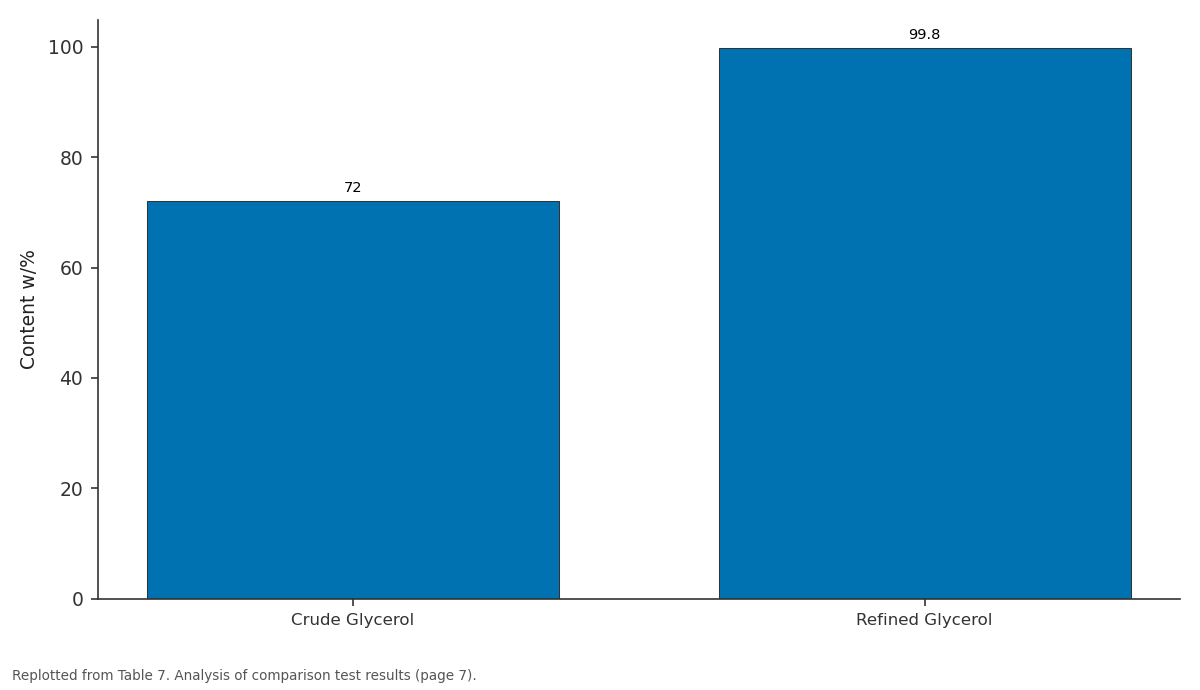
Content w/%: Crude Glycerol vs Refined Glycerol
Replotted from Table 7 (page 7) of the original paper. Every bar is the paper's own table value.
View source evidence ↗Figures & tables
From the original paper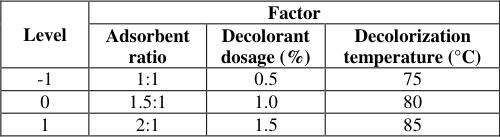 Table 1
 Table 2
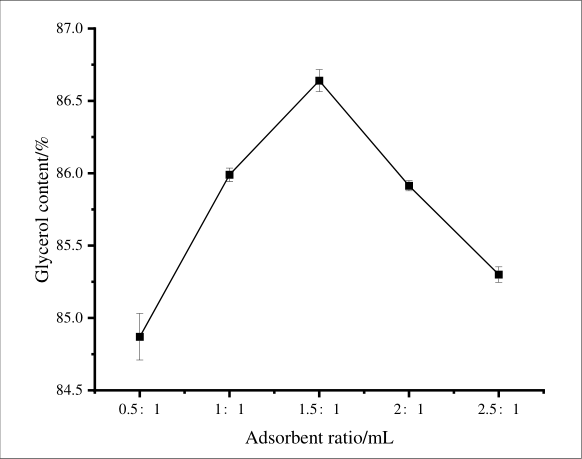 Figure 1
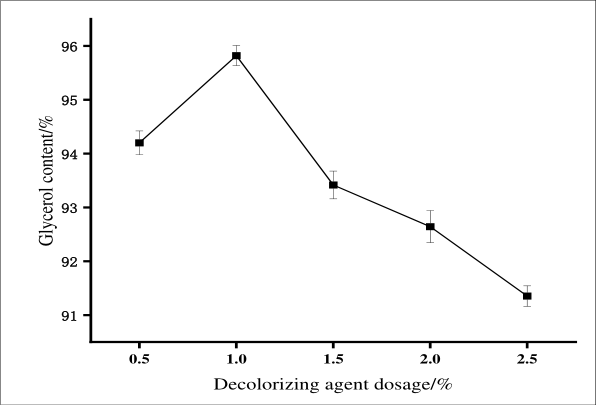 Figure 2
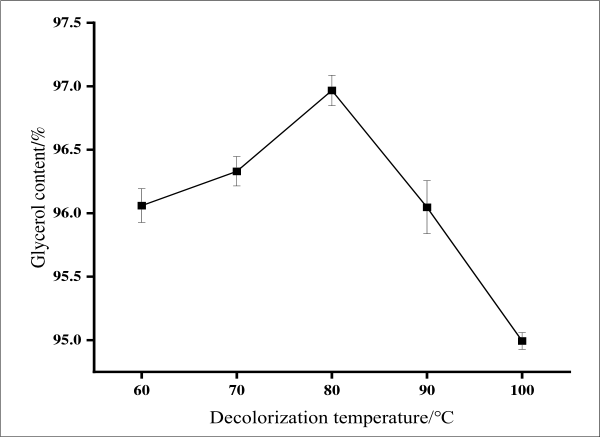 Figure 3
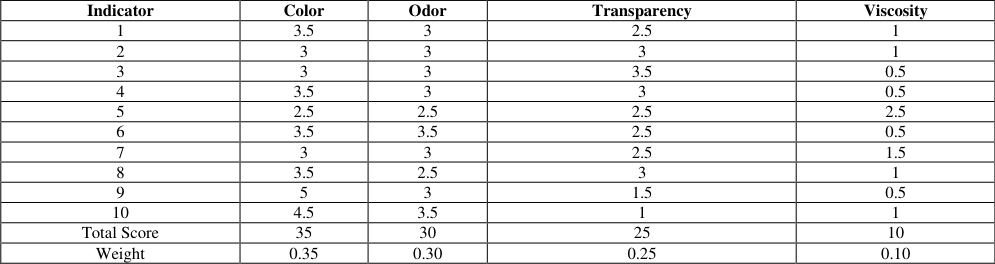 Table 3
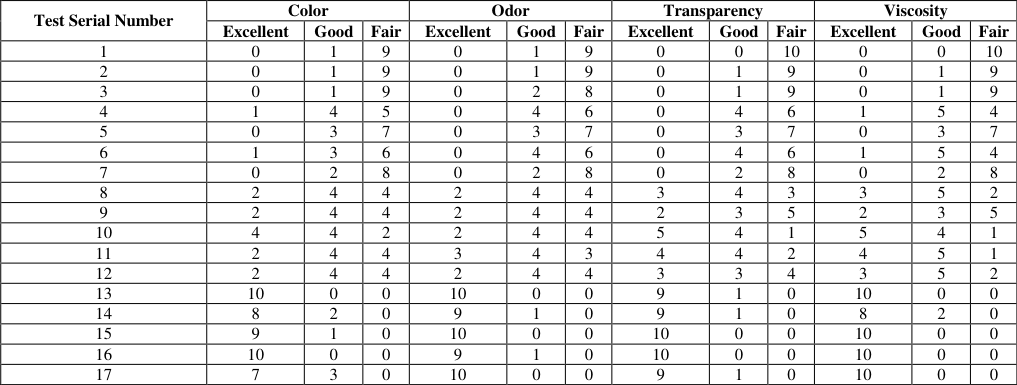 Table 4
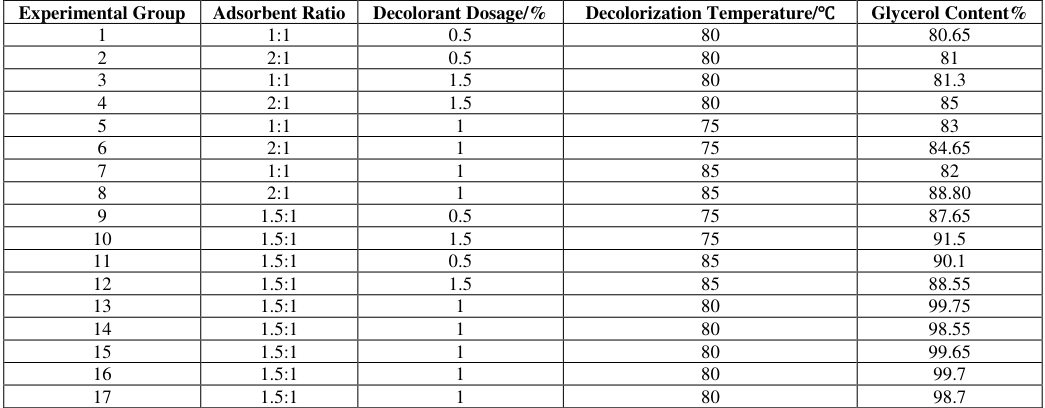 Table 5
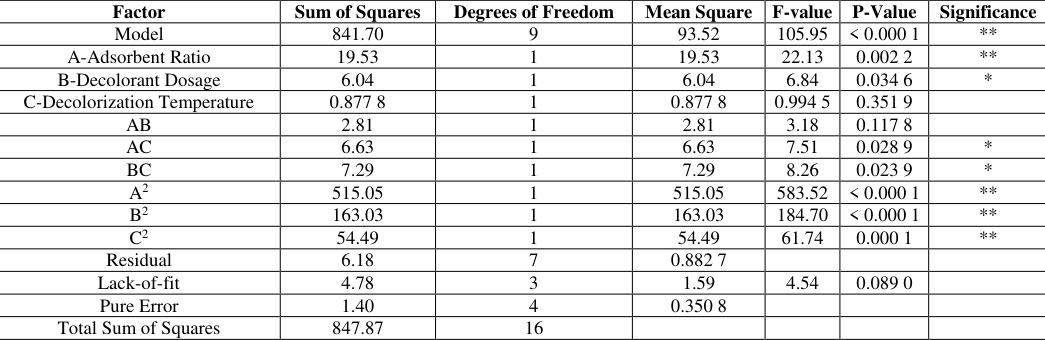 Table 6
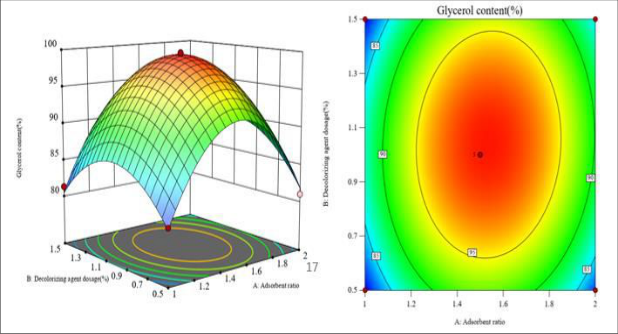 Figure 4
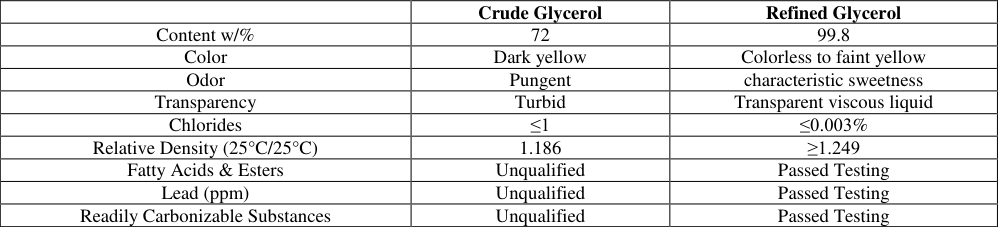 Table 7
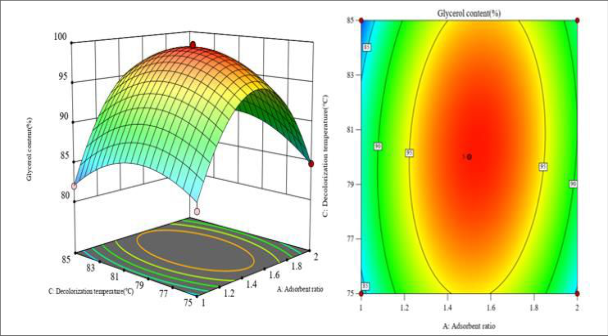 Figure 5
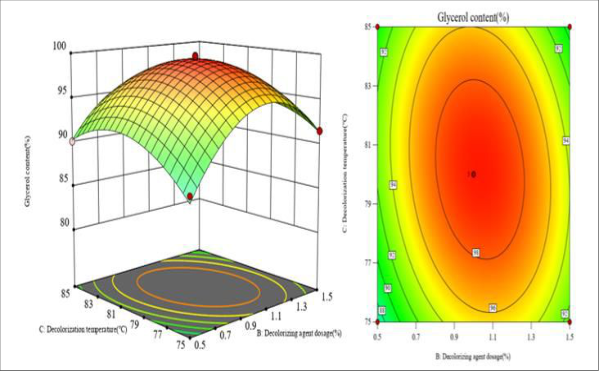 Figure 6
Introduction
Food-grade glycerol is a non-toxic and safe substance with extensive applications in the food industry, and its uses continue to expand and diversify. Glycerol is commonly used in the food industry as a preservative and humectant, serving functions such as preservation and nutritional enhancement, while also providing a refreshing sensation. Food-grade glycerin contains various nutritional components, such as unsaturated fatty acids and amino acids, making it suitable for use as a food flavoring agent. Common purification processes for glycerol include vacuum distillation3 and ion exchange4. The ion exchange resin method can achieve purification and decolorization through ion exchange. This study identified an optimized refining process for crude glycerol using selfmade adsorbents, ion exchange, and decolorizing agents to enhance glycerol concentration. This method helps conserve energy, reduce costs and losses, prevent thermal degradation of glycerol, and improve its purity. Current research on the application of crude glycerol purification processes in the food industry remains limited, both domestically and internationally. Currently, fuzzy mathematics is widely applied in the food industry. Response surface methodology (RSM) optimizes single-factor conditions by analyzing functional relationships in regression equations to determine optimal process parameters, with notable applications in yogurt research [8] . The combined use of fuzzy mathematics and RSM has been extensively adopted. For instance, Zhang et al. employed this approach to optimize the fermentation process of physalis polysaccharide yogurt, [9] while Zhu et al. integrated fuzzy comprehensive evaluation with RSM to enhance the fermentation process and antioxidant properties of Astragalus-Codonopsis health rice wine [10] . However, few studies have reported on purifying food-grade glycerol using fuzzy mathematics coupled with RSM for flavoring applications.
Materials and Methods
Materials and Methods
Materials
Crude glycerol (72% purity), Qingdao Jinniu Oils & Fats Technology Co., Ltd.; Macroporous strongly basic styrene anion exchange resin (Type D201); Strongly acidic cation exchange resin (Type 732); Column chromatography silica gel; zeolite, activated carbon; rice husk carbon; quartz sand; anhydrous ethanol (95%); sodium chloride (NaCl).
Experimental Equipment
Electronic analytical balance (BP221S), Sartorius, Beijing; vacuum drying oven, Tianjin TEST Instruments; induction cooker, SUPOR, Zhejiang; UV-Vis spectrophotometer (754N), Gaomi, Shandong; chromatography column (35 mm × 40 cm), Ruida Henghui Co., Ltd., Beijing; peristaltic pump, Longer Precision Pump Co., Ltd., Baoding; constanttemperature water bath, Gongyi Yuhua Instrument Co., Ltd.; high-performance liquid chromatography (HPLC) system, Germany.
Crude Glycerol Refining Process Route
Crude Glycerol → Adsorbent treatment → Filtration → Anion/ cation exchange resin Filtration → Decolorization → Filtration → Moisture evaporation → Final product.
Key Operational Points 1. Preparation of adsorbent:
The zeolite is first crushed, then subjected to acid treatment, washed with water until neutral pH is achieved, and subsequently calcined and dehydrated in a muffle furnace at approximately 300℃.
After being ground again and sieved through a 200-mesh screen, the activated zeolite is mixed with silica gel in varying proportions to prepare the adsorbent for use.
Adsorption:
The adsorbents with different ratios were sequentially packed into columns to adsorb impurities from crude glycerol, and the effluent was collected for further use.
Secondary resin adsorption:
The effluent was diluted and subsequently passed through cation-exchange and anion-exchange resin columns sequentially. The glycerol collected after secondary adsorption was reserved for use [11] . 4. Decolorizing Agent Preparation: The rice husk charcoal was washed, sun-dried, and pulverized into powder. After mixing with water, the slurry was sieved to remove impurities and large particles, then oven-dried to obtain Product A. An appropriate amount of quartz sand was stirred in acidic aqueous solution for cleaning and activation, then dried and sieved to obtain Product B. Products A, B and activated carbon were thoroughly mixed to prepare the decolorizing agent. 5. Decolorization: The effluent was decolorized under varying temperatures and dosages of decolorizing agent. The decolorized glycerol effluent was collected for further processing. 6. Drying: The decolorized glycerol effluent was subjected to moisture removal to obtain anhydrous glycerol product. 7. Quality Testing: The glycerol content was quantitatively analyzed12, with additional evaluations of odor, color index, transparency, and chloride content to verify compliance with food-grade specifications.
Single factor experiment Effect of adsorbent ratio on glycerol content
Using 100.0 g of crude glycerol under controlled conditions (decolorization temperature: 80 ℃; decolorizing agent dosage: 1.0%), the effects of different adsorbent ratios (silica gel: zeolite=0.5:1, 1:1, 1.5:1, 2:1, 2.5:1) on glycerol product quality were systematically evaluated to determine the optimal composition.
Effect of Decolorizing Agent Dosage on Glycerol Content
Using 100.0 g of glycerol feedstock after ion exchange, a decolorization temperature of 80 ℃, and an adsorbent ratio of 1.5:1, the effects of decolorant dosages (0.5%, 1.0%, 1.5%, 2.0% and 2.5%) on the color, filtration efficiency, and glycerol content of the final product were investigated to determine the optimal decolorant dosage.
Effect of decolorization temperature on glycerol content
Using 100.0 g of ion-exchanged glycerol feedstock, with a decolorant dosage of 1.0% and an adsorbent ratio of 1.5:1, the effects of decolorization temperature (60°C, 70°C, 80°C, 90°C, 100°C) on the color, filtration efficiency, and glycerol content of the final product were investigated to determine the optimal decolorization temperature.
Orthogonal Experimental Design
Based on the single-factor experimental results, three key factors adsorbent ratio (A), decolorant dosage (B), and decolorization temperature (C) were selected as independent variables, with glycerol content as the dependent variable. A three-factor, three-level response surface methodology (RSM) design was implemented using Design-Expert 13 software to determine the optimal process parameters for glycerol content. The specific factor levels are shown in the table below.
Fuzzy Mathematics Evaluation
A 10-member expert evaluation panel was assembled with the following requirements: panelists aged 20-45 years in good health, without smoking or drinking habits, were selected to assess glycerol samples for color, odor, transparency, and viscosity. The results were averaged, with evaluation criteria detailed in Table 2.
| Indicator | standard | — | — |
|---|---|---|---|
| Excellent (100 points) | Good (90 points) | Fair (80 points) | |
| Color | Colorless | Pale yellow | Dark yellow |
| Odor | Odorless with only the characteristic sweet note of glycerol | Slightly pungent odor | Pungent odor |
| Transparency | Clear and transparent, free from visible impurities | Fair transparency, free from macroscopically visible impurities | Poor transparency with noticeable particulate matter |
| Viscosity | Viscous | Moderately viscous, Aqueous sensation detected | Low viscosity, High water content |
Table text extracted from the original PDF; superscript letters are shown inline. The original table image is below.
View original table image
Determination of Evaluation Objects
The evaluation object set refers to the collection of glycerol samples to be evaluated, denoted as X=(X₁, X₂, X₃,..., X₁₇), where Xᵢ represents the comprehensive evaluation of the i-th glycerol sample (i=1, 2, 3, ..., 17) [13] .
Determination of Evaluation Factors
Taking the four sensory indicators of glycerol as factors, namely U={U1, U2,U3,U4), U1 represents the color of glycerol; U2 represents the odor of glycerol; U3 represents the transparency of glycerol; U4 represents the viscosity of glycerol.
Determination of Evaluation Grade Set
The evaluation panel assessed the glycerol samples and established the evaluation grade set as: V={Poor (v₁), Good (v₂), Excellent (v₃)}={80 points, 90 points, 100 points}
Determination of Evaluation Weights
The relative importance of each factor is termed as evaluation weight, where higher importance corresponds to greater weight. The weighting vector is denoted as K=(k₁, k₂, k₃, k₄) with the constraint ∑kᵢ=1.The weighting factors were determined as follows: Ten evaluators rated the importance of four glycerol attributes (color, odor, transparency, and viscosity). For each evaluator, the total score allocated to these four factors summed to 10 points. The weighting factor (kᵢ) for each attribute was calculated by dividing its aggregate score (across all evaluators) by the maximum possible total score (100 points) [14] .
Fuzzy Comprehensive Evaluation Set
The influencing factors of the samples were assessed by evaluators to obtain scores for each factor. The fuzzy relation matrix A was constructed by dividing the vote counts (for grades Excellent, Good, and Poor) by the total number of evaluators (10).The comprehensive evaluation result Y for each group is calculated as the product of the weighting matrix K and the fuzzy relation matrix A, expressed as:
Data Processing and Analysis
In the experiment, triplicate parallel trials were conducted for each test group, and the mean values were calculated. Data analysis was performed using Origin 2018, Excel, and Design-Expert 13 software. Statistical significance was defined as p<0.05 (significant) and p<0.01 (highly significant).
Results and Analysis Single-Factor Experimental Results
Results and Analysis Single-Factor Experimental Results
Effect of Adsorbent Ratio on Glycerol Content Fig 1:
The influence of adsorbent ratio on glycerol content Figure 1 demonstrates varying effects of adsorbent ratios on glycerol content, showing an initial increase followed by a decrease. At a 1:1 silica gel: zeolite ratio, the product exhibited darker coloration and poor adsorption efficiency.
Comprehensive evaluation determined the optimal adsorbent ratio as 1.5:1, where the effluent appeared pale yellow with maximal impurity removal and peak glycerol content. Based on these findings, ratios of 1:1, 1.5:1, and 2:1 were selected for subsequent response surface methodology experiments. As shown in Figure 2, varying decolorant dosages differentially impacted glycerol content, exhibiting an initial increase followed by a decrease. At 0.5% decolorant loading, the product demonstrated darker coloration and poor filtration efficiency. Comprehensive evaluation identified 1.0% as the optimal dosage, yielding pale yellow effluent with improved filtration performance. Based on these findings, decolorant dosages of 0.5%, 1.0%, and 1.5% were selected for subsequent response surface methodology (RSM) experiments.
Effect of decolorization temperature on glycerol content Fig 3: The effect of different decolorization temperatures on glycerol content
As shown in Figure 3, the decolorization temperature exerted a significant influence on glycerol content, demonstrating a distinct unimodal trend where glycerol concentration initially increased before decreasing with rising temperature. The reason is that an appropriate temperature can enhance the decolorization and adsorption efficiency of the decolorizing agent, improving the removal rate and adsorption capacity of the adsorbent.16. However, excessively high temperatures can cause sintering and carbonization, damaging the surface and pore structure of the adsorbent and degrading its adsorption performance. At decolorization temperatures of 60°C and 70°C, the filtration efficiency becomes significantly more challenging. Therefore, based on both glycerol content and filtration efficiency, the optimal decolorization temperature was determined to be 80℃. At this temperature, the product appeared colorless, filtration was relatively easy, and glycerol content remained high. Consequently, three optimal levels (75°C, 80°C and 85°C) were selected for response surface methodology experiments.
Establishment of a Fuzzy Mathematics Evaluation Model for Glycerol Determination of Evaluation Weights
The weighting results of glycerol-related factors are shown in the table below. The weight of each factor was obtained by dividing its individual score by the total score, resulting in the following distribution: color (0.35), odor (0.30), transparency (0.25), and viscosity (0.10). Among these, color and odor have higher weights, while transparency and viscosity have relatively lower weights.
Establishment and Results of the Fuzzy Matrix
The refined glycerol samples (17 groups) were evaluated by panelists. As shown in the table below, for Sample 1 under the color factor: the votes for "Excellent", "Good", and "Poor" were 0, 1, and 9 respectively. The fuzzy evaluation matrix for this sample was obtained by dividing the vote counts by the total number of evaluators [10] .
Box-Behnken Experimental Design and Results Analysis
In the sensory quality evaluation, the ratings for 'Excellent', 'Good', and 'Poor' were assigned scores of 100, 90, and 80 points respectively, forming the rank matrix R=(100, 90, 80). The fuzzy comprehensive score for Sample 1 was calculated as T₁=R×Y₁=(0, 0.065, 0.935)×(100, 90, 80)=80.65. The results for other samples are presented in Table 5.
| Experimental Group | Adsorbent Ratio | Decolorant Dosage/% | Decolorization Temperature/℃ | Glycerol Content% |
|---|---|---|---|---|
| 1 | 1:1 | 0.5 | 80 | 80.65 |
| 2 | 2:1 | 0.5 | 80 | 81 |
| 3 | 1:1 | 1.5 | 80 | 81.3 |
| 4 | 2:1 | 1.5 | 80 | 85 |
| 5 | 1:1 | 1 | 75 | 83 |
| 6 | 2:1 | 1 | 75 | 84.65 |
| 7 | 1:1 | 1 | 85 | 82 |
| 8 | 2:1 | 1 | 85 | 88.80 |
| 9 | 1.5:1 | 0.5 | 75 | 87.65 |
| 10 | 1.5:1 | 1.5 | 75 | 91.5 |
| 11 | 1.5:1 | 0.5 | 85 | 90.1 |
| 12 | 1.5:1 | 1.5 | 85 | 88.55 |
| 13 | 1.5:1 | 1 | 80 | 99.75 |
| 14 | 1.5:1 | 1 | 80 | 98.55 |
| 15 | 1.5:1 | 1 | 80 | 99.65 |
| 16 | 1.5:1 | 1 | 80 | 99.7 |
| 17 | 1.5:1 | 1 | 80 | 98.7 |
Table text extracted from the original PDF; superscript letters are shown inline. The original table image is below.
View original table image
(1)Establishment and Analysis of Quadratic Response Surface Regression Model
Using adsorbent ratio (A), decolorizing agent dosage (B), and decolorization temperature (C) as response surface factors with glycerol content as the response value (Y), the response results were analyzed and calculated using Origin-Expert 13 software to estimate glycerol content. After eliminating nonsignificant terms affecting the model, the following optimized quadratic response surface equation was obtained: Y(%)=99.27+1.56A+0.87B+0.33C+0.84AB+1.29AC-1.35BC-11.06A 2 -6.22B 2 -3.6C 2 (
)Validation Test Results
Analysis using Design-Expert 13 software determined the optimal glycerol refining parameters through the fitted regression equation: an adsorbent ratio of 1.54:1, a decolorizing agent dosage of 1.03%, and a decolorization temperature of 80.23°C, with a predicted glycerol content of 99.37%. For practical operational purposes, the process parameters were adjusted to an adsorbent ratio of 1.5:1, a decolorizing agent dosage of 1%, and a decolorization temperature of 80°C. Repeated experiments under these conditions yielded a glycerol content of 99.8%, showing no significant difference from the theoretical predicted value. This further confirms the accuracy of the regression model and validates the rationality of the response surface methodology design. The findings provide valuable guidance for selecting process parameters in future purification of food-grade refined glycerol.
( The results demonstrate that the physicochemical properties of purified glycerol comply with the GB 29950-2013 National Food Safety Standard. When the refined glycerol was incorporated into bread for testing its preservative and moisture-retention effects, the findings revealed that: (1) bread containing glycerol exhibited extended shelf life, (2) superior water retention capacity, and (3) improved sensory quality compared to controls.
Conclusion
This study employed fuzzy mathematics coupled with response surface methodology to predict glycerol content, ultimately determining the optimal process parameters as follows: adsorbent ratio (silica gel: zeolite)=1.5:1, decolorizing agent dosage=1.0%, and decolorization temperature=80 ℃. Under these conditions, the achieved glycerol content reached 99.8%, demonstrating minimal deviation from predicted values. The response surface methodology optimized glycerol refining protocol exhibits notable simplicity and high accuracy, while the derived regression equation effectively quantifies the influence magnitude of each factor on target indicators, thereby establishing a robust foundation for practical applications.
The refined glycerol meets all food-grade specifications, possessing excellent water-retention and moisturizing properties that promise broad application prospects.
Acknowledgement
AcknowledgmentsSupported by Natural Science Research Program for Ordinary Universities in Jiangsu Province (21KJA240004).
Figures and tables from the paper
| Level | Factor | — | — |
|---|---|---|---|
| Adsorbent ratio | Decolorant dosage (%) | Decolorization temperature (°C) | |
| -1 | 1:1 | 0.5 | 75 |
| 0 | 1.5:1 | 1.0 | 80 |
| 1 | 2:1 | 1.5 | 85 |
Table text extracted from the original PDF; superscript letters are shown inline. The original table image is below.
View original table image
| Indicator | Color | Odor | Transparency | Viscosity |
|---|---|---|---|---|
| 1 | 3.5 | 3 | 2.5 | 1 |
| 2 | 3 | 3 | 3 | 1 |
| 3 | 3 | 3 | 3.5 | 0.5 |
| 4 | 3.5 | 3 | 3 | 0.5 |
| 5 | 2.5 | 2.5 | 2.5 | 2.5 |
| 6 | 3.5 | 3.5 | 2.5 | 0.5 |
| 7 | 3 | 3 | 2.5 | 1.5 |
| 8 | 3.5 | 2.5 | 3 | 1 |
| 9 | 5 | 3 | 1.5 | 0.5 |
| 10 | 4.5 | 3.5 | 1 | 1 |
| Total Score | 35 | 30 | 25 | 10 |
| Weight | 0.35 | 0.30 | 0.25 | 0.10 |
Table text extracted from the original PDF; superscript letters are shown inline. The original table image is below.
View original table image
| Test Serial Number | Color | — | — | Odor | — | — | Transparency | — | — | Viscosity | — | — |
|---|---|---|---|---|---|---|---|---|---|---|---|---|
| Excellent | Good | Fair | Excellent | Good | Fair | Excellent | Good | Fair | Excellent | Good | Fair | |
| 1 | 0 | 1 | 9 | 0 | 1 | 9 | 0 | 0 | 10 | 0 | 0 | 10 |
| 2 | 0 | 1 | 9 | 0 | 1 | 9 | 0 | 1 | 9 | 0 | 1 | 9 |
| 3 | 0 | 1 | 9 | 0 | 2 | 8 | 0 | 1 | 9 | 0 | 1 | 9 |
| 4 | 1 | 4 | 5 | 0 | 4 | 6 | 0 | 4 | 6 | 1 | 5 | 4 |
| 5 | 0 | 3 | 7 | 0 | 3 | 7 | 0 | 3 | 7 | 0 | 3 | 7 |
| 6 | 1 | 3 | 6 | 0 | 4 | 6 | 0 | 4 | 6 | 1 | 5 | 4 |
| 7 | 0 | 2 | 8 | 0 | 2 | 8 | 0 | 2 | 8 | 0 | 2 | 8 |
| 8 | 2 | 4 | 4 | 2 | 4 | 4 | 3 | 4 | 3 | 3 | 5 | 2 |
| 9 | 2 | 4 | 4 | 2 | 4 | 4 | 2 | 3 | 5 | 2 | 3 | 5 |
| 10 | 4 | 4 | 2 | 2 | 4 | 4 | 5 | 4 | 1 | 5 | 4 | 1 |
| 11 | 2 | 4 | 4 | 3 | 4 | 3 | 4 | 4 | 2 | 4 | 5 | 1 |
| 12 | 2 | 4 | 4 | 2 | 4 | 4 | 3 | 3 | 4 | 3 | 5 | 2 |
| 13 | 10 | 0 | 0 | 10 | 0 | 0 | 9 | 1 | 0 | 10 | 0 | 0 |
| 14 | 8 | 2 | 0 | 9 | 1 | 0 | 9 | 1 | 0 | 8 | 2 | 0 |
| 15 | 9 | 1 | 0 | 10 | 0 | 0 | 10 | 0 | 0 | 10 | 0 | 0 |
| 16 | 10 | 0 | 0 | 9 | 1 | 0 | 10 | 0 | 0 | 10 | 0 | 0 |
| 17 | 7 | 3 | 0 | 10 | 0 | 0 | 9 | 1 | 0 | 10 | 0 | 0 |
Table text extracted from the original PDF; superscript letters are shown inline. The original table image is below.
View original table image
| Factor | Sum of Squares | Degrees of Freedom | Mean Square | F-value | P-Value | Significance |
|---|---|---|---|---|---|---|
| Model | 841.70 | 9 | 93.52 | 105.95 | < 0.000 1 | ** |
| A-Adsorbent Ratio | 19.53 | 1 | 19.53 | 22.13 | 0.002 2 | ** |
| B-Decolorant Dosage | 6.04 | 1 | 6.04 | 6.84 | 0.034 6 | * |
| C-Decolorization Temperature | 0.877 8 | 1 | 0.877 8 | 0.994 5 | 0.351 9 | |
| AB | 2.81 | 1 | 2.81 | 3.18 | 0.117 8 | |
| AC | 6.63 | 1 | 6.63 | 7.51 | 0.028 9 | * |
| BC | 7.29 | 1 | 7.29 | 8.26 | 0.023 9 | * |
| A2 | 515.05 | 1 | 515.05 | 583.52 | < 0.000 1 | ** |
| B2 | 163.03 | 1 | 163.03 | 184.70 | < 0.000 1 | ** |
| C2 | 54.49 | 1 | 54.49 | 61.74 | 0.000 1 | ** |
| Residual | 6.18 | 7 | 0.882 7 | |||
| Lack-of-fit | 4.78 | 3 | 1.59 | 4.54 | 0.089 0 | |
| Pure Error | 1.40 | 4 | 0.350 8 | |||
| Total Sum of Squares | 847.87 | 16 |
Table text extracted from the original PDF; superscript letters are shown inline. The original table image is below.
View original table image
| — | Crude Glycerol | Refined Glycerol |
|---|---|---|
| Content w/% | 72 | 99.8 |
| Color | Dark yellow | Colorless to faint yellow |
| Odor | Pungent | characteristic sweetness |
| Transparency | Turbid | Transparent viscous liquid |
| Chlorides | ≤1 | ≤0.003% |
| Relative Density (25°C/25°C) | 1.186 | ≥1.249 |
| Fatty Acids & Esters | Unqualified | Passed Testing |
| Lead (ppm) | Unqualified | Passed Testing |
| Readily Carbonizable Substances | Unqualified | Passed Testing |
Table text extracted from the original PDF; superscript letters are shown inline. The original table image is below.
View original table image
References
18 in the original paper- Gong SC. Preparation of fatty acid methyl esters and glycerin from vegetable oil soap stock. J Dandong Text Coll. 2002;9:7-8.
- Gao YY, Guo L, Lin XY, et al. Comprehensive utilization prospects of biodiesel by-product glycerin. J Agric Prod Process. 2007;7:26-9.
- Xin YN. Continuous crude glycerol distillation technology. China Oils Fats. 2002;27:67-69.
- Zhang SW, Yu CH. Extraction process of pigments and glycerol from beet molasses fermentation waste liquor. Chem World. 2001;4:197-199.
- Shen RM, Gan SQ. New exploration of refining process for saponified crude glycerol. J South-Central Univ Natl Nat Sci Ed. 1996;15:9-12.
- Jian L, Suo QL, He WZ, et al. Study on purification method of saponified glycerol by ion exchange. Inner Mong Petrochem Ind. 2000;26:5-7.
- Debjani C, Das S, Das H. Aggregation of sensory data using fuzzy logic for sensory quality evaluation of food. J Food Sci Technol. 2013;50:1088-1096.
- Eakkanaluksamee K, Anuntagool J. Optimization of high-protein glutinous rice flour production using response surface method. Rice Sci. 2020;27:75-80.
- Zhang Y, Xu N, Yu WJ, et al. Optimization of physalis polysaccharide yogurt process using fuzzy mathematics combined with response surface methodology. China Dairy Ind. 2024;52:59-64.
- Zhu L, You XX, Hu HW. Optimization of fermentation process and antioxidant activity of AstragalusCodonopsis health rice wine using fuzzy mathematics evaluation combined with response surface methodology. China Brewing. 2024;43:224-230.
- Fu JH. Separation and purification of biodiesel byproduct glycerol. Zhejiang Jia'ao Environmental Protection Technology Co., Ltd, 2021 May 28.
- National Standard of China. GB/T 13216-2008 Test methods for glycerol. Light Ind Stand Qual. 2012;4:39.
- Meng XH. Optimization of mulberry leaf and mung bean jelly formula using fuzzy mathematics combined with response surface methodology. Cereals Oils Sci Eng. 2024;38:24-9.
- Duan SQ, Ji HW, Zhang D, et al. Optimization of vacuum microwave drying process for Litopenaeus vannamei based on fuzzy mathematics evaluation method. J Guangdong Ocean Univ. 2021;41:131-138.
- Sun QM, Zhang L, Wang LM, et al. Progress in separation and purification technology of biodiesel byproduct glycerol. Chem Ind Eng Prog. 2017;36:155-160.
- Munoz DA, Lucca DG, Damasceno GK, et al. Agroindustrial wastes as solid adsorbents for glycerol removal: Potential use in biodiesel dry purification. Ind Crops Prod. 2024;222:119697.
- Guangzhou: Guangzhou Inst Energy Convers, Chinese Acad Sci, 2021 Aug 2.
- Li H, Ni N, Zhao R, et al. Optimization of fermentation process for spina date seed and tartary buckwheat yogurt using response surface methodology. China Dairy Ind. 2020;48:59-64.