
Research article · 2025 · Full text
International Journal of Agriculture and Food ScienceAssessment of the quality parameters of carbonated soft drinks, beverages and water in Sudanese industries as comparing with quality standard
Volume 7(3) · Pages 129–133 · DOI: 10.33545/2664844x.2025.v7.i3b.323 ↗
Research areasFood Safety and HygieneFood Waste Reduction and SustainabilityNutrition and Health Studies
Abstract
Author-writtenThe present study was conducted in Faculty of agriculture in Elnelien University during the period 2020 - 2022. The objective of the study was to determine the quality parameters of carbonated soft drinks, beverages and water in Sudanese Industries as coincide with SSMO1999 and WHO (2011) standards. The data of samples were statistically analyzed by using the complete randomized design (CRD) and the mean separation were done by least significant different test (LSDT). The result of the study was found that quality parameters for soft drinks samples were collected from Sudanese soft drink industries as compare with maximum permissible limit, in case of Carbon dioxide, Coca, Fanta, Pepsi, Miranda, 7-up and Shampion were within recommened range (3-4.5), while Sprite, Stim, Royal, Pasignos and Assel were below range. Refer to PH, Coca, Fanta, Miranda, Stim, Royal and Champion were within recommened range (2.5-3.5), Pepsi, Sprite Pisaynose and Assel were below recommened range, 7-Up was above recommened range. Concersning to Total acidity all soft drinks samples were below recommened range (less than 0.4). The study of result indicates that the Brix in all soft drinks samples were whin range (10 - 17), acept Sprite, Fanta and Pepsi were blew the critacal limit, while all the beaverage samples were was within recommened range (12 -18). In case of Ozone concentratin and Dissolved Oxygen all soft drinks samples was within aceptable limit (0.2 - 0.4) and (4.0 - 8.0) respectivly. All so the result deteted that the Removable torque in all soft drinks samples was within aceptable limit (5 - 17). And the Net content end product of all beverages and water samples were online within the permeshable range(1ml±Net). The study recommended that more elaborated work is recommended on general requirements of food safety program.
Summary
Source-checkedPlain-language reading of the full paper, prepared with AI and checked against the text. Each point links to the authors' own words.
The question
- The researchers sought to determine if the quality parameters of Sudanese soft drinks, beverages, and water align with established national and international standards. View evidence ↗
What they did
- The research was conducted at the Faculty of Agriculture in Elnelien University between 2020 and 2022. View evidence ↗
- Samples were provided by several companies in Khartoum, Sudan, including Dal group, Arak group, Elniel, Elberer group, Fowaz, and Pasgianos. View evidence ↗
- Carbonated soft drink (CSD) samples were analyzed for pH, titratable acidity, Brix, inverted Brix, carbonation volume, sugar, alcohol, phosphate, and heavy metal concentrations using AOAC procedures. View evidence ↗
- Data were analyzed using a complete randomized design (CRD), with mean separation performed via the least significant difference test (LSDT). View evidence ↗
What they found
- Total dissolved salts (TDS) in water samples from Coca-Cola (66.2), Pepsi (142.2), Stim (98.7), and Pasgianos (77.4) were all within the critical limit. View evidence ↗
- The net content of all beverage and water samples was within the permissible range of 1ml±Net. View evidence ↗
What it means
- The authors recommend further detailed research on Sudanese soft drinks and beverages to determine microbial levels and heavy metal concentrations. View evidence ↗
- The study indicates a need for more elaborate work regarding the determination of microbial and heavy metal content in these products. View evidence ↗
Figures & tables
From the original paper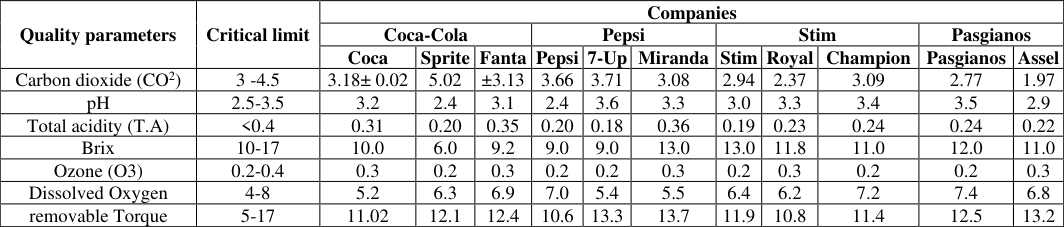 Table 1
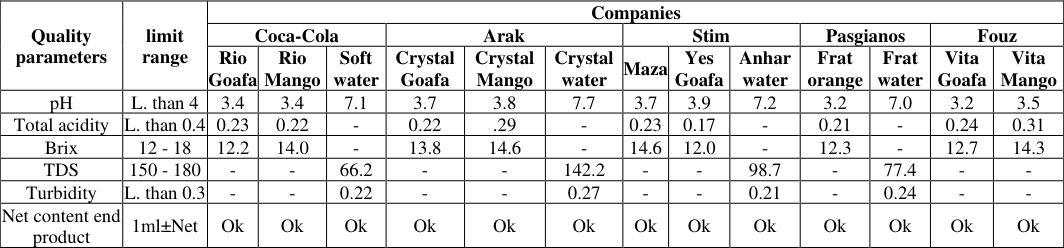 Table 2
Introduction Materials
Dal group, Arak group, Elniel, Elberer group, Fowaz and Pasgianos companies provided all samples kindly, Khartoum, Sudan. All the other chemicals and reagents were utilized as received at analytical reagent grade.
Quality parameters of carbonated soft drinks, beverages and water Sampling:
The CSDs samples were obtained in triplicate from the factories during observational audition. Samples were kept in dry bottles sealed tidily and labeled. After that, all samples were transferred to analytical laboratory to meet the assessment of food safety and food quality requirement.
Samples were taken and adjust temperature to 40 ºC. The samples were equilibrated by gently inverting 15 times in 30 seconds. The bottle was placed under the tester and followed the method of carbonation measurement. Then maximum pressures and the temperature reading were recorded. Adjust pressure reading with attitude Correction factor if applicable. Corrected Pressure = Gauge Pressure -Altitude Correction Factor. Adjust temperature reading with correction factor, if needed, from the temperature calibration check. Convert pressure and temperature to gas volumes using the Carbonation Volumes Chart or Carbonation Volume slide rule.
Determination of pH and Titratable Acidity
The pH values were measured using a digital pH meter (Jenway 3510 pH Meter). The value was shown automatically on the screen. The titratable acidity of the CSDs was obtained by titration method. Burette filled with 0.1 Normal sodium hydroxide solutions to the zero line. Then Pipette 100.0 ml of degassed sample beverage into a clean and dry 250-mL beaker. Carefully place a clean, dry, stirring bar into the beaker. Place the beaker on the magnetic stirrer, and turn the stirrer on so the sample is gently agitated. Rinse the electrode with de-ionized water then immerse the bottom 1/3 of the electrode in the sample. Allow the pH reading to stabilize and record the beverage pH. Titrate the sample slowly with the 0.1N NaOH. The burette spout should be over the beverage, and slightly below the top of the beaker. Continue to add NaOH until the pH meter reads constant 8.75. Be careful not to overshoot 8.75 pH. Close the burette valve. Read the liquid level in the burette to the nearest 0.05ml. Consider this reading as the titer. If the NaOH solution normality is 0.100 N, then no correction is needed. If the sodium hydroxide solution normality is not 0.100 N, then multiply the titer by the correction factor. Calculations: Actual TA = Titer x NaOH Correction Factor.
Determination of Brix and Inverted Brix
Brix measurement was done with a digital refractometer in temperature compensation mode (Model J157, Rudolph Research Analytical and USA). It measures the weight of dissolved solids in final beverages. Degassed CSDs samples were directly placed in Clean and dry prism of refractometer. Then close the top, if so equipped and wait about 20 seconds for temperature stabilization. Brix reading was taken. Brix inversion was also done with bench refract meters. It measures the change of sucrose molecule into the simple molecule of glucose and fructose. For measurement of Brix inversion degassed CSDs samples were then transferred into a sealable vival. About 0.4ml of 2.5N HCl per 35 ml sample to all non-carbonated beverages was added. Those were capped and sealed the vial to ensure no moisture loss or gain during the hot water bath. Samples were then placed in 1000C water bath for 40 minutes. Then sealed samples were removed and placed in cooling bath until samples temperature were approximately 200 ºC. Gently shaken vial to mix any condensed water collected along the inside. Sample testing was done as described in the appropriate Brix test procedure.
Determination of Ozone Concentration
Spectrophotometric method was used to investigate the ozone concentration. Briefly, ozonation of 5 mL methyl orange solution 5 mg/L. After ozonation, solution was diluted with distilled water until the pH is equal to the initial pH. The absorbance of methyl orange solution was then measured using a UV-Vis spectrophotometer at maximum absorption wavelength of 460 nm. Ozone concentration was determined based on the assumption that the number of moles of methyl orange oxidized is directly proportional to the number of moles of ozone to oxidize. This procedure was performed also for methyl orange solution with a concentration of 10 mg/L and 15 mg/L, as well as to the amount of methyl orange solution 10, 15 and 20 mL. Ozonation procedure was held three times.
Measurement of total dissolved solids
Measurement of total dissolved solids
Determination of Dissolved Oxygen
Dissolved oxygen present in a given water sample was determined by iodometric method (winkler's method). Typically, take 100 ml of given water sample into a conical flask, and titrate slowly against N / 50 standard sodium thiosulphate solutions (taken in the burette). When the color Gently agitate the sample and wait for the air bubbles to disappear. • Place the sample in turbidity meter and close the cover • Allow the reading for a few seconds to become stabilize and then take it.
Calculations
Calculations
Determination of torque of packing CSD
The torque was measuring according to ASTM D Standard test Method, (2018) as flowing:
1. Select sufficient quantities of new containers and closures to allow for control groups and at least 10 specimens for each torque measurement point per test variable. Also consider if a sterilization cycle is to be included. 2. Use the torque testing system to set the application torque at the application torque determined on the basis of the desired removal torque range. Record the application torque. 3. For static evaluation, measure the removal torque of one group immediately. Store the other remaining groups for the required intervals, temperatures and humidity before measuring the removal torque. Record the removal torque, the storage conditions, the interval before measurement. 4. For dynamic testing, use the torque testing system to set the application torque recommended at the application torque determined on the basis of the desired removal torque range. Record the application torque. 5. Measure the removal torque of one group immediately, Record the removal torque. 6. Subject the remaining specimens to the selected distribution cycle, and then measure the removal torque as before. If information about long term storage is also required, then further specimens can be subjected to the required storage condition before removal torque measurements are made.
Record the removal torque, the storage conditions, and interval before measurement. Report the application torque and mean value for each test condition variable.
Acknowledgement
AcknowledgementsThe authors would like to express their deep appreciation to the production managers and workers in the Sudanese soft drinks industries for providing the appropriate information to finish this study.
Figures and tables from the paper
| Quality parameters | Critical limit | Companies | — | — | — | — | — | — | — | — | — | — |
|---|---|---|---|---|---|---|---|---|---|---|---|---|
| Coca-Cola | Pepsi | Stim | Pasgianos | |||||||||
| Coca | Sprite | Fanta | Pepsi | 7-Up | Miranda | Stim | Royal | Champion | Pasgianos | Assel | ||
| Carbon dioxide (CO2) | 3 -4.5 | 3.18± 0.02 | 5.02 | ±3.13 | 3.66 | 3.71 | 3.08 | 2.94 | 2.37 | 3.09 | 2.77 | 1.97 |
| pH | 2.5-3.5 | 3.2 | 2.4 | 3.1 | 2.4 | 3.6 | 3.3 | 3.0 | 3.3 | 3.4 | 3.5 | 2.9 |
| Total acidity (T.A) | <0.4 | 0.31 | 0.20 | 0.35 | 0.20 | 0.18 | 0.36 | 0.19 | 0.23 | 0.24 | 0.24 | 0.22 |
| Brix | 10-17 | 10.0 | 6.0 | 9.2 | 9.0 | 9.0 | 13.0 | 13.0 | 11.8 | 11.0 | 12.0 | 11.0 |
| Ozone (O3) | 0.2-0.4 | 0.3 | 0.2 | 0.3 | 0.2 | 0.2 | 0.3 | 0.2 | 0.3 | 0.2 | 0.2 | 0.3 |
| Dissolved Oxygen | 4-8 | 5.2 | 6.3 | 6.9 | 7.0 | 5.4 | 5.5 | 6.4 | 6.2 | 7.2 | 7.4 | 6.8 |
| removable Torque | 5-17 | 11.02 | 12.1 | 12.4 | 10.6 | 13.3 | 13.7 | 11.9 | 10.8 | 11.4 | 12.5 | 13.2 |
Table text extracted from the original PDF; superscript letters are shown inline. The original table image is below.
View original table image
| Quality parameters | limit range | Companies | — | — | — | — | — | — | — | — | — | — | — | — |
|---|---|---|---|---|---|---|---|---|---|---|---|---|---|---|
| Coca-Cola | Arak | Stim | Pasgianos | Fouz | ||||||||||
| Rio Goafa | Rio Mango | Soft water | Crystal Goafa | Crystal Mango | Crystal water | Maza | Yes Goafa | Anhar water | Frat orange | Frat water | Vita Goafa | Vita Mango | ||
| pH | L. than 4 | 3.4 | 3.4 | 7.1 | 3.7 | 3.8 | 7.7 | 3.7 | 3.9 | 7.2 | 3.2 | 7.0 | 3.2 | 3.5 |
| Total acidity | L. than 0.4 | 0.23 | 0.22 | - | 0.22 | .29 | - | 0.23 | 0.17 | - | 0.21 | - | 0.24 | 0.31 |
| Brix | 12 - 18 | 12.2 | 14.0 | - | 13.8 | 14.6 | - | 14.6 | 12.0 | - | 12.3 | - | 12.7 | 14.3 |
| TDS | 150 - 180 | - | - | 66.2 | - | - | 142.2 | - | - | 98.7 | - | 77.4 | - | - |
| Turbidity | L. than 0.3 | - | - | 0.22 | - | - | 0.27 | - | - | 0.21 | - | 0.24 | - | - |
| Net content end product | 1ml±Net | Ok | Ok | Ok | Ok | Ok | Ok | Ok | Ok | Ok | Ok | Ok | Ok | Ok |
Table text extracted from the original PDF; superscript letters are shown inline. The original table image is below.
View original table image
References
3 in the original paper- Ramalakshmi K, et al. Separation and characterization of chromogenic acid-rich conserves from green coffee beans and their radical scavenging potential. J Sci Food Agric. 2011;46(1):109-115.
- SSMO. Sudanese Standards and Metrology Organization. Standard of Non-Alcoholic carbonated soft drinks (250/2007); c2007.
- Staudinger KC, Roth VSJA. Occupational lead poisoning. Am Fam Physician. 1998;57(4):719.