
Research article · 2024 · Full text
International Journal of Geography Geology and EnvironmentEvaluation of geotechnical characteristic of surface soil for compressed earth block industry in Shuwan area northern of Kirkuk
Volume 6(1) · Pages 230–237 · DOI: 10.22271/27067483.2024.v6.i1d.224 ↗
Research areas3D Modeling in Geospatial ApplicationsGeotechnical Engineering and Soil Stabilization
Abstract
Author-writtenThe study and evaluation of geotechnical characteristics, which included tests of the, grain-size distribution analysis, Atterberg Limits and specific gravity, chemical and mineralogical analyses of samples from the shuwan, northern of Kirkuk, and the possibility of using them as raw materials in the compressed earth block industry, were all part of the research. The samples are composed of 28% clay, 47.2% silt, and 17.6% sand. The results of the soil consistency showed that the soil is of a low to medium plasticity type depending on the plasticity scheme within the standard classification of soils and that it can be formed and take suitable plasticity for the compressed earth blocks industry. Results were classified according to Picard's chart, showing that it is located within the clayey silt field, and this indicates an increase in the ability to form the compressed earth blocks industry. And the results of the specific weight ranged between (2.69 – 2.73), where the data of the results of this study showed the validity of these clays in the brick industry.
Summary
Source-checkedPlain-language reading of the full paper, prepared with AI and checked against the text. Each point links to the authors' own words.
Why it matters
- Clay bricks are valuable construction materials because they are durable, fire-resistant, provide good thermal insulation, and are inexpensive to produce. View evidence ↗
- Compressed earth blocks are an important construction industry option because they use local soils, have very low costs, and are environmentally friendly since they do not require burning. View evidence ↗
The question
- The research aims to analyze the geotechnical, chemical, and mineralogical properties of soil from various sites in the Shuwan area to determine its suitability for making compressed earth blocks. View evidence ↗
What they did
- Laboratory tests conducted at Kirkuk construction laboratories following ASTM standards included grain-size analysis, specific gravity, and Atterberg limits for soil consistency. View evidence ↗
- The researchers produced 25 compressed earth block models for each of the five study sites to determine their compressive strength. View evidence ↗
- Bricks were naturally dried and tested for compressive strength at four different curing intervals: 7, 11, 21, and 28 days. View evidence ↗
What they found
- The analyzed soil samples consisted of 47.2% silt, 28% clay, and 17.6% sand. View evidence ↗
- The specific gravity of the soil ranged from 2.69 to 2.73, identifying the soil as clay and silty clay. View evidence ↗
- Soil consistency tests classified the samples as having low to medium plasticity (CL). View evidence ↗
- Classification using Picard's chart placed the soil in the clayey silt field, which suggests a high suitability for forming compressed earth blocks. View evidence ↗
- Geotechnical and engineering tests indicated that most of the soil from the study area is suitable for the construction of low-cost buildings using compressed earth blocks. View evidence ↗
- There is an inverse relationship between water content and compressive strength, meaning bricks with lower water content exhibit higher compressive strength. View evidence ↗
- A direct relationship was found between compressive strength and durability, where higher durability leads to better sustainability of the blocks. View evidence ↗
What it means
- The authors conclude that the particle size ratios of the materials in the study area meet international specifications (ARS 674: 1996 and AS-1: 2007) for producing compressed earth blocks. View evidence ↗
- The authors state that the unconfined compressive strength of the produced blocks is excellent compared to the specifications of traditional burnt blocks. View evidence ↗
Visual summary
3 visualsIllustrations explain the paper; charts are replotted from the paper's own table values.
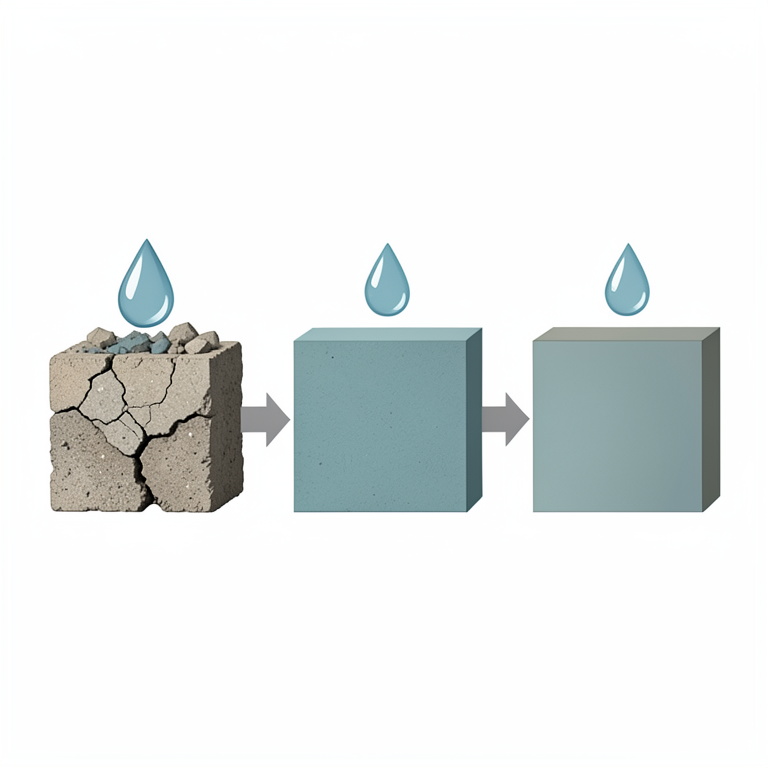
Water Content vs. Compressive Strength
AI-generated conceptual illustration (compressed earth blocks made from surface soil). It explains the idea and does not show study data.
View source evidence ↗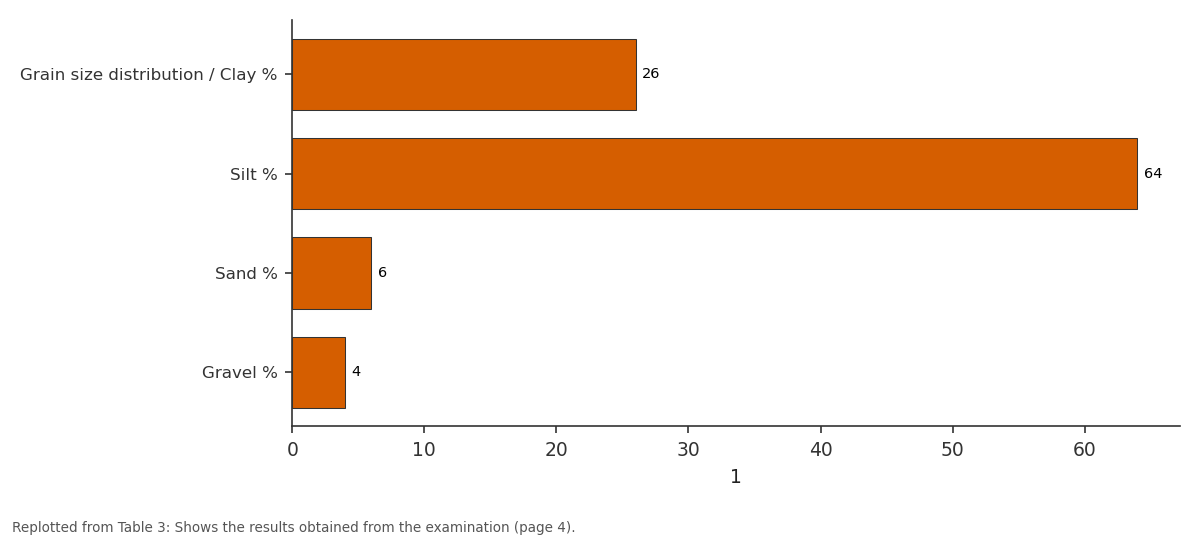
1: Grain size distribution... vs Silt % vs Sand % vs Gravel %
Replotted from Table 3 (page 4) of the original paper. Every bar is the paper's own table value.
View source evidence ↗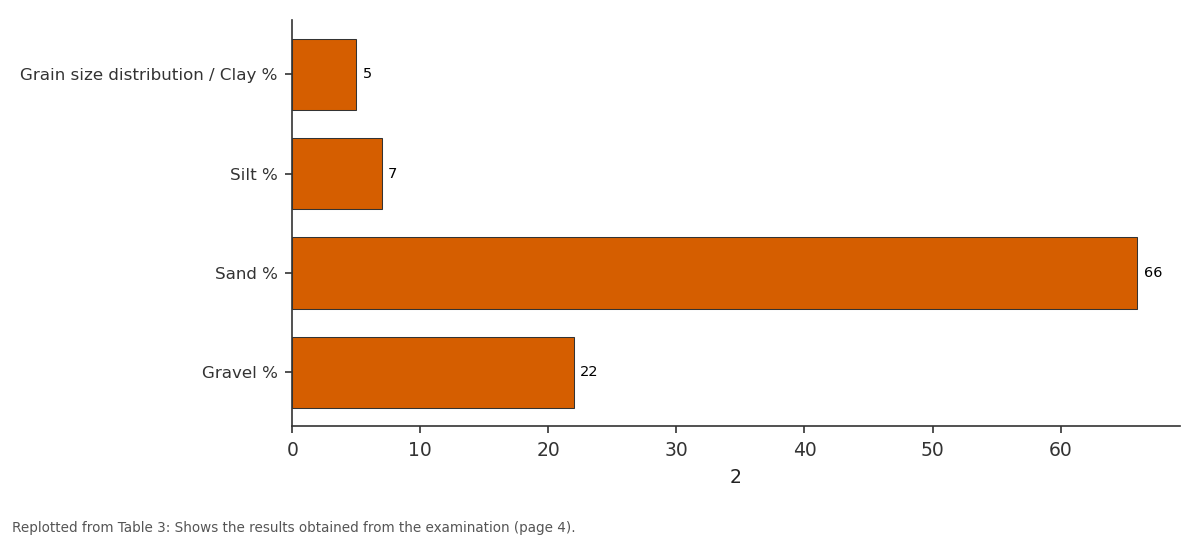
2: Grain size distribution... vs Silt % vs Sand % vs Gravel %
Replotted from Table 3 (page 4) of the original paper. Every bar is the paper's own table value.
View source evidence ↗Figures & tables
From the original paper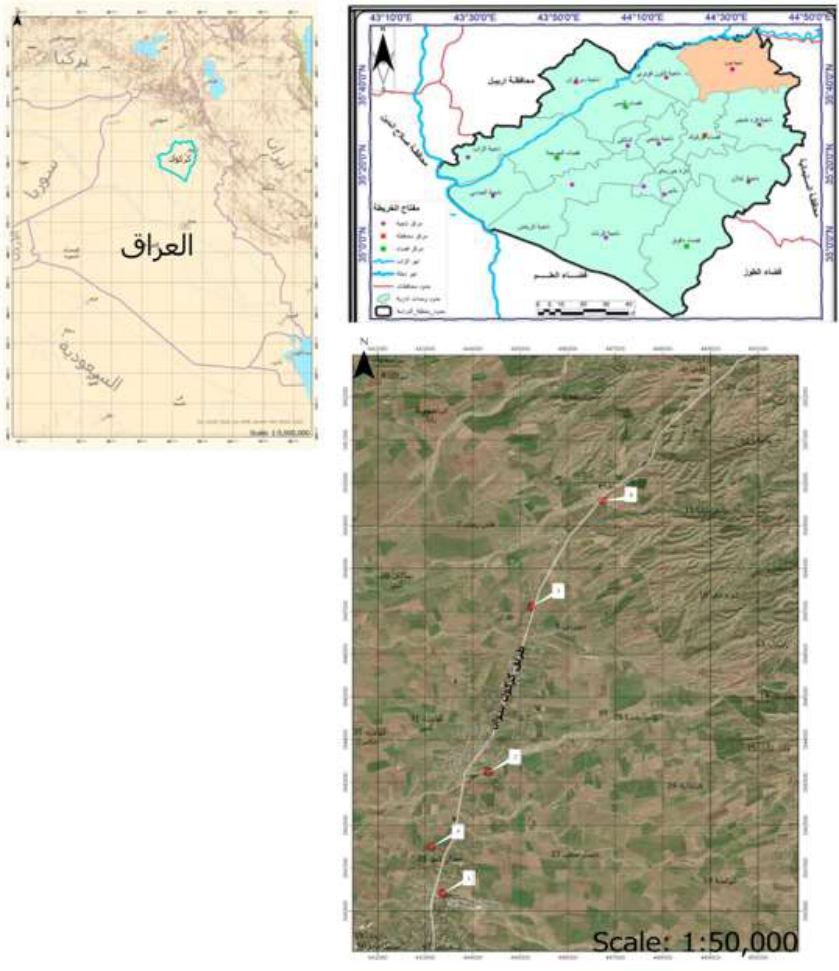 Figure 1
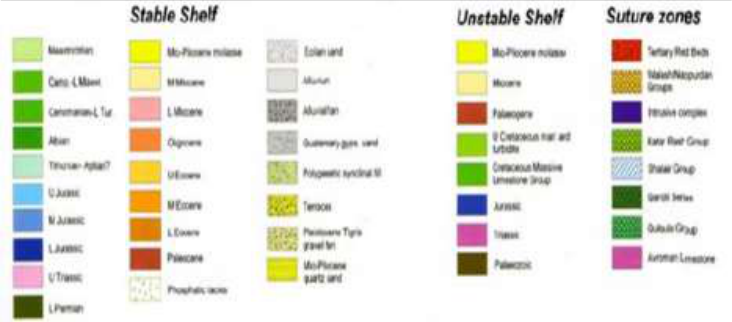 Figure 2
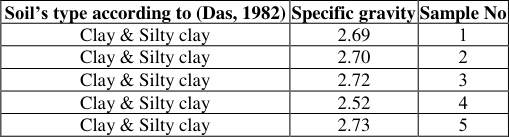 Table 2
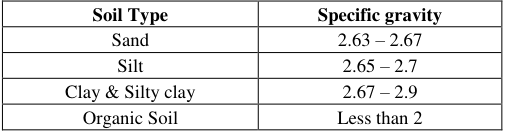 Table 1
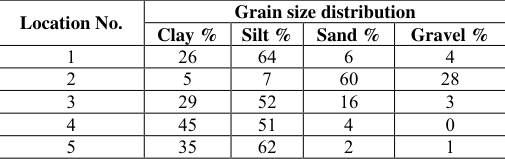 Table 3
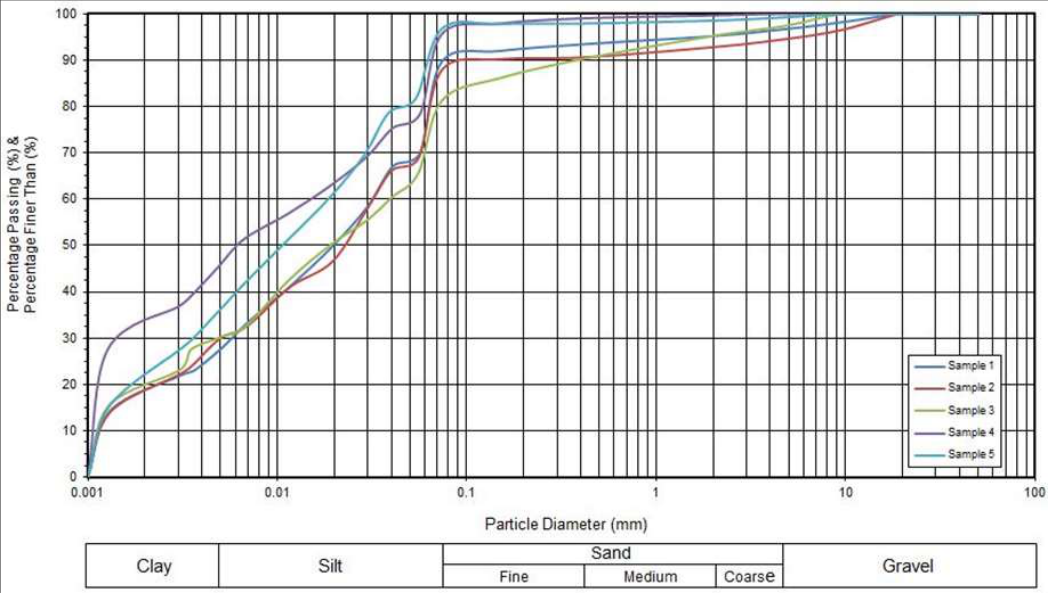 Figure 3
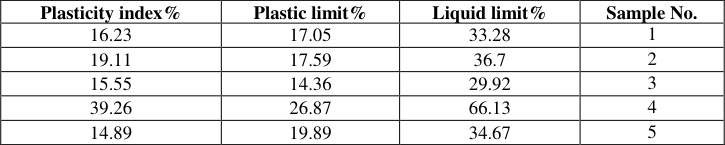 Table 4
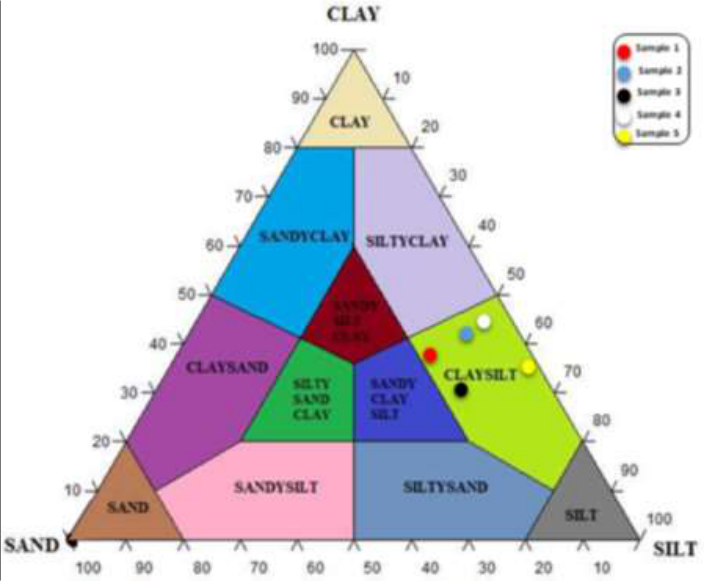 Figure 4
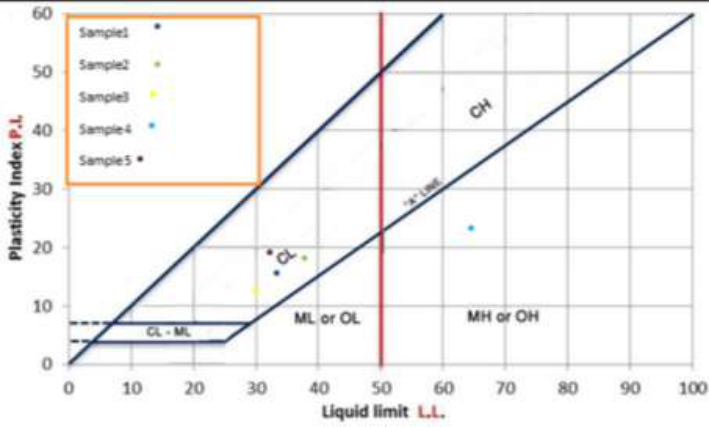 Figure 5
 Figure 6
 Figure 7
 Table 5
 Table 6
Introduction
Clay brick is considered one of the oldest construction materials used in construction in Mesopotamia. It was used in the form of stacked clay in primitive buildings. Then its manufacture developed into cut and dried shapes or mixed with other auxiliary materials such as plant stems (Hay) for the purpose of strengthening them and giving them a geometric shape and a degree of insulation. After that, regular bricks were produced by subjecting them to drying and burning in primitive ovens. Clay bricks are one of the building materials that are characterized by low production costs, their durability, not being affected by fires, and their good ability to thermal insulation. Since ancient times, humans have been using clay bricks due to their abundance and ease of representation and formation in the required geometric shape. Most of the surface clays are suitable for use in making bricks. The production of compressed earth blocks is one of the very important industries in the field of construction, especially since it has a very low cost, as the prevailing soil in each region is used in its manufacture, in addition to being environmentally friendly because it does not require burning or polluting the environment during its manufacture. The study area is administratively located in Kirkuk Governorate and is located in the Shawan region, northeast of Kirkuk Governorate. It is 36 kilometers from Kirkuk Governorate's center. Which is situated between the longitudes (35°36 21) and (35°36 56) and the latitudes (44°22 29) and (44°22 19). Fig. 1. The goal of this research is to choose different sites in the study area to analyze the geotechnical qualities of the soil there, as well as the chemical and mineralogical properties of compressed earth blocks made from the study region's soil, In addition to studying the geotechnical and engineering properties of compressed earth bricks produced from the study area's soil, evaluating the geotechnical and engineering properties, drawing conclusions and making comparisons for the bricks produced, indicating the best and emphasizing the areas represented in the production of bricks with international specifications.
Geology of the study area
Knowing the geology of the study area is especially important in understanding the general stratigraphic, compositional, geomorphological, and depositional conditions, as well as the changes affecting them, particularly tectonics, to enable the interpretation of any data obtained from the research, and from it we learn about the engineering characteristics of the rocks and soils spread throughout the region that are used in engineering projects, and determine the type of rock and soil. The nature of the existing soils and the geological environment in this location, anticipating probable soil effects, and determining exposed geomorphological shapes and characteristics. This study provided a detailed geological description of the studied area, including tectonic and compositional information. In terms of tectonics, the researcher Fouad (2015) [17] divided Iraq into two parts, one of which is located within the Arabian Plate and the other within the Eurasian Plate, with the part located within the Arabian Plate divided into flat lands (Inner Platform) and rugged lands (Outer Platform). The study region is located in the Low Folded Zone of the rough terrain, according to this categorization. The following geological formations are found in the study region, in order of age Upper Miocene Injana Formation Busk and Mayo characterized this development for the first. According to (Jassim & Goff, 2006) [9] , it was referred to as the Supreme Knight in Iran. Bellen and colleagues stated that its age is in the late Miocene, and it was known as the Injana Formation in Iraq (Al-Rawi et al, 1992) [6] , and the thickness of this formation is 30 meters. It varies from region to region, with the thickness of this deposit reaching more than 2000 m in the Foot Hill Zone. This is due to geographical variances. Lower Pliocene Miqdadiya Formation Busk and Mayo were the first to describe this formation. According to (Buday, 1980) [8] , it was known as the Lower Bakhtiari Formation in Iran. The appearance of a typical piece of it in Iraq in the Muqdadiya region, north of Diyala Governorate, is linked to the Muqdadiya Formation, which constitutes the lower half of The Bakhitari Formation (Jassim | & Goff, 2006) [9] . It is made up of a series of sandstone rock strata, with pebblesand deposits that range in color from gray to light green and range in size. It is medium to coarse granular, with a thickness ranging from (1-6 m) and a layer of coffee-colored mudstone rocks, Fatha Formation is one of the most common Miocene formations, and it is also economically significant in Iraq, as it contains evaporite rocks, which form cover rocks for many oil reserves. It is frequently exposed in northeastern Iraq near low folds and on the borders of high folds (Jassim et al. 1984) [11] . The Bai Hassan Formation is similar to the Muqdadiya Formation in general, with the exception of geological age, as the Bai Hassan Formation is younger and has coarser grain sizes than the Muqdadiya Formation, with a thickness of more than 638 meters (Jassim et al. 1984) [11] . This Pliocene-Upper Miocene formation comprises of mudstone alternations with sandstone and siltstone and is frequently buried by current deposits. This formation's thickness surpasses (2000) meters. Quaternary deposits differ in origin because they are formed from older clastic deposits, and the thickness of their deposits varies and can exceed 120 m in some wells drilled in the research area (Jassim and Goof, 2006) [9] . Because of their age, Quaternary deposits cover the majority of the study region. The ages of these deposits range from the early Pleistocene to the late Holocene. The Pleistocene age of the recent deposits is represented by lenses and layers of gravel, sand, clay, and dirt (Jassim and Goof, 2006) [9] . The modern deposits are taken into account. Good water storage configurations (Good aquifer) Fig 2 : geological map showing the lithology of exposed formations, adapted from (Jassim and Goff, 2006) [9] Materials and Procedures Geotechnical tests of soils study area include specific gravity, grain-size analysis, and Soil consistency (Atterberg limits) is part of the laboratory activity. Which were carried out at Kirkuk construction laboratories in accordance with the American Society for Testing and Materials (ASTM) to determine the viability of these clays in the brick industry and their conformity with Iraqi specifications
The specific gravity o is the ratio between the weights of a certain volume of the substance to the weight of an equal volume of distilled water at the same temperature and is symbolized by the symbol (Gs). This test was carried out in Kirkuk construction laboratories on the soil of the research region in accordance with the American specification (ASTM-D, 854-02-2004). Das (1982) [7] found specific gravity values for each type of soil shown in table 1. The specific weights of the soil of the study area ranged between (2.69-2.73), and through the results of the specific weight it can be said that the soil of the study area is clay and silty clay soil. Shown in table 2.
| Soil Type | Specific gravity |
|---|---|
| Sand | 2.63 – 2.67 |
| Silt | 2.65 – 2.7 |
| Clay & Silty clay | 2.67 – 2.9 |
| Organic Soil | Less than 2 |
Table text extracted from the original PDF; superscript letters are shown inline. The original table image is below.
View original table image
| Soil’s type according to (Das, 1982) | Specific gravity | Sample No |
|---|---|---|
| Clay & Silty clay | 2.69 | 1 |
| Clay & Silty clay | 2.70 | 2 |
| Clay & Silty clay | 2.72 | 3 |
| Clay & Silty clay | 2.52 | 4 |
| Clay & Silty clay | 2.73 | 5 |
Table text extracted from the original PDF; superscript letters are shown inline. The original table image is below.
View original table image
Table 1:
Represents the actual specific gravity ranges for various soil types. (Das, 1982) [7] Specific gravity Soil Type samples and their classification according to Das (1982) [7] . Grain size analysis one of the most essential physical parameters for defining the features of the product from bricks is grain size analysis (Al-Mallah, 2014) [15] . The size analysis seeks to categorize soil into aggregates based on the weight percentage of each content (gravel, sand, silt, and clay). Sieve examination the examination was completed at the Kirkuk Construction Laboratories in accordance with the American standard (ASTM-D, 422, 2004). Wet analysis is performed on fine soils with diameters less than 0.075 mm and passing through sieve No. 200. Soil samples were examined in Kirkuk construction laboratories in accordance with the American Standard (ASTM, D-422, 2004). To determine the textural classification, the relationship between the weight percentage of the basic components of clay, silt, and sand (Sand -Clay -Silt) for the models of the research region is represented by the Picard's classification triangle (1971). Because the components of clay sediments are so similar, this classification was used, and as a consequence, the models can be named. 4. The plasticity scheme was used in this work inside the Unified Soil Classification System) USCS). Fig. 5 depicts the distribution of the study area's samples on the plasticity diagram in order to classify soft soils within the unified classification and the decree between (plasticity Index, liquid limit) where the samples were projected within the fields in the figure and on the basis of which they are named and classified as low to medium plasticity (CL).
Sample No
Sample No
Geotechnical properties of compressed earth blocks Soil
It is the primary raw material used in the manufacture of compressed earth blocks. It is a mixed substance made up of various quantities of gravel, silt, clay and sand. Changes in moisture content and density have an impact on the engineering behavior of silt and clay. Before making compressed earth bricks, the soil must be examined to determine its salinity. To prevent using soil containing organic components and plants, the surface of the soil was excavated to a depth of 20-30 cm. Which is considered an unsuitable material in the creation of compressed earth bricks? The soil type of the research region is claysilt, (G. Minke, 2006) [18] .
Moisture contain
It is a key material in the production of compressed earth blocks. It is mixed into the soil until it reaches a plastic condition within the range of the plasticity coefficient, making concrete processes easier. Because contaminants in the added water can interfere with the production of compressed earth blocks, water quality is critical. This may cause the bricks to break and damage the texture, or it may cause the surface of the bricks to split during drying, reducing the compressive resistance of the bricks. As a result, the compatibility of the water used in the production of compressed earth bricks must be considered. The stages of making compressed earth bricks started with (G. Minke, 2006) [18] .
Compression process
This procedure is carried out utilizing equipment designed for the production of compressed earth bricks. Previously, a wooden stick was used to force the soil into molds specifically designed for this reason. There are currently various types of presses available for the process of pressing and manufacturing compressed earth blocks, whether mechanical or manual presses. There is one on the market (RAM CINVA). This technology is affordable and does not consume a lot of energy to run. The presses (CINVA_ RAM) (BREPAK) are the most well-known in the world due to their low cost, light weight, and ease of operation. Preparing it, but one of its downsides is that it only has one mold, has a modest compression force, and has a lesser output rate than other presses. Compressive strength was determined in this study, and (25) models of compressed earth blocks were produced for each of the five study sites using a device for manufacturing and examining compressed earth blocks, which is a device designed to produce compressed earth blocks that are 1/4 smaller than the original size common for producing bricks. According to international standards (ASR 674.1996), compacted earth has a compressive strength of around (15 MPa) as fig. 6.
Curing
This technique is critical in the manufacturing of compressed earth blocks because it affects the geotechnical and engineering qualities of the bricks. As a result, the bricks must be kept from weather elements and dried in shaded areas for at least four weeks. Because the models were made in the summer, they must be covered to avoid rapid drying due to the possibility of surface cracks.
Mineralogical Analysis of Raw Materials using XRD X-ray diffraction (XRD)
The X-ray diffraction (XRD) instrument was utilized to diagnose and identify mineral components in the current study's samples. Its analysis speed and precision. The investigation was conducted out at the scientific research center-soran university in Erbil Governorate using deflecting X-ray equipment. Table 5 it shows the clay minerals that appeared in the soil of the study area.
| Station | Quartz | Calcite | Enstatite | Kanoite | Zeolite | Clinopyroxene | Colusite | Berlinite | Dolomite | Ferroselite |
|---|---|---|---|---|---|---|---|---|---|---|
| 1 | 36.6 | 32.7 | 30.7 | / | / | / | / | / | / | / |
| 2 | 32.7 | 31.7 | / | 31.7 | / | / | / | / | / | 4 |
| 3 | 28 | 14 | / | / | 36 | 22 | / | / | / | |
| 4 | 24.8 | 26.7 | / | / | / | 41.6 | 1 | 5.9 | / | / |
| 5 | 36 | 34 | 25 | / | / | / | / | / | / | 5 |
Table text extracted from the original PDF; superscript letters are shown inline. The original table image is below.
View original table image
Geochemical tests
Geochemical tests are focused with determining the distribution and spread of the major elements and oxides because they provide vital information on the conditions and environment of deposition and digenetic processes, as well as the geochemical weathering processes that affect the rocks.
In the Kirkuk laboratory, samples of raw materials utilized in the current study were chemically tested in the form of the principal oxides using an X-ray flash (XRF) equipment of the (X-Supreme) type, and the findings are shown in the table 6.
| Total SO3 % | Total soluble Salts% | Organic matter | CL | Caco3 | Gypsum caso4.H2o | Ph | Sample No. |
|---|---|---|---|---|---|---|---|
| 0.36 | 1.08 | 0.33 | 0.004 | 23.745 | 0.77 | 8.34 | 1 |
| 0.45 | 1.2 | 0.0133 | 0.013 | 23.395 | 0.97 | 8.53 | 2 |
| 0.38 | 1.6 | 0.14 | 0.010 | 24.496 | 0.817 | 7.66 | 3 |
| 0.37 | 1.35 | 0.09 | 0.010 | 23.745 | 0.817 | 7.61 | 4 |
| 0.34 | 1.35 | 0.43 | 0.014 | 24.42 | 0.73 | 7.52 | 5 |
Table text extracted from the original PDF; superscript letters are shown inline. The original table image is below.
View original table image
Conclusion
The current study showed the following conclusions: The particle size ratios of the ground materials of the study area were appropriate for the production of compressed earth blocks based on international specifications (ARS 674: 1996, AS-1: 2007) The unconfined compressive strength values of compressed earth blocks produced from the soil of the study area are excellent in relation to the specifications of blocks produced by burning. The results of the geotechnical and engineering tests conducted on the soil of the study area showed that most of them are suitable for constructing low-cost buildings using compressed earth blocks. The results of the geotechnical and engineering tests for the produced compressed earth blocks showed that there is an inverse relationship between the water content and the number of drying days for the brick samples, whereas the curing days increases, the German content of the bricks decreases. An inverse relationship between the water content and the compressive strength of compressed earthen bricks, as the earthen brick with the lowest water content achieves the highest compressive strength. There is a direct relationship between the compressive strength and durability of the compressed earth blocks produced, as the higher the durability of the earth blocks, the better their sustainability.
Figures and tables from the paper
| Location No. | Grain size distribution | — | — | — |
|---|---|---|---|---|
| Clay % | Silt % | Sand % | Gravel % | |
| 1 | 26 | 64 | 6 | 4 |
| 2 | 5 | 7 | 66 | 22 |
| 3 | 22 | 52 | 16 | 3 |
| 4 | 45 | 51 | 4 | 6 |
| 5 | 35 | 62 | 2 | 1 |
Table text extracted from the original PDF; superscript letters are shown inline. The original table image is below.
View original table image
| Plasticity index% | Plastic limit% | Liquid limit% | Sample No. |
|---|---|---|---|
| 16.23 | 17.05 | 33.28 | 1 |
| 19.11 | 17.59 | 36.7 | 2 |
| 15.55 | 14.36 | 29.92 | 3 |
| 39.26 | 26.87 | 66.13 | 4 |
| 14.89 | 19.89 | 34.67 | 5 |
Table text extracted from the original PDF; superscript letters are shown inline. The original table image is below.
View original table image
References
4 in the original paper- Al-Rawi YT, Al-Sayyab AS, Al-Jassim JA, TamarAgha MY, Al-Samrrai AI, Karim SA, et al. New name for some of the Middle Miocene-Pliocene formation of Iraq (Fatha, Injana, Mukdadiya, and Bai Hassan Formation). Geo. Jour. Baghdad, Iraq: Mineral Investigation. 1992;25(1):01-18.
- African Organization for Standardization (ARS). African standard of compressed earth blocks. ARS 674:1996, ARS 671; c1996.
- Picard, MD. Classification of Fine-grained Sedimentary Rocks. Petrology of Oolitic Ironstones of Ashumaysi Formation. 1971;41(1-4):179-195.
- Fouad SFA. Tectonic map of Iraq, Scale 1:1000 000, 3rd edition, 2012. Iraqi Bulletin of Geology and Mining. 2015;11(1):01-07.
Cited by 1
From OpenAlex, OpenCitations and reference lists read by Scinovex
- Effect of sand stone percent in row material of fair bricks production on the compressive strength
Solin Nooraldeen Abd-alrahman Alhamawandi, Aomed Tokmachy · International Journal of Geography Geology and Environment · 2024
Bricks are one of the most important building materials that have played a major role in the global urban renaissance, especially in Iraq, where recent decades have witnessed an increasing demand for improving the quality of bricks to keep pace with harsh climatic conditions that include high temperatures in the summer and extreme cold in the winter. However, the brick industry in some areas suffers from technical problems that affect the quality of the product, most notably the problem of verification resulting from the high proportions of sand in the raw materials, according to soil tests. I