
Research article · 2024 · Full text
International Journal of Geography Geology and EnvironmentEffect of sand stone percent in row material of fair bricks production on the compressive strength
Volume 6(2) · Pages 220–225 · DOI: 10.22271/27067483.2024.v6.i2c.314 ↗
Research areasInnovations in Concrete and Construction Materials
Abstract
Author-writtenBricks are one of the most important building materials that have played a major role in the global urban renaissance, especially in Iraq, where recent decades have witnessed an increasing demand for improving the quality of bricks to keep pace with harsh climatic conditions that include high temperatures in the summer and extreme cold in the winter. However, the brick industry in some areas suffers from technical problems that affect the quality of the product, most notably the problem of verification resulting from the high proportions of sand in the raw materials, according to soil tests. In light of these challenges, the current study aims to reduce the proportion of sand in manufactured bricks and study the effect of this on the compressive strength and other mechanical properties of bricks, including longitudinal and volumetric shrinkage, water absorption rate, and efflorescence. It also seeks to determine the optimal proportion of sand and thermal manufacturing conditions to achieve bricks with better specifications in terms of performance and durability. The results of the study showed that reducing the proportion of sand to 15% and 10%, with the adoption of a firing temperature of 950 °C, provides improved mechanical properties for bricks, which contributes to enhancing their resistance to harsh climatic factors. These results provide a practical guide for developing the brick industry locally, with the potential for wider scale to improve production efficiency.
Summary
Source-checkedPlain-language reading of the full paper, prepared with AI and checked against the text. Each point links to the authors' own words.
Why it matters
- Bricks are critical building materials in Iraq, where there is a growing need for higher quality to withstand extreme seasonal temperature variations. View evidence ↗
- The local brick industry faces quality issues, specifically a phenomenon called verification (vitrification) caused by excessive sand in the raw materials. View evidence ↗
- Vitrification deteriorates brick quality by altering clay minerals at high temperatures, which negatively impacts mechanical properties like pressure resistance and water absorption. View evidence ↗
The question
- The study aims to determine how reducing the sand proportion in bricks affects their compressive strength and other mechanical properties. View evidence ↗
- The research seeks to identify the ideal sand ratio and firing temperature to maximize brick performance and durability. View evidence ↗
What they did
- Soil samples were collected from the Chamchamal district, located approximately 64 km from Sulaymaniyah city. View evidence ↗
- The experiment used 36 red clay brick samples divided into three groups of 12, each with a different sand ratio. View evidence ↗
- The three mixtures tested were 25% sand (N), 15% sand (L), and 10% sand (M), all fired at 950 °C. View evidence ↗
- Water absorption was measured, with results of 12.52% for Mixture N, 15.32% for Mixture L, and 16.1% for Mixture M. View evidence ↗
What they found
- Bulk density increased as sand content decreased, ranging from 1.689 for Mixture N to 1.714 for Mixture M. View evidence ↗
- Firing the samples at 950 °C caused the brick color to change from dark brown to light reddish brown. View evidence ↗
- All tested brick samples exhibited only a slight degree of efflorescence. View evidence ↗
What it means
- The authors conclude that reducing sand to 10% or 15% and firing at 950 °C improves mechanical properties and resistance to harsh climates. View evidence ↗
- The study identifies the optimal sand-soil ratio as 15% at a firing temperature of 950 °C for improved overall properties. View evidence ↗
Figures & tables
From the original paper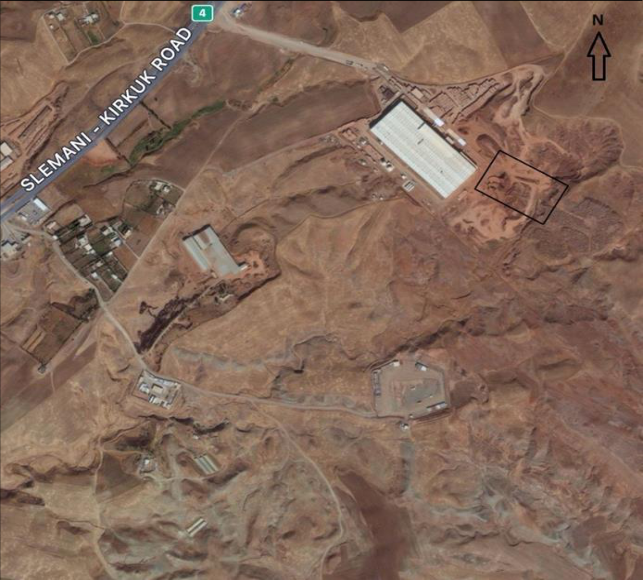 Figure 1
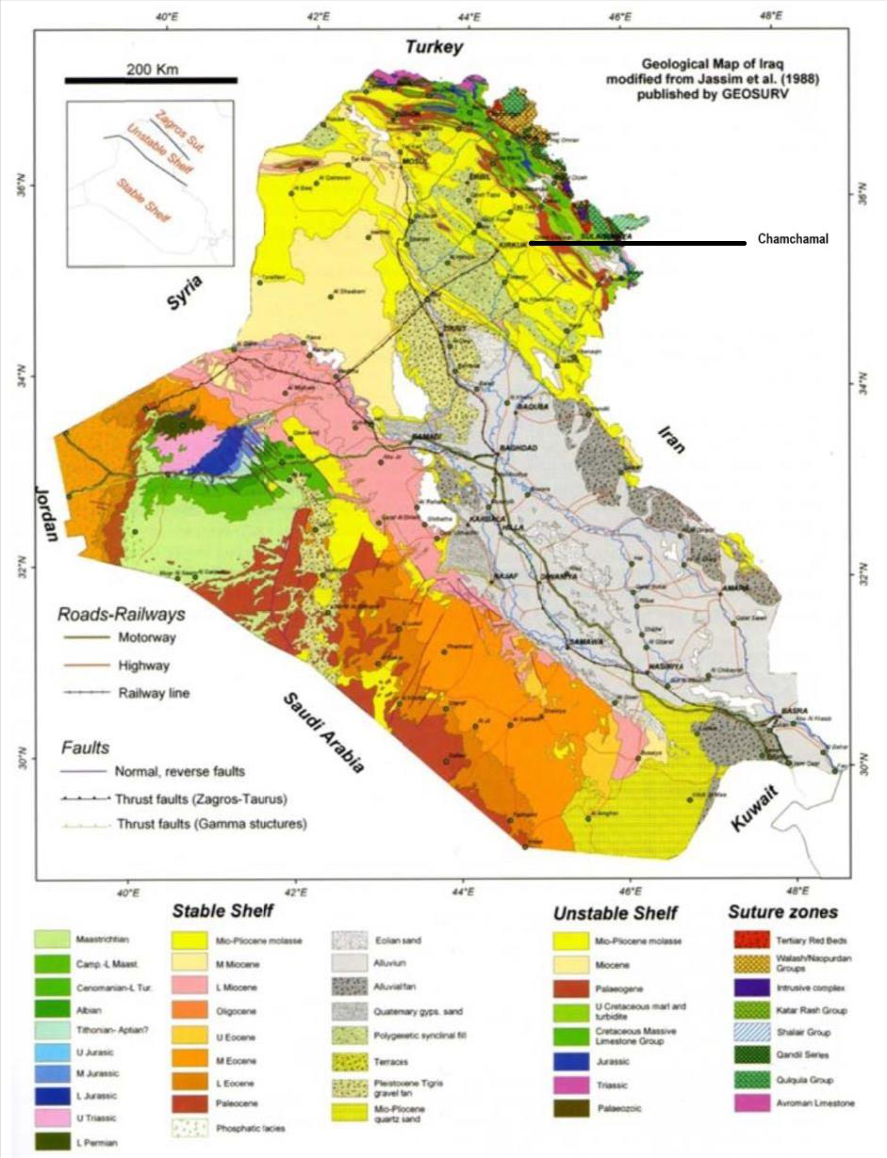 Figure 2
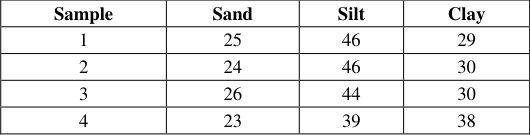 Table 1
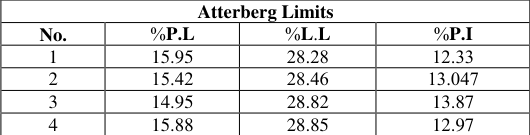 Table 2
 Table 3
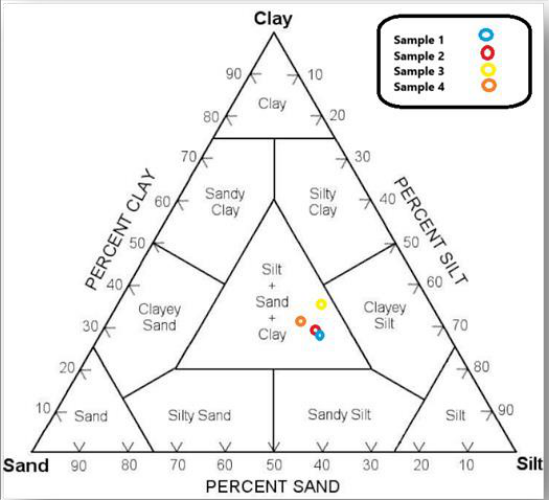 Figure 3
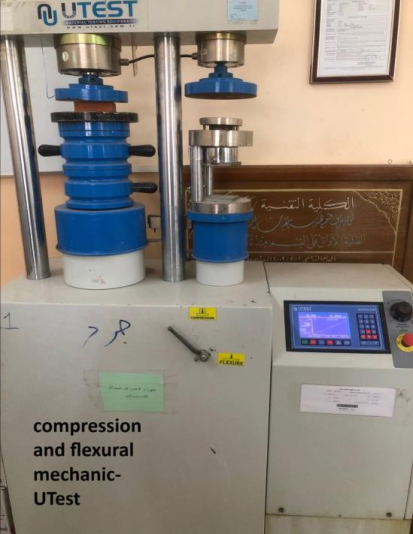 Figure 4
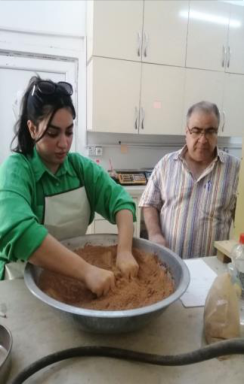 Figure 5
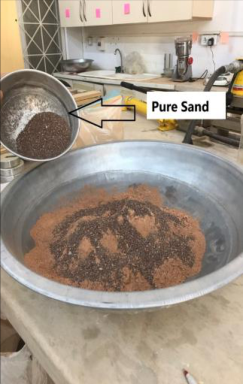 Figure 5
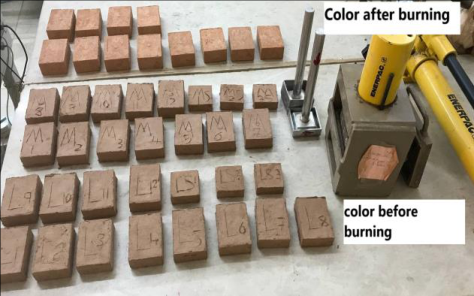 Figure 6
Introduction
The economies of countries are closely linked to their natural resources, as raw materials are a major factor in supporting their industrial and construction sectors. Clay stands out as one of these important natural resources, which effectively contributes to achieving the urban and industrial renaissance in many countries (Awad and Al-Qwaidi, 2021) [4] . With the rapid development of infrastructure, reliance on clay has increased as a basic material in the manufacture of bricks, which are widely used in construction and building to meet the increasing requirements of luxury and comfort, especially in housing construction. Bricks are preferred for construction in Iraq because of their resistance to weather condition (BI, 2014) [5] . However, red clay bricks, especially those produced in factories located near the study area, suffer from multiple technical challenges, the most prominent of which is the Vitrification phenomenon. This phenomenon of vitrification leads to a significant deterioration in the quality of the brick during use, as a result of the changes that occur to clay minerals when exposed to high temperatures, which negatively affects the physical and mechanical properties of bricks, such as pressure resistance, absorption rate and shrinkage, Color, Water absorption Scientific studies and laboratory experiments indicate a direct relationship between the degree of verification and the percentage of sand in the soil used in the manufacture of bricks. The effect of different sand ratios on the main properties of bricks, including water absorption rate, efflorescence, longitudinal and volumetric shrinkage, and compressive strength, was analyzed. The results concluded that the optimum sand-soil ratio is 15% with an optimum firing temperature of 950 °C, which achieves bricks with improved mechanical and physical properties.
Materials and Methods
Materials and Methods
Sampling and Location
Samples were selected from different locations within the sector shown on the Google Earth map in (Figure -1), which shows the geographical locations of the collected sample. The locations were carefully identified near the laboratories in the study area (chamchamal), where samples were collected by digging the soil to a depth of more than three meters using an excavator, with the complete removal of the surface soil to ensure obtaining a pure and uncontaminated sample. The study area is located within the district of Chamchamal, southwest of Sulaymaniyah Governorate, about 64 km from the center of Sulaymaniyah city. The coordinates of the sites were determined using the Universal Geographical System (UTM), where they are located within latitudes (35° 38′ 35″) to (35° 32′ 2″) north, and longitudes (45° 12′) to (44° 46′) east. The sector shown in (Figure -2) was carefully selected, as it is adjacent to a factory specialized in brick manufacturing, which ensures that the samples are consistent with the study requirements and that raw materials are available close to industrial sites, highlighting the direct relationship between local resources and the quality of the final product.
Laboratory Tests
The samples selected from the field work were transferred to the construction laboratory at the Northern Technical University / Kirkuk for accurate laboratory analyses. At first, the samples were dried at a temperature of (105 °C), then the grinding process was carried out to convert the samples into fine-grained powder. After that, the division process was carried out using the quadrupole division method, where the sample is placed on a flat surface to form a conical body, then a straight tool is used to sort the sample into four equal sections, and the dimensions of the opposite quarters are determined until the required weight is reached according to the specifications approved in (4).
The following tests were carried out
Chemical tests: included XRD (X-ray analysis) and XRF (X-ray spectroscopy) techniques, which aim to determine the mineral composition of the sample.
Geotechnical tests: included volume analysis, specific gravity, and Atterberg Limit, which provide basic information about the properties of the soil. Chemical analyses: which aim to examine the chemical composition of the samples and study its effect on the properties of the resulting bricks.
Brick sampling
Based on the results of soil tests, Grain size analysis of the study area samples (Table-1) Grain size analysis is the first and most important physical properties by which the quality and success of the manufacturing process of the produced bricks can be ensured (Mohammed, 2024) [13] . The sieve examination was conducted in the laboratories of the Northern Technical University / Kirkuk according to the international standard (ASTM-D, 422, 2004) [12] (Mohammed, 2024) [13] , the texture classification of the sample, and the Atterberg limits procedure according to (ASTM D4318-17, 2005) [3] (Bahjat, 2024) [11] (Table -2), 36 red clay bricks with dimensions of (86×64×30 mm) were prepared to study the following tests after firing at a temperature of (950 °C):
Color and exterior shape
One of the first physical properties to be observed that reflects the geochemistry of clay rocks is color. The color after firing depends on the chemical composition of the soil and the oxides it contains, and temperature is no less important than them, as it has a clear effect on the color change (Awad, 2021) [4] . This brown color is due to the reflection of the presence of iron oxides that appear in the form of granules that cover the clay minerals. The reason for the color change after firing brick samples is mainly due to the reactions that occur during firing between the components of the raw materials. The color of the specimens changed from dark brown to light reddish brown after being exposed to temperatures of 950 °C.
Water absorption
The percentage of water absorbed is the amount of water that fills the spaces and pores in the body of the brick sample. The percentage of water absorption (Water absorption%) increases with the increase in pores and cracks formed in the body of the brick after burning, which leads to the absorption of a higher percentage of water. The models bearing the symbol (N) showed that their absorption rate was (12.52%), those bearing the symbol (L) showed that their absorption rate was (15.32%), and the models bearing the symbol (M) showed that their absorption rate was (16.1%).
Bulk density
The bulk density is the ratio of the weight of the dry sample after firing to the volume of the total sample, which includes the volume of the solid material, with the volume of pores and voids (apparent on the surface of the brick and hidden within its structural composition). It can be described as the weight of the claystone in a given volume (Awad, 2021) [4] . Its unit is (Kg/m₃) or (g/cm₃) and can be expressed by the following equation: -Bulk density = (total weight) / (volume of brick) Typical values of dry bulk density range from 1.2 g/cm3 to 1.9 g/cm3. Through laboratory analyses, the samples bearing the symbol (N) showed a density rate of (1.689), the samples bearing the symbol (L) showed a density rate of (1.695), and the samples bearing the symbol (M) showed a density rate of (1.714).
Efflorescence
They are salt deposits that appear on the outer surface of the brick, resulting from the movement of dissolved salts due to moisture acquired from the atmosphere or direct contact with water. They have a direct relationship with permeability, as the salts move to the surface through the pores depending on the amount of their solubility, the brick's ability to absorb water, the number of apparent and internal pores in the brick, the surface evaporation rate, and the amount of moisture. The examination results showed that all samples had a slight degree of efflorescence.
Compressive strength
It is the maximum endurance of the body before it fails due to the pressure force applied to it. It is one of the important tests in the field of brick manufacturing, which is considered one of the important mechanical properties that determine the resistance of the brick to fracture. Its importance begins from the stage of transporting the manufactured brick from the manufacturing plants to the use sites. The results of the mechanical tests showed that the bricks bearing the symbol (N), which were the raw material taken from factories spread in the study area, had the least compressive resistance. The compressive resistance was calculated using the (Comression and flexural machiec) device, as its average was (17.65 MPa). The two laboratorymodified models were the most resistant. The model bearing the symbol (L) had an average compressive resistance of (34.74 MPa), while the one bearing the symbol (M) had an average compressive resistance of (38.85 MPa).
Results and Discussion
According to the (Picard, 1971) [14] diagram shown in (Figure -3), it was found that the selected samples are suitable for brick making. presents the results of particle size analysis of the raw materials taken from the vicinity of the factories in the region. The percentage of sand in the samples ranges between 25%, the percentage of silt is 44%, and the percentage of clay is 31%. Based on these samples, the soil can be classified between the plasticity limits (14.95%) and the plasticity limits (15.95%).
Table (3) presents the results of the chemical tests required for the soil samples. The chemical analyses of all samples showed that the percentage of calcium carbonate ranged between 0.007% and 0.012%, while the percentage of total dissolved salts ranged between 0.0093% and 0.012%. The pH value ranged from 8.36 to 8.55, the organic matter content ranged from 0.96% to 0.27%, while the gypsum content ranged from 0.115% to 0.038%. From the results obtained, we concluded that the organic matter content in the soil is very weak according to classification (6), and the soil has a high basicity based on (7), and has a low calcium carbonate content. We also found that the soil is classified between non-gypsum and very weak gypsum soil according to classification (8), and that the percentage of soluble salts is less than 5% and does not pose a risk due to its availability according to (9).
Sand ratio in the formation of clay brick samples
To study the effect of sand ratio on the geotechnical and physical properties of clay bricks, 36 samples of red clay bricks were prepared, divided into 3 groups, each group containing 12 samples with different sand ratios. The mixtures were divided as follows: Mixture 1 (N): sand ratio 25% and 75% of fine materials. Mixture 2 (L): sand ratio 15% and 85% of fine materials. Mixture 3 (M): sand ratio 10% and 90% of fine materials. The samples were fired at a temperature of 950 °C. After firing, the resulting bricks were tested using the following tests: water absorption, dry density, compressive strength, volumetric and longitudinal changes. [15] .
Fig 3:
Textural classification of samples taken from the study area according to the classification (Picard, 1971) [14] .
Conclusions
The relationship between the sand ratio and the physical and mechanical properties of clay bricks was studied. Based on the study, the following conclusions can be drawn:
1. The study showed that water absorption increases with the increase in fineness content in the raw materials from which we make bricks. 2. The total density increases with the decrease in the percentage of sand in the samples. 3. Clay bricks produced with 10% and 15%sand are the best and most suitable in terms of improving compressive strength, as they achieved the highest compressive strength value reaching (34.74 MPa), (38.85 MPa). 4. There is a possibility of increasing the compressive strength of the brick by reducing the percentage of sand. 5. The bulk density increases with the increase in fine content, the samples bearing the symbol (N) showed a density rate of (1.689), the samples bearing the symbol (L) showed a density rate of (1.695), and the samples bearing the symbol (M) showed a density rate of (1.714).
Figures and tables from the paper
| Sample | Sand | Silt | Clay |
|---|---|---|---|
| 1 | 25 | 46 | 29 |
| 2 | 24 | 46 | 30 |
| 3 | 26 | 44 | 30 |
| 4 | 23 | 39 | 38 |
Table text extracted from the original PDF; superscript letters are shown inline. The original table image is below.
View original table image
| Atterberg Limits | — | — | — |
|---|---|---|---|
| No. | %P.L | %L.L | %P.I |
| 1 | 15.95 | 32.32 | 33.11 |
| 2 | 34.33 | 32.32 | 31..31 |
| 3 | 14.95 | 28.82 | 13.87 |
| 4 | 15.88 | 28.85 | 12.97 |
Table text extracted from the original PDF; superscript letters are shown inline. The original table image is below.
View original table image
| NO. | pH | CaCO₃ mg/kg | Organic Matter (O.M %) | Gypsum CaSO₄.2H₂O % | Total Dissolved Salts(T.D.S) % |
|---|---|---|---|---|---|
| 3 | 8.558 | ..0107 | 0.759 | 0.057 | ....00 |
| 3 | 8.399 | 0.0215 | 0.276 | 0.115 | ...332 |
| 1 | 8.467 | 0.00999 | 0.966 | 0.053 | ..00933 |
| 3 | 8.363 | 0.00707 | 0.828 | 0.038 | 0.0099 |
| Avg | 8.44675 | 0.0262 | 0.70725 | 0.06575 | 0.0105 |
Table text extracted from the original PDF; superscript letters are shown inline. The original table image is below.
View original table image
References
15 in the original paper- Al-Bayati H, Fahdil AM. The validity of Atiayan Injana for the manufacture of mud bricks in Khanoka/Salahaddin Governorate. Master's thesis, Faculty of Sciences, Tikrit University; 2011. 105 p. (In Arabic).
- Al-Hakim FA. Assessment of some clay from Neogene for ceramic purposes-N Iraq. Unpublished MSc thesis, University of Baghdad; 1998. (In Arabic).
- ASTM International. ASTM D4318-17: Standard test methods for liquid limit, plastic limit, and plasticity index of soils. Report 04, 1-14; 2005. https://doi.org/10.1520/D4318-17.
- Awad AM, Awadh SM. Manufacturing perforated and ordinary bricks using Injana claystone exposed in the middle of Iraq. Iraqi Geological Journal. 2021;11:22.
- Board of Investment. List of Licensed Projects in Kurdistan Region. Studies and Information Department, Directorate of Information. Licensed projects: Under implementation from 2006-08-01 to 2014-01-12; 2014.
- Grim RE. Clay mineralogy. International Series in the Earth and Planetary Sciences. McGraw-Hill, London; 1962. 422 p.
- Lateef ASA. Report on the regional geological mapping of Hemrin Range. GEOSURV Int. Rep. No. 772; 1976.
- Maala K, Sood Q, Khames D, Jabo B, Al-Saade N, Khadhum M. Laboratory assessment for utilization of Neogene mudstones in manufacturing of building bricks. Iraqi Bulletin of Geology and Mining. 2007;3(2):1-15.
- Merza TA, Mohyaadldin M. Manufacture of brick tiles from local raw materials, N & NE Iraq. Zankoy Sulaimani Journal. 2005;8(1):31-45.
- Merza TA, Faraj RQ. Mineralogical and industrial assessment of clay from parts of the folded zone in Kurdistan region. Zankoy Sulaimani Journal. 2017;13(1):79-97.
- Bahjat RS. Effect of nano calcium carbonate (NanoCaCO₃) and polypropylene fiber on the strength of compressed earth blocks. Master's thesis, College of Engineering, University of Kirkuk; 2024. 84 p.
- ASTM International. ASTM D422-63: Standard test method for soil particle size analysis. West Conshohocken, PA: ASTM International; 2004.
- Mohammed AK, Mohammed AA. Evaluation of geotechnical characteristics of surface soil for compressed earth block industry in Shuwan area, northern Kirkuk. 2024;6(1):224. DOI: https://doi.org/10.22271/27067483.2024.v6.i1d.224.
- Picard MD. Classification of fine-grained sedimentary rocks. Journal of Sedimentary Research. 1971 Mar 1;41(1):179-195.
- Jassim A, Festenstein H. Identification of spermatids with aprotruded tails in human semen by monoclonal antibodies and electron microscopy. InMolecular and Cellular Endocrinology of the Testis Raven Press New York; 1988. p. 203-208.
Cited by 1
From OpenAlex, OpenCitations and reference lists read by Scinovex
- Effect of sand particle size on the thermal effusivity of clay-admixed cement mortar bricks ↗
Aubain Djouatsa Donfack, Emmanuel Yamb Bell, Malick Diakhaté, Yves Jannot · Scientific Reports · 2026
Abstract This work aim to study the effect of sand granulometry on the thermal effusivity of blocks made by cement mortar mixed with clay. Three granular classes of sand (\(\:{E}_{2}\)(0.08/0.5mm), \(\:{E}_{3}\) (0.5/1.6mm), \(\:{E}_{4}\) (1.6/2mm)) and clay are used. The chemical characterization of the clay and the particle size test of the clay and sand were carried out according to the…
❝ 0PDF