
Research article · 2023 · Full text
International Journal of Statistics and Applied MathematicsThe use of matrices in hotel management
Volume 8(1) · Pages 75–80 · DOI: 10.22271/maths.2023.v8.i1b.931 ↗
Research areasConsumer Retail Behavior StudiesCustomer Service Quality and LoyaltyConsumer Market Behavior and Pricing
Abstract
Author-writtenHotel rooms are the primary inventory kept by hotel managers. The demand for hotel rooms, the number of rooms in demand and the number of days the rooms are in demand forms the hotel’s matrix of demand. We use this matrix of demand to determine the level of patronage of the hotel and compare the profitability of two or more hotels.
Summary
Source-checkedPlain-language reading of the full paper, prepared with AI and checked against the text. Each point links to the authors' own words.
Why it matters
- Hotel rooms serve as the primary inventory that managers must track and manage. View evidence ↗
- In the context of hotel demand matrices, zero entries are significant because they indicate low or nonexistent patronage. View evidence ↗
The question
- The study aims to use a demand matrix to determine a hotel's patronage level and compare the profitability of multiple hotels. View evidence ↗
What they did
- The demand matrix is constructed using three variables: the demand for rooms, the number of rooms requested, and the duration of that demand. View evidence ↗
- The model assumes a fixed total number of rooms, which are categorized into subunits based on features like bed type, occupancy, and services. View evidence ↗
- The authors apply their model to a numerical example comparing two hotels, A and B, located in Benin City. View evidence ↗
- Hotel A's inventory includes 15 single rooms (₦4000), 10 double rooms (₦9000), 10 queen rooms (₦15000), 10 king rooms (₦15000), 4 suites (₦20000), and 1 presidential suite (₦30000). View evidence ↗
What they found
- After five days, Hotel A had 58 zero entries and Hotel B had 61 zero entries in their demand matrices. View evidence ↗
- Because it had fewer zero entries, Hotel A is determined to have had higher patronage than Hotel B during the review period. View evidence ↗
What it means
- The authors conclude that the demand matrix serves as an effective tool for hotel managers to assess customer inflow and patronage levels. View evidence ↗
- The authors state that a hotel with more zero entries in its demand matrix has lower patronage compared to one with fewer zero entries. View evidence ↗
Visual summary
1 visualsIllustrations explain the paper; they do not show study data.
Conceptual Demand Matrix
AI-generated conceptual illustration (hotel room layout and occupancy grid). It explains the idea and does not show study data.
View source evidence ↗Figures & tables
From the original paper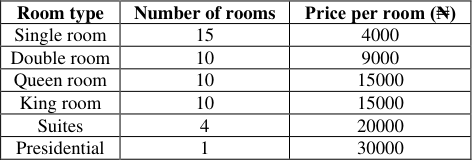 Table 1
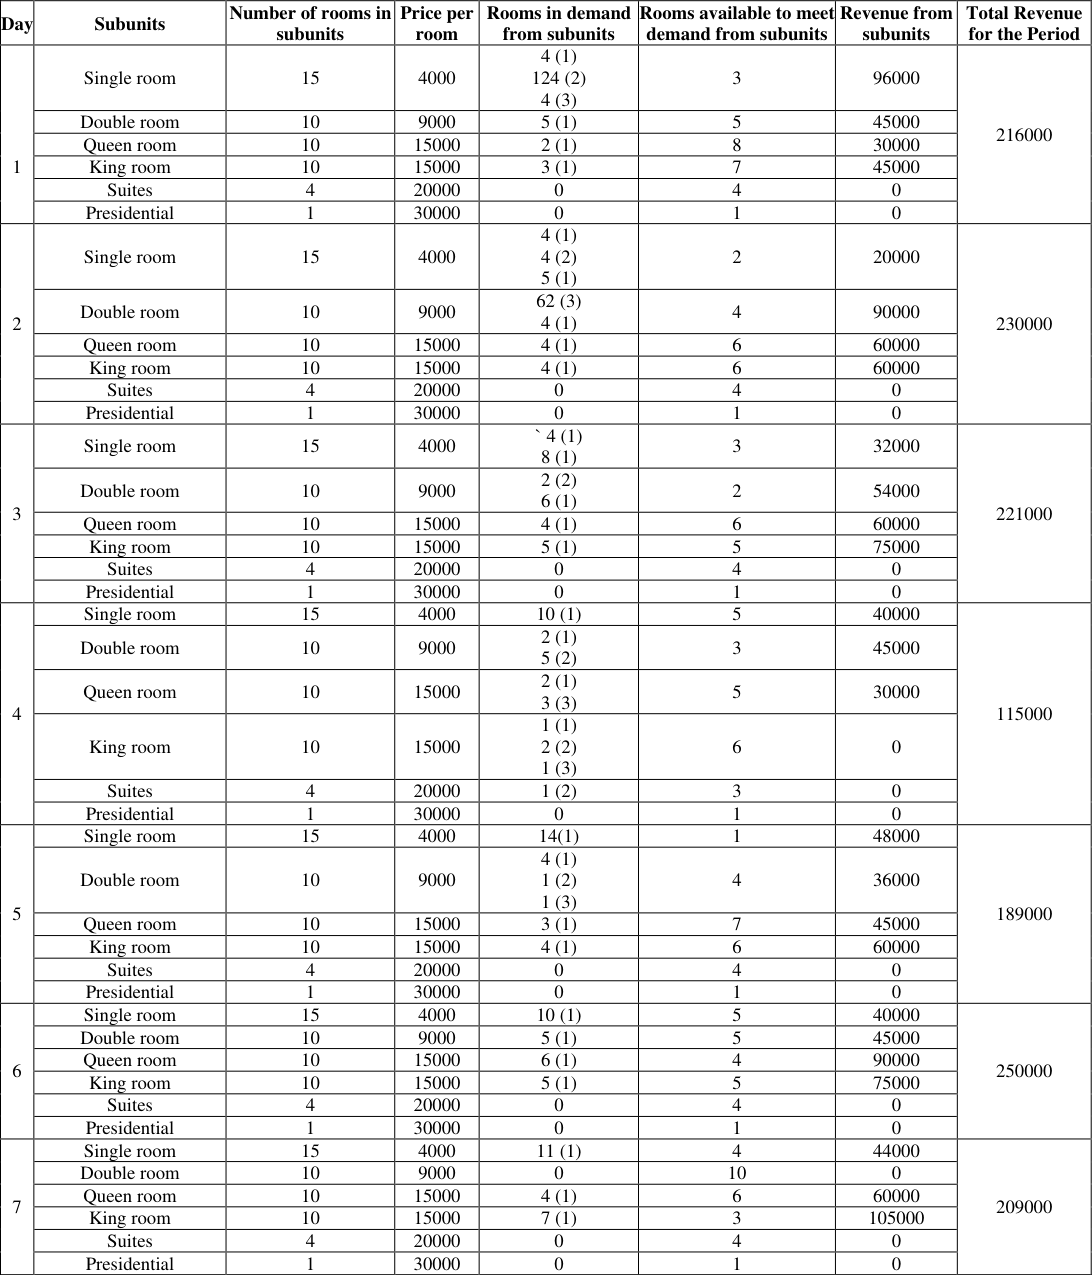 Table 2
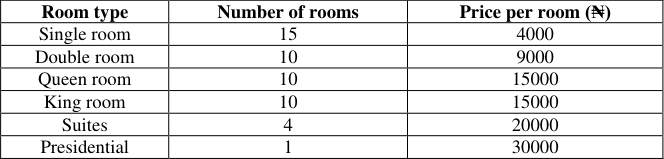 Table 3
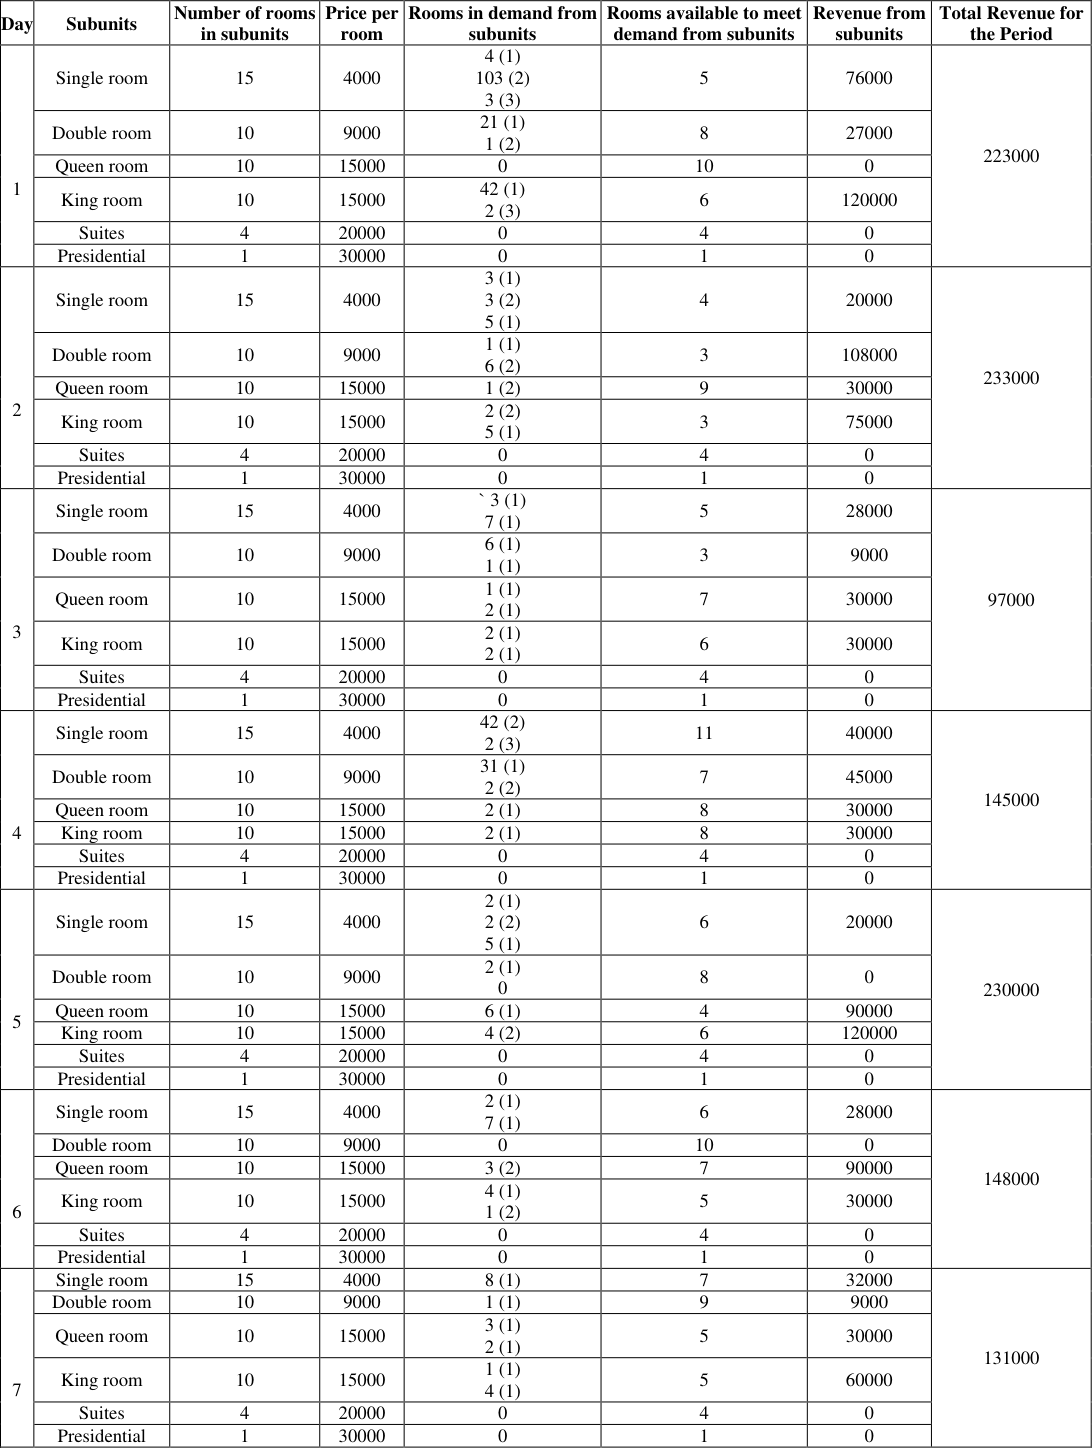 Table 4
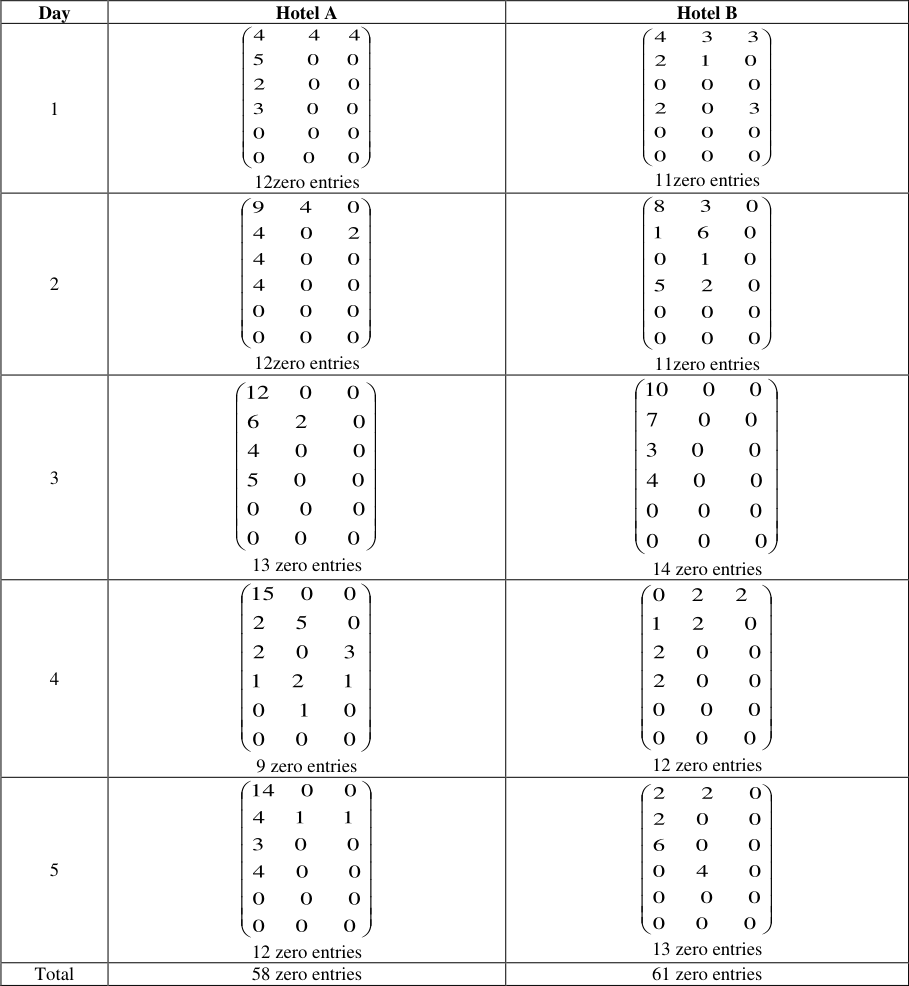 Table 5
Introduction
Matrix is a rectangular array of numbers arranged in rows and columns. For example the matrix Has m rows and n columns and is described as an n m matrix. In this work, we use the matrix notation to represent the number of rooms in demand and how long they are in demand. Recall that the number of rooms in a hotel is fixed and subdivided into subunits [1,2,3,4] . Some common subunits in Nigeria include; single rooms, double rooms, standard rooms, kings rooms, queens rooms, suites, presidential etc. also, the daily demand for rooms in the hotel cut across all the subunits of the hotel, such that, the total number of rooms in demand in a day is the sum of demand from all sub units. The zero entries indicate no patronage, while a nonzero entry indicate room (s) in demand. The hotel manager is concerned about the entries of the matrix, as zero entries indicate no or low patronage. This work is focused on the rooms in a hotel. The total number of rooms in the hotel is fixed and are classified into subunits based on the type of bed, number of occupants, number of beds, décor, specific furnishing or features, views and service provided. Some common subunits in hotels according to setupmyhotel.com are; 1 k Single Room: A room with one or more beds that is allocated to one person. The size of the room or area measures 37𝑚 Villa Room: This is a specific type of accommodation that can be found in some resort hotels. It's a kind of standalone residence that allows hotel guests more privacy and space. This measure 100𝑚 2 to 150𝑚 2 . 15 k Smoking/ Non-smoking Room: To reduce the effects of second hand smoke exposure on non-smoking guests, several hotels offer both smoking and non-smoking rooms. Note that the number of rooms in each subunit is fixed and from time to time. Some rooms maybe converted from one subunit to another depending on demand.
Description of the model
The total number of rooms K in a hotel is fixed and is
. The number of rooms in each subunit is also fixed. The price for a room in each subunit is
. The rooms in each subunit is further divided into rooms in demand and rooms available to meet demand. The total revenue for the day is the sum of revenue from each subunit. Table 1 shows the subunits, price of rooms in each subunit, rooms in demand and rooms available to meet demand.
| Room type | Number of rooms | Price per room (₦) |
|---|---|---|
| Single room | 15 | 4000 |
| Double room | 10 | 9000 |
| Queen room | 10 | 15000 |
| King room | 10 | 15000 |
| Suites | 4 | 20000 |
| Presidential | 1 | 30000 |
Table text extracted from the original PDF; superscript letters are shown inline. The original table image is below.
View original table image
Description and Derivation of the Demand Matrix
The demand matrix tells us the number of rooms from each subunits that is in demand and the number of period(s) the room(s) will be in demand. If the total number of rooms in a hotel is K and there are n subunits in the hotel, then
In matrix form, the rooms in demand will be given The dimension of the matrix depends on the room(s) with the highest period of demand. In the example above, the highest period of demand is 4 days, so the demand matrix is 4 n . If it is 5days then the dimension of the demand matrix will be 5 n .
The total revenue function for a non regular fixed lifetime inventory like the hotel was obtained in [5] and is given by Revenue
If in addition to the example above for subunit
Our interest is to use the matrix notation to represent the rooms in demand. Hotel managers always want the entries in the matrix to be nonzero, as zero entry imply no patronage or low level of patronage.
Numerical Example
We shall now compare the level of patronage between two hotels A and B in Benin City having the set of subunits. From Table 5, hotel A has 58 zero entries after five days and hotel B has 61 zero entries after five days, hence hotel A had more patronage in the period under review.
Conclusion
The demand matrix is used by hotel managers as a tool to determine their level of patronage or customers inflow. It is the desire of hotel managers that the entries of the demand matrix should be non-zero entries, as a zero matrix or almost zero matrix will indicate no patronage or low patronage. Also, the demand matrix can be used to compare the level of patronage (demand) between two hotels. The hotel with the most zero entries in its matrix of demand has lower patronage (demand) when compared with the hotel with the least zero entries in its matrix of demand.
Figures and tables from the paper
| Day | Subunits | Number of rooms in subunits | Price per room | Rooms in demand from subunits | Rooms available to meet demand from subunits | Revenue from subunits | Total Revenue for the Period |
|---|---|---|---|---|---|---|---|
| 1 | Single room | 15 | 4000 | 4 (1) 124 (2) 4 (3) | 3 | 96000 | 216000 |
| Double room | 10 | 9000 | 5 (1) | 5 | 45000 | ||
| Queen room | 10 | 15000 | 2 (1) | 8 | 30000 | ||
| King room | 10 | 15000 | 3 (1) | 7 | 45000 | ||
| Suites | 4 | 20000 | 0 | 4 | 0 | ||
| Presidential | 1 | 30000 | 0 | 1 | 0 | ||
| 2 | Single room | 15 | 4000 | 4 (1) 4 (2) 5 (1) | 2 | 20000 | 230000 |
| Double room | 10 | 9000 | 62 (3) 4 (1) | 4 | 90000 | ||
| Queen room | 10 | 15000 | 4 (1) | 6 | 60000 | ||
| King room | 10 | 15000 | 4 (1) | 6 | 60000 | ||
| Suites | 4 | 20000 | 0 | 4 | 0 | ||
| Presidential | 1 | 30000 | 0 | 1 | 0 | ||
| 3 | Single room | 15 | 4000 | ` 4 (1) 8 (1) | 3 | 32000 | 221000 |
| Double room | 10 | 9000 | 2 (2) 6 (1) | 2 | 54000 | ||
| Queen room | 10 | 15000 | 4 (1) | 6 | 60000 | ||
| King room | 10 | 15000 | 5 (1) | 5 | 75000 | ||
| Suites | 4 | 20000 | 0 | 4 | 0 | ||
| Presidential | 1 | 30000 | 0 | 1 | 0 | ||
| 4 | Single room | 15 | 4000 | 10 (1) | 5 | 40000 | 115000 |
| Double room | 10 | 9000 | 2 (1) 5 (2) | 3 | 45000 | ||
| Queen room | 10 | 15000 | 2 (1) 3 (3) | 5 | 30000 | ||
| King room | 10 | 15000 | 1 (1) 2 (2) 1 (3) | 6 | 0 | ||
| Suites | 4 | 20000 | 1 (2) | 3 | 0 | ||
| Presidential | 1 | 30000 | 0 | 1 | 0 | ||
| 5 | Single room | 15 | 4000 | 14(1) | 1 | 48000 | 189000 |
| Double room | 10 | 9000 | 4 (1) 1 (2) 1 (3) | 4 | 36000 | ||
| Queen room | 10 | 15000 | 3 (1) | 7 | 45000 | ||
| King room | 10 | 15000 | 4 (1) | 6 | 60000 | ||
| Suites | 4 | 20000 | 0 | 4 | 0 | ||
| Presidential | 1 | 30000 | 0 | 1 | 0 | ||
| 6 | Single room | 15 | 4000 | 10 (1) | 5 | 40000 | 250000 |
| Double room | 10 | 9000 | 5 (1) | 5 | 45000 | ||
| Queen room | 10 | 15000 | 6 (1) | 4 | 90000 | ||
| King room | 10 | 15000 | 5 (1) | 5 | 75000 | ||
| Suites | 4 | 20000 | 0 | 4 | 0 | ||
| Presidential | 1 | 30000 | 0 | 1 | 0 | ||
| 7 | Single room | 15 | 4000 | 11 (1) | 4 | 44000 | 209000 |
| Double room | 10 | 9000 | 0 | 10 | 0 | ||
| Queen room | 10 | 15000 | 4 (1) | 6 | 60000 | ||
| King room | 10 | 15000 | 7 (1) | 3 | 105000 | ||
| Suites | 4 | 20000 | 0 | 4 | 0 | ||
| Presidential | 1 | 30000 | 0 | 1 | 0 |
Table text extracted from the original PDF; superscript letters are shown inline. The original table image is below.
View original table image
| Room type | Number of rooms | Price per room (₦) |
|---|---|---|
| Single room | 15 | 4000 |
| Double room | 10 | 9000 |
| Queen room | 10 | 15000 |
| King room | 10 | 15000 |
| Suites | 4 | 20000 |
| Presidential | 1 | 30000 |
Table text extracted from the original PDF; superscript letters are shown inline. The original table image is below.
View original table image
| Day | Subunits | Number of rooms in subunits | Price per room | Rooms in demand from subunits | Rooms available to meet demand from subunits | Revenue from subunits | Total Revenue for the Period |
|---|---|---|---|---|---|---|---|
| 1 | Single room | 15 | 4000 | 4 (1) 103 (2) 3 (3) | 5 | 76000 | 223000 |
| Double room | 10 | 9000 | 21 (1) 1 (2) | 8 | 27000 | ||
| Queen room | 10 | 15000 | 0 | 10 | 0 | ||
| King room | 10 | 15000 | 42 (1) 2 (3) | 6 | 120000 | ||
| Suites | 4 | 20000 | 0 | 4 | 0 | ||
| Presidential | 1 | 30000 | 0 | 1 | 0 | ||
| 2 | Single room | 15 | 4000 | 3 (1) 3 (2) 5 (1) | 4 | 20000 | 233000 |
| Double room | 10 | 9000 | 1 (1) 6 (2) | 3 | 108000 | ||
| Queen room | 10 | 15000 | 1 (2) | 9 | 30000 | ||
| King room | 10 | 15000 | 2 (2) 5 (1) | 3 | 75000 | ||
| Suites | 4 | 20000 | 0 | 4 | 0 | ||
| Presidential | 1 | 30000 | 0 | 1 | 0 | ||
| 3 | Single room | 15 | 4000 | ` 3 (1) 7 (1) | 5 | 28000 | 97000 |
| Double room | 10 | 9000 | 6 (1) 1 (1) | 3 | 9000 | ||
| Queen room | 10 | 15000 | 1 (1) 2 (1) | 7 | 30000 | ||
| King room | 10 | 15000 | 2 (1) 2 (1) | 6 | 30000 | ||
| Suites | 4 | 20000 | 0 | 4 | 0 | ||
| Presidential | 1 | 30000 | 0 | 1 | 0 | ||
| 4 | Single room | 15 | 4000 | 42 (2) 2 (3) | 11 | 40000 | 145000 |
| Double room | 10 | 9000 | 31 (1) 2 (2) | 7 | 45000 | ||
| Queen room | 10 | 15000 | 2 (1) | 8 | 30000 | ||
| King room | 10 | 15000 | 2 (1) | 8 | 30000 | ||
| Suites | 4 | 20000 | 0 | 4 | 0 | ||
| Presidential | 1 | 30000 | 0 | 1 | 0 | ||
| 5 | Single room | 15 | 4000 | 2 (1) 2 (2) 5 (1) | 6 | 20000 | 230000 |
| Double room | 10 | 9000 | 2 (1) 0 | 8 | 0 | ||
| Queen room | 10 | 15000 | 6 (1) | 4 | 90000 | ||
| King room | 10 | 15000 | 4 (2) | 6 | 120000 | ||
| Suites | 4 | 20000 | 0 | 4 | 0 | ||
| Presidential | 1 | 30000 | 0 | 1 | 0 | ||
| 6 | Single room | 15 | 4000 | 2 (1) 7 (1) | 6 | 28000 | 148000 |
| Double room | 10 | 9000 | 0 | 10 | 0 | ||
| Queen room | 10 | 15000 | 3 (2) | 7 | 90000 | ||
| King room | 10 | 15000 | 4 (1) 1 (2) | 5 | 30000 | ||
| Suites | 4 | 20000 | 0 | 4 | 0 | ||
| Presidential | 1 | 30000 | 0 | 1 | 0 | ||
| 7 | Single room | 15 | 4000 | 8 (1) | 7 | 32000 | 131000 |
| Double room | 10 | 9000 | 1 (1) | 9 | 9000 | ||
| Queen room | 10 | 15000 | 3 (1) 2 (1) | 5 | 30000 | ||
| King room | 10 | 15000 | 1 (1) 4 (1) | 5 | 60000 | ||
| Suites | 4 | 20000 | 0 | 4 | 0 | ||
| Presidential | 1 | 30000 | 0 | 1 | 0 |
Table text extracted from the original PDF; superscript letters are shown inline. The original table image is below.
View original table image
References
4 in the original paper- Izevbizua O, Apanapudor JS. Total revenue function for non-regular fixed lifetime inventory system. Africa Journal of Mathematics and Computer Sciences. 2019;12(2):24-30.
- Zhang H, Zhang J, Lu S, Cheng S. Modelling Hotel Room Price with Geographically Weighted Regression. International Journal of Hospitality Management. 2011;30(4):1036-1043.
- Radhamani B, Sivakuman B, Arivarignan G. A comparative study on replenishment policies for perishable inventory system with service Facility and multiple server vacation. India Journal of Operational Research. OPSEARCH. 2022;59(1):229-265.
- Tadj L, Djemili S. Joint optimization of the marketing and operations functions. India Journal of Operational Research. OPSEARCH. 2022;59(2):574-593.