
Research article · 2023 · Full text
International Journal of Agriculture and Food ScienceInfluence of electrical process parameters to inactivate microorganisms in orange juice by PEF technology
Volume 5(1) · Pages 126–132 · DOI: 10.33545/2664844x.2023.v5.i1b.131 ↗
Research areasMicrobial Inactivation MethodsRadiation Effects and DosimetryMagnetic and Electromagnetic Effects
Abstract
Author-writtenPulsed electric field (PEF) is a non-thermal/chemical food processing method for microbial inactivation in liquid food. This method finds its application to prolong the shelf-life of the seasonal fruit juices which helps to maintain the supply chain throughout the year. So, in the present study, the most commonly found microorganisms of Escherichia coli (E. coli), Staphylococcus aureus (S.aureus) and Saccharomyces cerevisiae (S.cerevisiae) inoculated in orange juice are considered. PEF impact on microbial inactivation based on the experimental results are analyzed with respect to pulse frequency, electric field intensity and treatment time. The PEF treatment conditions set for the investigation are as follows. Electric field intensity: - 5 kV/cm and 10 kV/cm; Pulse frequency: - 1, 10, 20 and 50 kHz; Pulse width: - 1.2 µs; Treatment time: - 10 s, 20 s, 30 s, 40s and 50s. A maximum inactivation of log10 reduction 2.62 ± 0.122 is observed when E. coli was subjected to 10 kV/cm at 50 kHz. Meanwhile S.cerevisiae and S.aureus are inactivated at the level of log10 reduction 2.4 + 0.16 and 2.1 + 0.9 respectively at the same treatment conditions when the treatment time is 50 s. It is also observed that the electric field intensity along the higher frequency enhances the inactivation level of microorganisms and the variations in the log reduction might be due to the different biological structure of the microorganisms.
Summary
Source-checkedPlain-language reading of the full paper, prepared with AI and checked against the text. Each point links to the authors' own words.
Why it matters
- Pulsed electric field (PEF) technology is used as a non-thermal and non-chemical method to inactivate microorganisms in liquid foods, which helps extend the shelf-life of seasonal fruit juices. View evidence ↗
- Because electric field intensity significantly impacts the cost of PEF generators, increasing pulse frequency or treatment time can potentially maintain energy levels while reducing the required electric field. View evidence ↗
The question
- The study aims to investigate how pulse frequency, electric field intensity, and treatment time influence the inactivation of microorganisms in orange juice. View evidence ↗
What they did
- The researchers used three types of microorganisms: Escherichia coli, Staphylococcus aureus, and Saccharomyces cerevisiae. View evidence ↗
- The experimental parameters included electric field intensities of 5 and 10 kV/cm, pulse frequencies of 1, 10, 20, and 50 kHz, a pulse width of 1.2 µs, and treatment times ranging from 10 to 50 seconds. View evidence ↗
- Experiments were performed in triplicate, results were reported as mean ± standard deviation, and ANOVA tests were used to determine statistical significance. View evidence ↗
What they found
- The highest inactivation level was observed for E. coli, achieving a log10 reduction of 2.62±0.122 when treated at 10 kV/cm and 50 kHz. View evidence ↗
- Across all tested frequencies, the Gram-positive bacterium S. aureus was less susceptible to inactivation than the Gram-negative bacterium E. coli. View evidence ↗
- Increasing the electric field intensity from 5 kV/cm to 10 kV/cm increased the E. coli population reduction from 2.45±0.01 to 2.63±0.122 log10. View evidence ↗
- The inactivation level at 50 kHz was significantly different (p < 0.02) compared to all other frequencies tested. View evidence ↗
- Temperature variations were 30 °C for E. coli and 29 °C for S. cerevisiae, leading the authors to conclude that the inactivation was not caused by thermal effects. View evidence ↗
- A higher inactivation of E. coli (2.45±0.11 log10) was achieved at a lower electric field (5 kV/cm) by increasing the pulse repetition frequency (PRF) to 50 kHz, compared to 2±0.045 log10 at 10 kV/cm and 20 kHz. View evidence ↗
What it means
- The authors conclude that increasing the pulse repetition frequency enhances microbial inactivation, allowing for effective treatment at lower electric field intensities. View evidence ↗
- The authors state that the mechanisms of how individual PEF parameters affect inactivation are not yet fully understood, indicating a need for further development in food industry applications. View evidence ↗
Visual summary
1 visualsIllustrations explain the paper; they do not show study data.
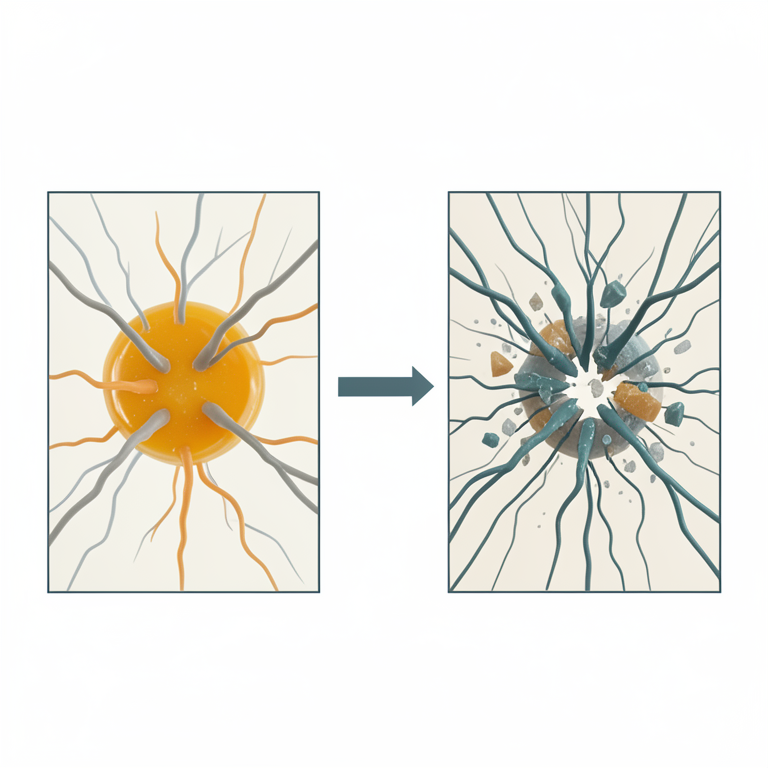
Trade-off between PRF and Electric Field Intensity
AI-generated conceptual illustration (orange juice containing E. coli bacteria in a pulsed electric field (PEF) treatment chamber). It explains the idea and does not show study data.
View source evidence ↗Figures & tables
From the original paper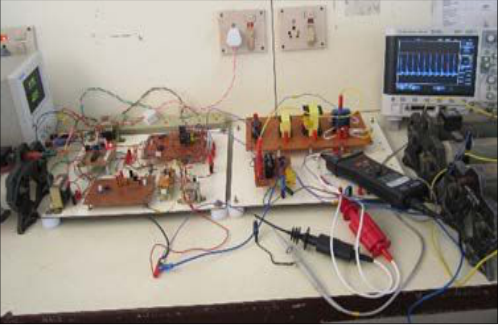 Figure 1
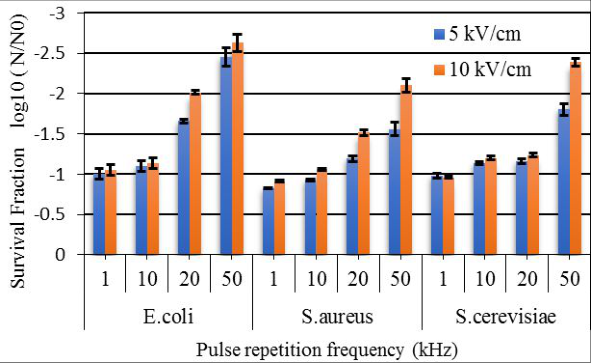 Figure 2
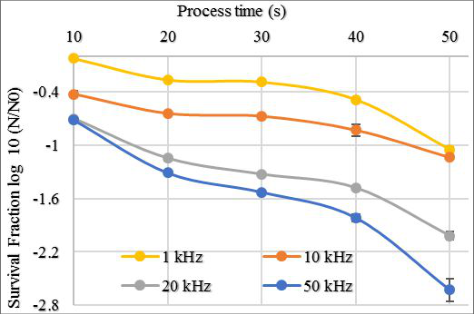 Figure 3
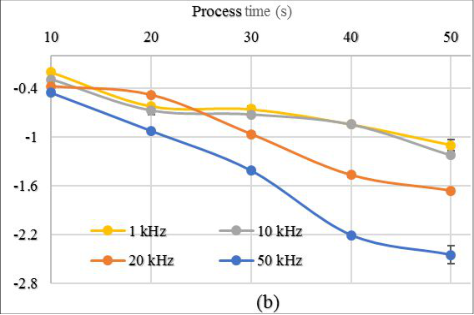 Figure 3
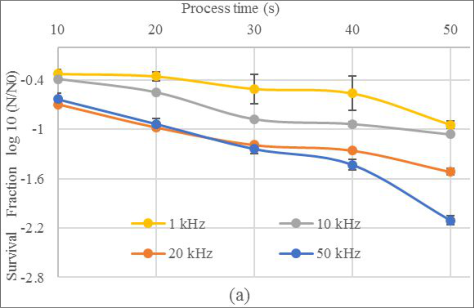 Figure 4
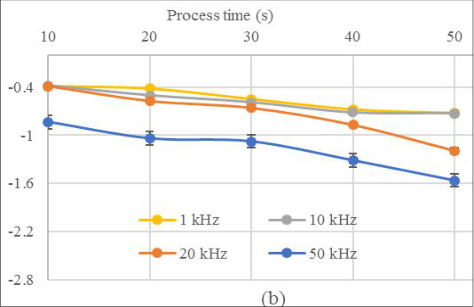 Figure 4
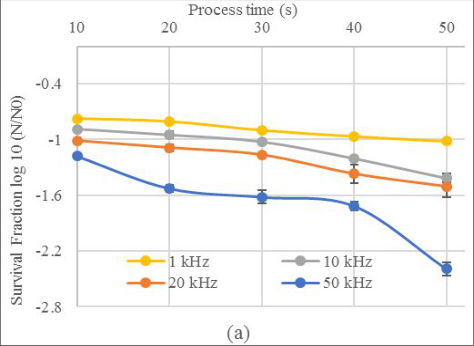 Figure 5
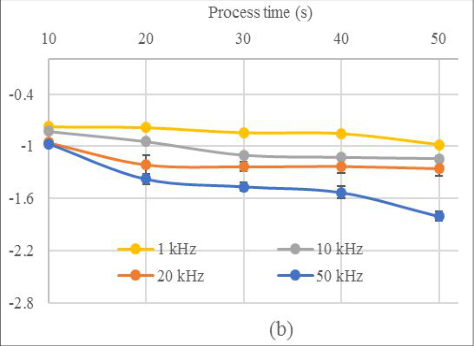 Figure 5
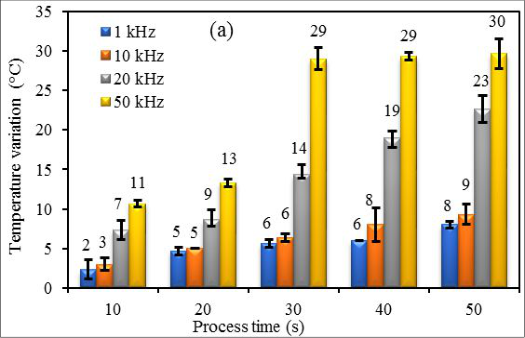 Figure 6
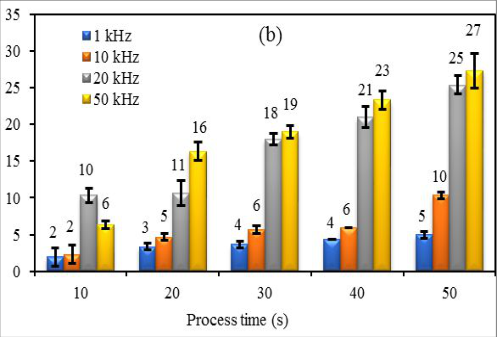 Figure 6
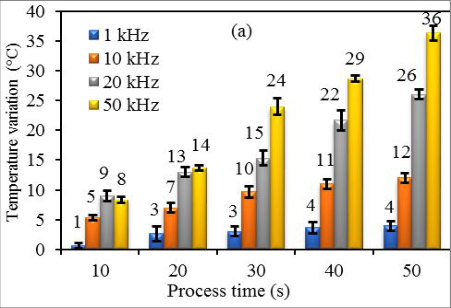 Figure 7
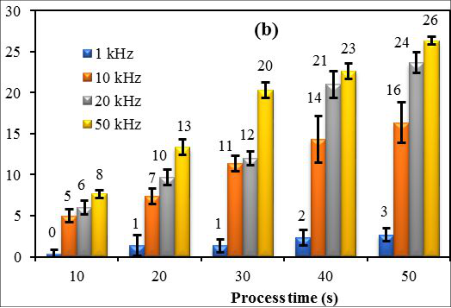 Figure 7
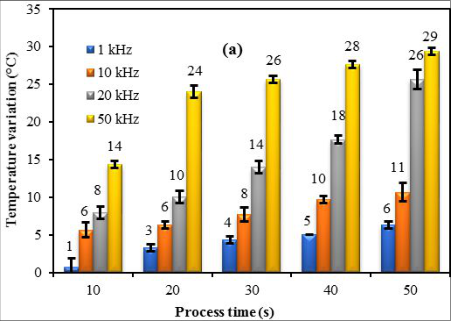 Figure 8
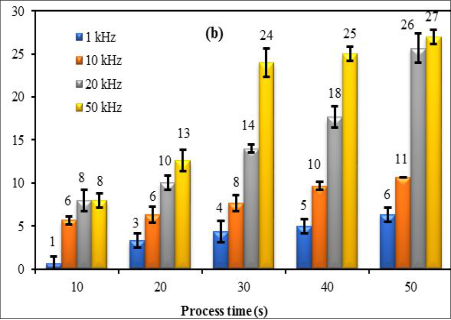 Figure 8
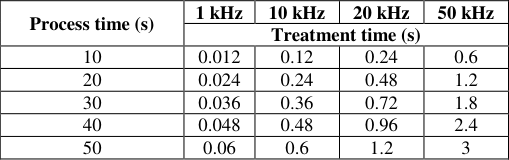 Table 1
Introduction
The fundamental mechanism of electroporation for microbial inactivation is associated with the charge also plays an important role in determining the efficiency of the PEF treatment [5] So, the direct influence on the efficiency of electroporation must be studied based on biological factors along with the PEF system parameters. The relationship between the cell membrane voltage and electric field intensity has been investigated in several research papers [6][7][8] . Most of the investigations in PEF processing stated that electric field intensity and the number of pulses applied can be the control parameters and only very few studies concentrate on pulse frequency in inactivation process [9][10][11] . The electrical energy delivered to the food product depends on electric field intensity, pulse frequency, pulse width and treatment time and these variables are correlated to each other to define the amount of electrical energy. Geveke [12] and applied electric field strength of 26 kV/cm over a frequency range of 15 to 70 kHz to inactivate E. coli k12 in apple juice and found 1.8 log 10 reductions. He again reported in another investigation that electric field strength of 0.5 kV/cm at 18 MHz can be used to inactivate microorganisms in liquids [10] . As the electric field intensity majorly influences the cost of the PEF generator, the electric field can be decreased by either increasing the pulse frequency of treatment time to maintain the required amount of electrical energy. From the literature, it is observed that the impact of the individual factor on the survival reduction cannot be parsed out in PEF technology for food processing [13][14][15] . Prokaryotic type (Gram-negative -E. coli, Gram-positive -S. aureus) and Eukaryotic type (S. cerevisiae) are considered for the study. A laboratory-type PEF generator which can generate 1 kV square pulses of pulse width 1.2 µs with variable pulse frequency of 1 kHz, 10 kHz, 20 kHz and 50 kHz is used in the investigation. This paper explores the impact of pulse frequency along with electric field intensity and treatment time.
Materials and Methods
Materials and Methods
Culture preparation
The microorganisms, E. coli (ATCC 25922), S. aureus (ATCC 6538) and S. cerevisiae (ATCC 13007) were obtained from American Type Culture Collection, Manassas, USA. Cell cultures were maintained on Muller Hinton Agar (MHA) (Hi-media, India) plates at 4 °C with a subculture period of one week. Each microorganism culture was prepared by transferring one colony from MHA plate to 4ml of Nutrient Broth in a test tube and incubated at 37 °C for 24 h. Then the cell culture was transferred to 50 ml Nutrient Broth and again incubated at 37 °C in order to obtain cells in stationary phase. The concentration of the inoculum was maintained at ∼109 colony forming units (CFU/ml) by comparing with a 0.5 McFarland standard solution. A separate suspension was used for each experiment, and it is also very important that all cell suspensions were prepared from the same culture. The prepared cell suspensions were refrigerated throughout the experiment. Before each treatment, the samples were allowed to reach the temperature of 31 °C. Fresh squeezed orange juice was prepared by using oranges purchased from the local market. The cell culture was mixed with prepared orange juice and incubated for 30 min and then treated immediately.
PEF experiment
A laboratory-type high voltage pulse generator that can generate 1 kV unipolar square pulses of pulse width 1.2 µs with adjustable frequency in the range of 1 kHz to 50 kHz shown in the figure 1 is used for the investigation. The prototype PEF system consists of power MOSFETs and power diodes. The detailed experimental protocols, instruments and software etc. used in the study should be described here with their proper references. The details of the study area should also be provided. The high voltage pulses are generated by interrupting the current through the inductor, connected in series with DC power supply. The interruption is done by switching ON and OFF the power MOSFETs at regular intervals. The advantage of this prototype PEF system is its compactness and able to generate high voltage unipolar pulses at flexible frequency range. The PEF generator output terminals are designed suitably to connect CU500 cuvette chamber (Nepa Gene Co., Ltd., Japan) and two different types of standard Nepa Electroporation cuvettes. The disposable Nepa Electroporation cuvettes consist of aluminum electrodes with 1 mm and 2 mm gap. The 1 mm cuvette can hold maximum of 80 µl cell suspensions as whereas 2 mm cuvette can hold 200 µl. The 1 mm and 2 mm cuvette can develop electric field intensities of 10 kV/cm and 5 kV/cm respectively when used along with the implemented PEF generator and so the experiments were conducted at these electric field intensities of 5 and 10 kV/cm. The focus of the study is to investigate the effect of pulse repetition frequency and treatment time on the different types of microorganisms. So, the samples were taken in the cuvettes and high voltage pulses were applied across the electrodes at different PRF of 1 kHz, 10 kHz, 20 kHz and 50 kHz and the process time was set at 10 s, 20 s, 30s, 40s and 50 s. It was observed that the temperature was reached maximum when the electric field intensity of 10 kV/cm was applied at the maximum frequency of 50 kHz for the time period of 50 s while conducting the experiments and so the 50 s time period was set as maximum for the other experiments conducted at PRF of 1, 10 and 20 kHz.
Microorganisms count
Samples of 100 µl were taken using 1000 µl micropipette from treated suspensions and serially diluted using sterile Nutrient broth. After appropriate dilution, the sample of 4µl had taken from treated suspension for streaking on Nutrient Agar plate. The plates were incubated at 37 °C for 24 h, after which colonies were counted. Each count was determined by the mean values of three plates.
Statistical Analysis
Experiments were repeated in triplicate and the results were expressed as the measurement of the mean ± standard deviation. ANOVA test was performed for all the experiments to determine the significant differences.
Results
Although the electric field intensity is the major factor involved in the PEF treatment to inactivate the different microorganisms, the present study focuses the effect of PRF to inactivate the different microorganisms E. coli, S. aureus, and S. cerevisiae. The results shown in Figure 2 compare the effect of PRF on the inactivation of microorganisms of E. coli, S. aureus, and S. cerevisiae. Values are expressed in terms of mean ± standard error. Though the treatment conditions and the medium (orange juice) were the same for all the microorganisms considered for the present study, a significant difference clearly exists in their inactivation level, and it might be due to the nature of the microorganisms.
Pulse repetition frequency
The effect of PRF on inactivation of microorganisms was determined. The observed results show that the PRF has a significant impact on inactivation process irrespective of the nature of the microorganisms. The experiments were conducted at 1, 10, 20 and 50 kHz and all the four frequencies were investigated. A maximum of 2.63±0.122 log10 reductions was achieved when E. coli was undergone to PEF of 50 kHz, 10 kV/cm, while 2.4±0.16 log10 reductions was achieved for S. cerevisiae. It was found that S. aureus was also inactivated but at a lesser level than E. coli and S. aureus. It could be seen from figure 2 that there was a noticeable difference in the level of inactivation when the PRF was raised. Error bars are not included in figure 1 if it is less than 0.05. But there was no noticeable difference in the inactivation process of S. cerevisiae at the frequency of 1, 10 and 20 kHz. The Gram-positive bacterium, S. aureus was less inactivated than the Gram-negative bacterium, E. coli at all frequencies. From the results, it can be stated that the PRF play important role in the PEF inactivation process and the inactivation of all the three microorganisms can be increased at higher frequencies. There was inactivation significantly different (p< 0.02) in the inactivation level at 50 kHz among all other frequencies considered in the present study.
Electric field intensity
The experiments were repeated at two different electric field intensities of 5 and 10 kV/cm. The effect of electric field intensity was studied at different frequencies. The population of E. coli was reduced by 2.45±0.01 log 10 reduction after treated by 5 kV/cm and increased to 2.63±0.122 log 10 reductions at 10 kV/cm. Similarly, the other two microorganisms were inactivated significantly (p< 0.05) and found that the population was reduced better when the electric field intensity was increased to 10 kV/cm at higher frequencies. But, there was no significant difference (p> 0.05) found on the S. cerevisiae in orange juice at both electric field intensities when the frequency was set at 1, 10, 20 kHz. It was also observed that there was no significant death rate when E. coli and S. aureus were subjected to 5 and 10 kV/cm at the PRF of 1 and 10 kHz. When the frequency was increased to 20 kHz, the E. coli and S. aureus population were reduced better at 10 kV/cm than 5 kV/cm.
Treatment Time:
The experiments were performed to study the effect of treatment time. The microorganisms in orange juice were subjected to 1 kV, 1.2 µs by varying the process time from 10 to 50 s in steps of 10 s for different PRFs of 1 kHz, 10 kHz, 20 kHz and 50 kHz. But the treatment time (Actual time during which the electrical energy is transferred to the food) can be calculated by multiplying the pulse width and number of pulses applied (Number of pulses applied = pulse frequency * process time). The effect of treatment time on inactivation of different microorganisms, E. coli, S. aureus, S. scerevisiae are shown in Figures 3-5 at 10 kV/cm and 5 kV/cm respectively. The E. coli population reduction was more than S. aureus and S. cerevisiae for all the frequencies and also the inactivation level had been increased during the treatment time. A maximum log 10 reduction of E. coli was observed as 2.62±0.122 at the treatment time of 3s. Meanwhile, S. aureus population was reduced by 2±0.05 log10 reduction and S. cerevisiae by 2.4±0.07 at the same treatment time. Table 1 shows the treatment time for different PRF used in the present study. The effect of treatment time on inactivation of different microorganisms, E. coli, S. aureus, S. cerevisiae are shown in Figures 3-5 at 10 kV/cm and 5 kV/cm respectively. The E. coli population reduction was more than S. aureus and S. cerevisiae for all the frequencies and also the inactivation level had been increased during the treatment time. A maximum log 10 reduction of E. coli was observed as 2.62±0.122 at the treatment time of 3 s. The temperature variation of 30 °C was observed for E. coli with the maximum of 2.62±0.122 log10 reductions, while 29 °C was observed for S. cerevisiae with 2.4±0.07 log10 reductions. So, this re-ascertains that there was no thermal inactivation involved in the conducted PEF process.
| Process time (s) | 1 kHz | 10 kHz | 20 kHz | 50 kHz |
|---|---|---|---|---|
| Treatment time (s) | ||||
| 10 | 0.012 | 0.12 | 0.24 | 0.6 |
| 20 | 0.024 | 0.24 | 0.48 | 1.2 |
| 30 | 0.036 | 0.36 | 0.72 | 1.8 |
| 40 | 0.048 | 0.48 | 0.96 | 2.4 |
| 50 | 0.06 | 0.6 | 1.2 | 3 |
Table text extracted from the original PDF; superscript letters are shown inline. The original table image is below.
View original table image
Discussion
The obtained results can be compared with the work done by Geveke [12] in which 1.4±0.1 log 10 reductions of E. coli in apple juice has been achieved when subjected to 24 kV/cm at 20 kHz. In this present study, E. coli population has been reduced by 2.01±0.045 log 10 reductions with the application of 10 kV/cm at 20 kHz. In another investigation, Geveke [21] reported a log 10 reduction of 3 of S. cerevisiae in water at 20 kV/cm and 20 kHz at the outlet temperature of 55 °C. But the same log 10 reduction was achieved at 10 kV/cm itself but the temperature was found as 57 °C in the present study. Moreover, there was no significant difference (p<0.05) for all the microorganisms in the frequency range of 1 kHz to 10 kHz whereas the inactivation level of microorganisms has been elevated in the range of PRF of 20 kHz to 50 kHz. The major problem associated with the comparison of cell inactivation is the experimental conditions adopted and the different PEF systems used by investigators are not comparable directly. However, the PRF can be considered as one of the key parameters on PEF process in the food industry. Although it is very difficult to predict the relationship between electric field intensity and PRF, the voltage can be significantly reduced to achieve maximum level by increasing PRF. In the present study, the E. coli population was reduced by 2±0.045 log 10 reductions at 10 kV/cm when PRF was 20 kHz and at the same time, 2.45±0.11 log 10 reduction was achieved at 5 kV/cm but PRF was 50 kHz. The temperature variations in the present study are in agreement with the results reported by Geveke [16] . There were significant differences in temperature (p<0.05) for E. coli, S. aureus, and S. cerevisiae at same PRF when the process time varied from 10 s to 30 s. In order to quantify the effect of the PRF in the present experimental work, it is worthwhile to compare the results with the previous results published in the PEF food processing technology. Hojo et al. [17] found that as the cell size of the S. cerevisiae increased, the cell electropermeabilization is decreased in both logarithmic and the stationary growth phases. The authors contributed such a behavior to the change in the membrane conductivity due to electroporation. In the present study, the inactivation level of S. cerevisiae was lesser than the E. coli bacteria which are very tiny compared to S. cerevisiae under same PEF conditions. Qin et al. [18] studied the effect of PEF on three microorganisms of E. coli, S. aureus, and S. cerevisiae and it has been found that S. cerevisiae is easier to inactivate than other two microorganisms. The authors attributed the higher inactivation rate of S. cerevisiae to its larger cell size compared to E. coli and S. aureus microorganisms. The effect of PEF treatment on spores, bacteria, and yeast was studied by MacGregor et al. [19] and no significant difference in the inactivation rate was found between the different microorganisms under test conditions. On the contrary, Narsetti et al. [20] observed that E. coli is easily inactivated than B. subtilis under the same test condition. So, such differences in the inactivation rate can be attributed to the fact that E. coli is more susceptible to the PEF treatment. Although it is very difficult to predict the relationship between electric field intensity and PRF, the voltage can be significantly reduced to achieve a maximum death rate by increasing PRF. In the present study, the E. coli population was reduced by 2±0.045 log10 reductions at 10 kV/cm when PRF was 20 kHz and at the same time, a 2.45±0.11 log10 reduction was achieved at 5 kV/cm when PRF was increased 50 kHz. The temperature variations agree with the results reported by Geveke et al. [16] . There were significant differences in temperature (p< 0.05) for E. coli, S. aureus, and S. cerevisiae at same PRF when the process time varied from 10 to 50s.
Conclusion
In summary, high-frequency PEF process is capable of inactivating E. coli, S. aureus and S. cerevisiae inoculated in orange juice at non-thermal conditions. The study has shown that the level of inactivation depends on the electric field intensity, treatment time and PRF might be enhanced along with the electric field intensity. In general, the results showed that the reduction of microorganisms was higher when the PRF of PEF treatment is increased and so it can be concluded that high frequency enhances the level of inactivation at lesser electric field intensity. Moreover, the results show that the inactivation of Gram-negative microorganism is higher than the other two types of microorganisms considered in this study. However, the mechanisms of PEF with the effect of individual parameters on the inactivation process are not fully understood and the developments of PEF technology in the food industry must be still addressed. The work can be extended by studying the impact of each individual parameters and select a proper PEF process parameter with the help of simulation and experimental work.
Acknowledgement
AcknowledgmentThe authors would like to thank SSN Trust and Management for funding this project and their support.
Figures and tables from the paper
References
17 in the original paper- Schoenbach KH, Katsuki S, Robert HS, Stephen Buescher E, Stephen JB. Bioelectric-new applications for pulsed power technology. IEEE Transaction on Plasma Science. 2002;30(1):293-300.
- Dev SB, Rabussay DP, Widera G, Hoffmann GA. Medical applications of electroporation. IEEE Transaction on Plasma Science. 2000;28(1):206-223.
- Scott JM, Farish O, Fouracre R, Neil JR, John GA. Inactivation of pathogenic and spoilage microorganisms in a test liquid using pulsed electric fields. IEEE Transaction on Plasma Science. 2000;28(1):144-149.
- Schoenbach KH, Peterkin FE, Alden RW, Beebe SJ. The effect of pulsed electric fields on biological cells: Experiments and Applications. IEEE Transaction on Plasma Science. 1997;25(2):284-292.
- Grahl T, Markl H. Killing of microorganisms by pulsed electric fields. Applied Microbiology & Biotechnology. 1996;45(1-2):148-157.
- Timoshkin I, MacGregor S, Fouracre R, Crichton B, Anderson J. Transient electrical field across cellular membranes: pulsed electric field treatment of microbial cells. Journal of Physics: D: Applied Physics. 2004;39(3):569-603.
- Geveke DJ, Kozempel M, Scullen OJ, Brunkhorst C. Radio frequency energy effects on microorganisms in foods. Innovative Food Science and Emerging Technology. 2002;3(2):133-138.
- Saleh KJ, Alakiu DM, Adam AS. Search for E. coli o157:h7 in stool samples from diahrreagenic patients attending dutsin-ma general hospital, Katsina state, north-western Nigeria. International Journal of Biological Sciences. 2021;3(1):34-40. DOI: 10.33545/26649926.2021.v3.i1a.27
- Geveke DJ, Brunkhorst C. Radio frequency electric fields inactivation of Escherichia coli in apple cider. Journal of Food Engineering. 2008;85(2):215-221.
- Delso C, Berzosa A, Sanz J, Álvarez I, Raso J. Pulsed electric field processing as an alternative to sulfites (SO2) for controlling saccharomyces cerevisiae involved in the fermentation of Chardonnay white wine. Food Research International. 2023;165:112525,
- Kantala C, Supasin S, Intra P, Rattanadecho P. Evaluation of Pulsed Electric Field and Conventional Thermal Processing for Microbial Inactivation in Thai Orange Juice. Foods. 2022;11(8):1102.
- Geveke DJ, Brunkhorst C. Inactivation of Escherichia coli in Apple Juice by Radio Frequency Electric Fields. Journal of Food Science. 2004;69(3):134-138.
- Hojo S, Shimizu K, Yositake H, Muraji M, Tsujimoto H, Tatebe W. The relationship between electro permeabilization and cell cycle and cell size of Saccharomyces cerevisiae. IEEE Transaction on NanoBioscience. 2003;2(1):35-39.
- Qin BL, Barbosa-Canovas G, Swanson B, Pedrow P, Olsen R. Inactivating microorganisms using a pulsed electric field continuous treatment system. IEEE Transaction on Industrial Applications. 1998;34(1):4350.
- MacGregor S, Farish O, Fouracre R, Rowan N, Andreson J. Inactivation of pathogenic and spoilage International Journal of Agriculture and Food Science https://www.agriculturaljournals.com microorganisms in a test liquid using pulsed electric fields. IEEE Transaction on Plasma Science. 2000;28(1):144-149.
- Narsetti R, Curry R, McDonald K, Clevenger T, Nichols L. Microbial inactivation in water using pulsed electric fields and magnetic pulse compressor technology. IEEE Transaction on Plasma Science. 2006;34(4):1386-1393.
- Geveke DJ, Brunkhorst C. Inactivation of Saccharomyces cerevisiae using radio frequency electric fields. Journal of Food Protection. 2003;66(9):1712-1715.
Cited by 3
From OpenAlex, OpenCitations and reference lists read by Scinovex
- Prevalence of Gastrointestinal Parasites and Associated Risk Factors Among Dairy Cattle in Bangladesh: An 8-Year Retrospective Study ↗
Delower Hossain, Banya Banowary, Basant Saud, Iqramul Haq, Sabiha Zarin Tasnim Bristi, Ridwan Olamilekan Adesola et al. · Acta Parasitologica · 2025
❝ 3 - Advanced Non‐Thermal Processing: Combined Cold Plasma and Pulsed Electric Field for E. coli Inactivation in Milk ↗
Kimia Taki, Bahram Hosseinzadeh Samani, Shirin Ghatrehsamani · Food Science & Nutrition · 2025
ABSTRACT Milk, rich in proteins, vitamins, and bioactive compounds, is highly susceptible to microbial contamination by pathogens like Escherichia coli , posing risks to food safety. Conventional thermal pasteurization often degrades nutritional and sensory qualities. This study developed a non‐thermal ACP‐PEF system to inactivate E. coli while preserving milk's properties. Using Response Surface Methodology (RSM) with a Box–Behnken design, four…
❝ 3PDF - Non-thermal sterilization of liquid foods via pulsed electric fields: A Tesla coil and multilevel inverter-based approach ↗
Prakasit Sritakaew, Rardchawadee Silapunt · Journal of Food Engineering · 2026
❝ 0