
Research article · 2022 · Full text
International Journal of Veterinary Sciences and Animal HusbandryPhenotypic characterization and production systems of indigenous chickens in urban, peri urban and rural area of the west Harerghe zone, Ethiopia
Volume 7(5) · Pages 13–22 · DOI: 10.22271/veterinary.2022.v7.i5a.437 ↗
Research areasLivestock and Poultry ManagementAnimal Nutrition and PhysiologyLivestock Farming and Management
Abstract
Author-writtenThe study was conducted to characterize the indigenous chicken ecotypes and identify the production system of the owners across different locations. The three districts of West Hararghe zone of Oromia region, Gamachis, Tullo and Ciro district were purposely selected to represent high-altitude, mid-altitude and low-altitude agro-ecologies, respectively. Three kebeles from different locations (urban, peri-urban and rural) were selected purposely in each district that makes up a total of 9 kebeles as primary sampling units for the study. About 20 rural households (HH) per kebeles were selected randomly and additional three focus groups one per district was formed to strength the ideas of the respondents. A total of 180 HHs (60 HHs per urban, peri-urban and rural locations) were interviewed for primary data collection. Productive and reproductive performance, breeding practice, and major constraints of chicken production were addressed by semi-structured questionnaire and checklists. Additionally, field observations and focus group discussions were practiced. Whereas, measurable traits like body weight (BW), body length (BL), chest circumference (CC), wing span (WS), shank length (SL), comb length (CL), comb width (CW), wattle length (WL), earlobe length (EL), height at back (HB) and height at comb(HC)were considered for the study of 420 mature chickens morphological characteristics. The data were analyzed using General Linear Model (GLM) of SAS (version 9.1.3).Also SPSS (version 20) and index methods were used to analyze qualitative data and to rank priority setup of the breeding objectives and to detect the major constraints respectively. The overall mean for body weight obtained for mature chicken was 1.33±0.009 kg which showed a significant difference (p
Summary
Source-checkedPlain-language reading of the full paper, prepared with AI and checked against the text. Each point links to the authors' own words.
Why it matters
- Indigenous chickens are vital for rural Ethiopian populations, providing essential income and animal protein, and contributing 91.79% of the country's total egg production. View evidence ↗
- Ethiopian indigenous chicken populations are facing genetic erosion due to the introduction of improved foreign stocks and a lack of conservation efforts. View evidence ↗
The question
- The study aimed to characterize indigenous chicken ecotypes and identify the production systems used by owners across various locations. View evidence ↗
What they did
- The research was conducted in the Gamachis, Tullo, and Ciro districts of the West Hararghe zone to represent high, mid, and low-altitude agro-ecologies. View evidence ↗
- Data was collected from 180 households (60 each from urban, peri-urban, and rural areas) and 420 mature chickens were sampled for morphological measurements. View evidence ↗
- Quantitative traits including body weight (kg) and various linear body measurements (cm) were recorded using a spring balance and tailor meter. View evidence ↗
What they found
- The average body weight for mature chickens was 1.33±0.009 kg, with significant differences observed based on sex and agro-ecology (p<0.05). View evidence ↗
- Red and red-brown plumage was the most common color (38.33%), followed by Wheaten (22.4%), black (14.5%), and white (12.1%). View evidence ↗
- The double/pea comb type was the most prevalent comb type, appearing in 81% of the studied population across all districts and sexes. View evidence ↗
- Egg production varied by location, with urban chickens producing the most (64.78±16.85 eggs), followed by peri-urban (55.4±12.96) and rural (50.18±8.42) chickens. View evidence ↗
- Disease was identified as the primary constraint hindering chicken production across all locations, followed by housing, feeding, and predators. View evidence ↗
- Breeding objectives differed by location: urban households focused on egg production for home consumption, while peri-urban and rural households focused on income generation. View evidence ↗
What it means
- The authors concluded that the studied chicken populations are not unique compared to other indigenous Ethiopian populations, as their morphological characteristics are found elsewhere in the country. View evidence ↗
- The authors recommend strengthening the selection of chickens based on plumage color to help conserve these ecotypes. View evidence ↗
- The authors state that exhaustive characterization requires further studies incorporating molecular analyses, production data, and morphometrics. View evidence ↗
Visual summary
3 visualsIllustrations explain the paper; charts are replotted from the paper's own table values.
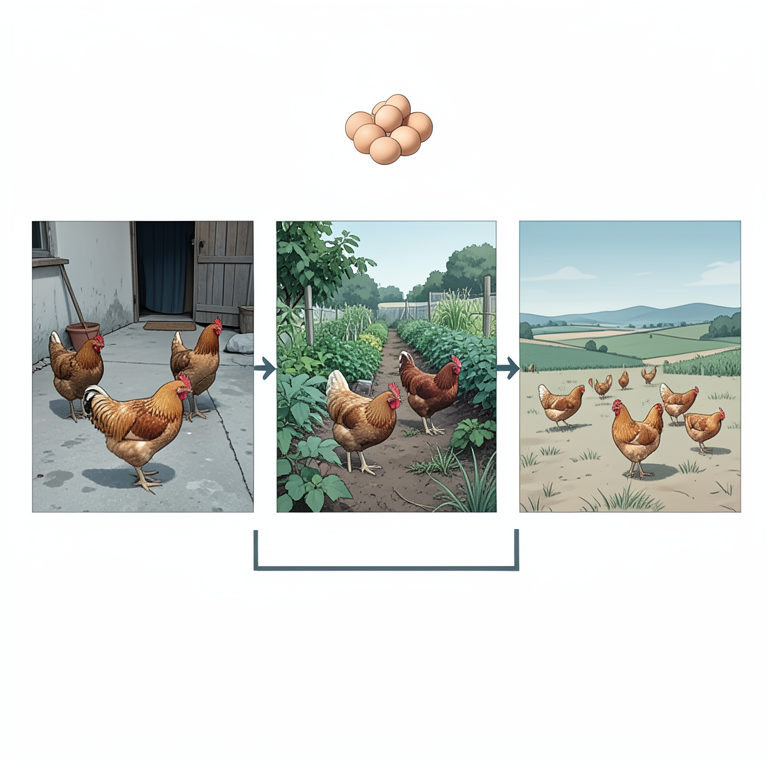
Production System Comparison
AI-generated conceptual illustration (indigenous chickens in urban, peri-urban, and rural Ethiopian settings). It explains the idea and does not show study data.
View source evidence ↗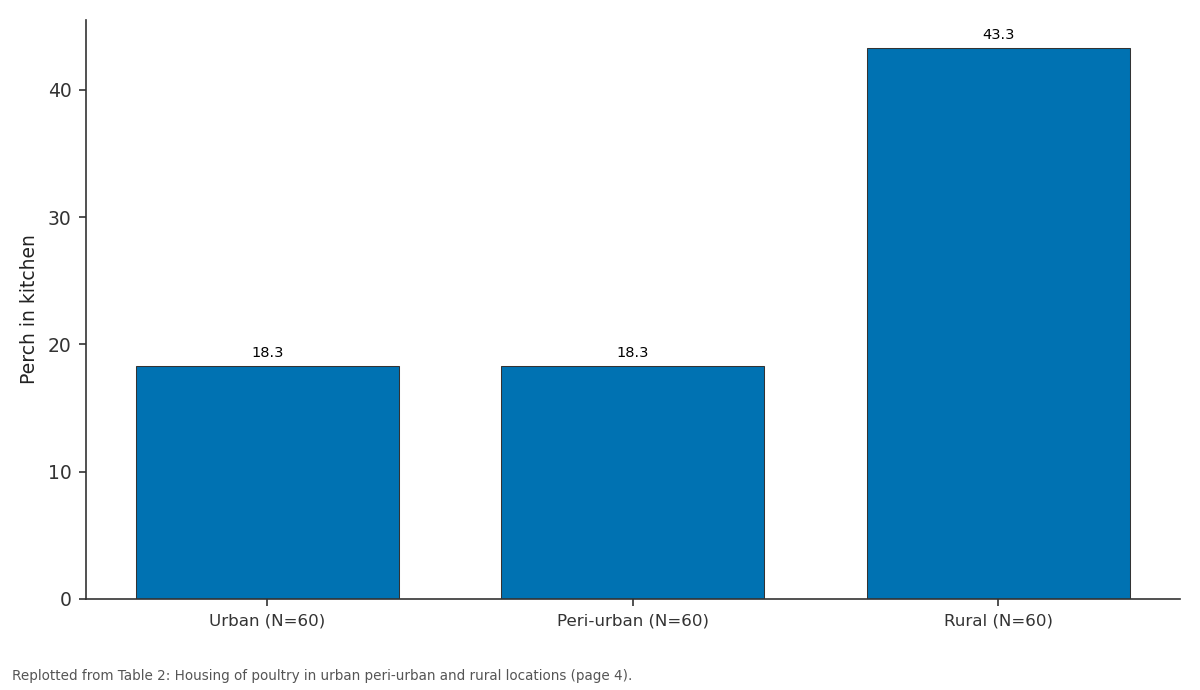
Perch in kitchen: Urban (N=60) vs Peri-urban (N=60) vs Rural (N=60)
Replotted from Table 2 (page 4) of the original paper. Every bar is the paper's own table value.
View source evidence ↗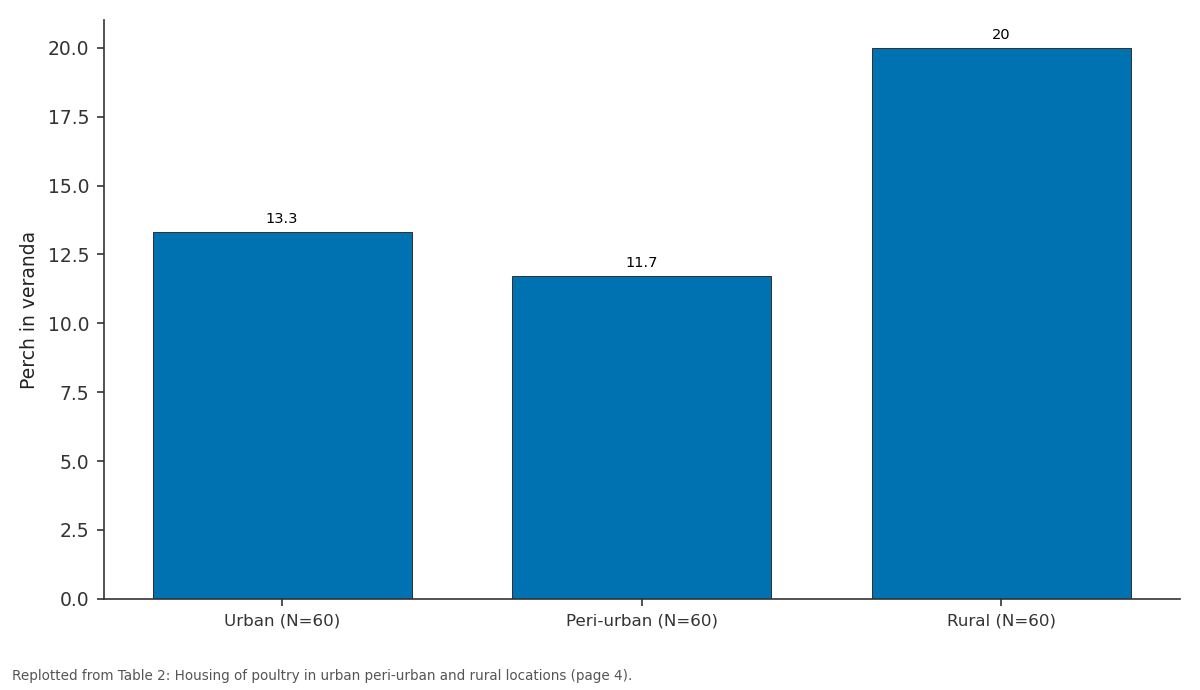
Perch in veranda: Urban (N=60) vs Peri-urban (N=60) vs Rural (N=60)
Replotted from Table 2 (page 4) of the original paper. Every bar is the paper's own table value.
View source evidence ↗Figures & tables
From the original paper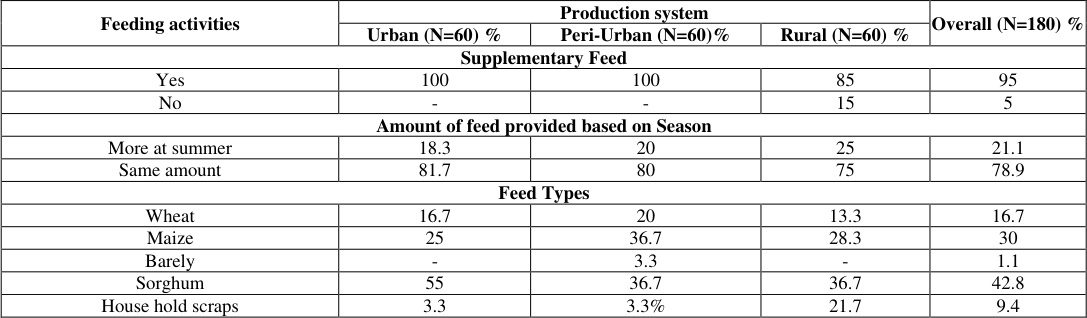 Table 1
 Table 2
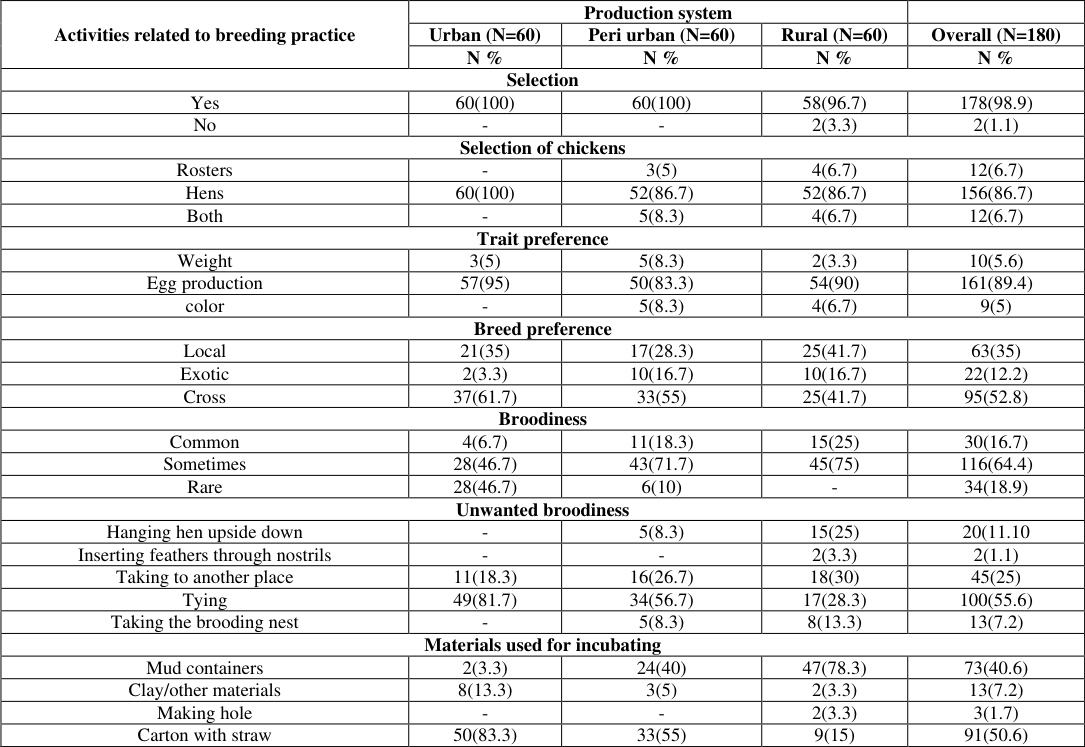 Table 3
 Table 4
 Table 5
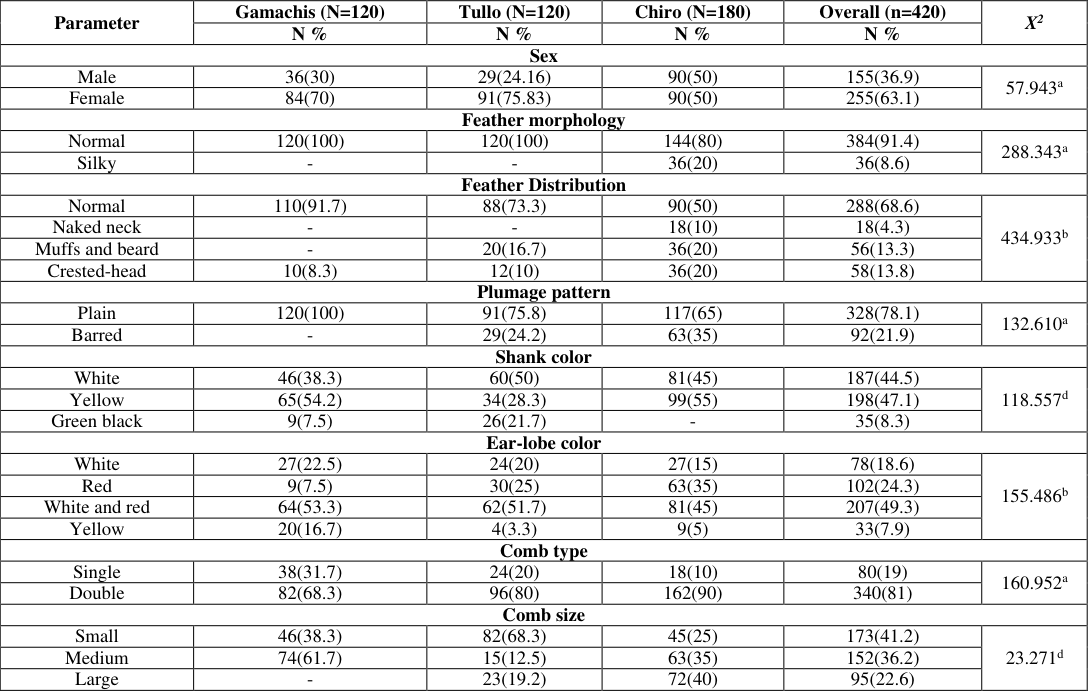 Table 6
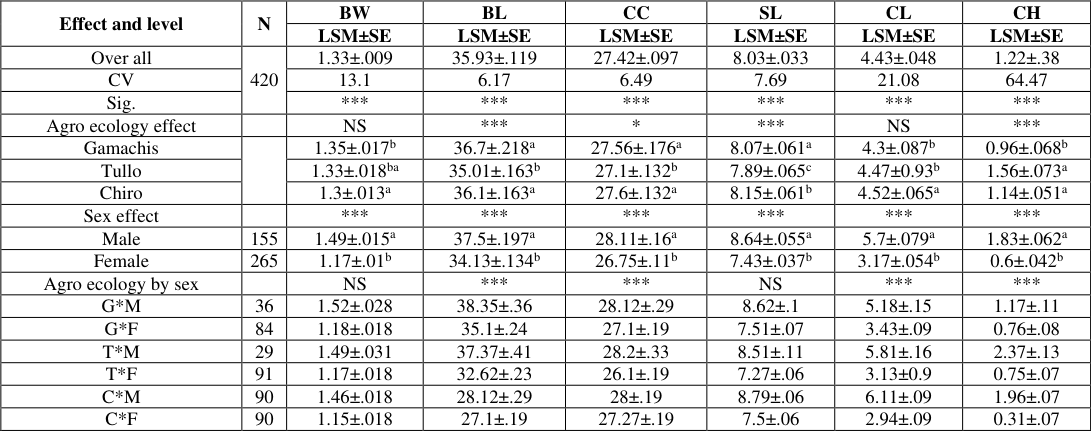 Table 7
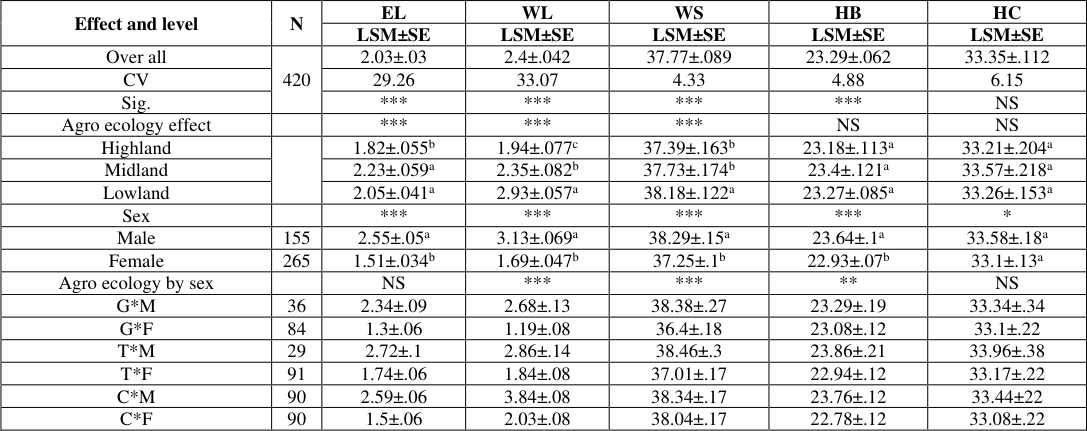 Table 7
Introduction
Agriculture is considered by many as the key driver for mass poverty reduction and rural development for most of the developing world (World Bank, 2008) [40] . It is main economic pillar of the Ethiopian economy and the overall economic growth of the country is highly dependent on the success of the agriculture sector. The sector represents 42% of the GDP of the country and about 85% of the population gains the livelihood directly or indirectly from agricultural production (CSA, 2015). Poultry farming is widely practiced in Africa and almost every farmstead keeps for consumption and cash sales. Religions and cultural considerations are also amongst the reasons for keeping chickens by resource poor farmers in Africa (Dwinger et al., 2003) [14] .
Similarly, households in Ethiopia keep birds for household consumption, sale and reproduction purposes including other social and cultural roles (Tadelle Dessie and Peter, 2003) [37,39] . Traditional chicken rearing is practiced by virtually every family in rural Ethiopia, indicating that chickens are affordable sources of animal protein (Solomon Demeke, 2003) [34] . Knowledge and understanding of the chicken production system, unique characteristics, and production constraints are important in the devise and carrying out of indigenous chicken based improvement programs. The development of successful production strategies for poultry rearing depends on an accurate description of village chicken production system (Tadelle Dessie, 2003) [37] . Developing schemes that aim to promote and improve the village poultry sub-sector need to incorporate local knowledge in productivity and health management in addition to roles and contributions of women (Tadelle Dessie et al., 2003) [37] . The total poultry population at country level is estimated to be about 60.51 million (CSA, 2016). With regard to breed 94.33% is indigenous chickens which show a large variation in body position, plumage color, comb type and productivity (Tadelle Dessie, 2003; Halima Hassen, 2007) [39,21] . These indigenous chickens are distributed across different agroecological zones CSA (2014) and mostly under a traditional family-based scavenging management system (Alemu Yami and Tadelle Dessie, 1997) [5] . In Ethiopia, 91.79% of the total egg production is contributed by local chickens (CSA, 2013). This indicates that they are highly important farm animals kept as a good source of animal protein and income to most of the rural populations. The total chicken egg and meat production in Ethiopia is estimated to be about 78,000 and 72,300 metric tons, respectively (Fisseha Moges et al., 2010) [17] , of which more than 90% of the national chicken meat and egg output is derived from indigenous chickens (Nigussie Dana, 2011) [31] . However, the economic contribution of the sector is not still proportional to the vast chicken numbers, attributed by the presence of many production, reproduction and marketing constraints. Indigenous chickens in Ethiopia are in general hardy, adaptive to the local environments, survive on little or no inputs and adjust to fluctuations in feed availability (Tadelle Dessie, 2003; Halima Hassen et al., 2007; FAO, 2007) [37,39,21,22] . They are also considered to be as gene reservoirs particularly of those genes that have adaptive values in tropical conditions (Abdelqader et al., 2007) [1] . According to FAO (2015) a breeding program is defined as "systematic and structured programs for changing the genetic composition of a population towards a defined breeding goal (objective) to realize genetic gain (response to selection), based on objective performance criteria. However, the production environments reduction objectives, trait choices of rural farmers, breeding practices and unique characteristics of local chicken ecotypes should be defined before developing the breeding program (Solkner et al., 2008). Subsequently, different conservation program should be carried out to reduce loss of this typical future of local chicken. A study by Alemu Yami et al. (2006) [5] suggested that marketing problem is one of the constraints for the adoption of poultry technology and poultry products. Communities from different parts of a country have been attaching their social beliefs and life-safeness with the morphological characteristics of indigenous chickens that are used at home (Mammo Mengesha and Wude Tsega 2011) [28] . This trend has the result which gives emphasis to producing few ecotypes based on the market preference which may cause an extinction of un-preferred ecotypes in long term. So, understanding the roles and function of local chicken as well as production constraints is of considerable relevance in envisaging future research and development directions and strategies (Duguma Reta, 2006; Nigussie Dana et al., 2010; Tegene Negesse & Aberra Melesse, 2011) [13,31,2] . There is little information on the diversity of different indigenous chicken ecotypes. On top of that, the indigenous chicken populations of Ethiopia have been undergoing genetic erosion especially in the central and other parts of the country following the introduction of improved stock from developed countries (Emebet Moreda, 2015) [15] . Moreover, no real efforts have been made to conserve these chicken genetic resources (Eskinder Aklilu et al., 2013) [16] . The present and future improvement and sustainable utilization of indigenous chicken are dependent upon the availability of these genetic variations (Benitez, 2002) [6] . Therefore, characterization, utilization and conservation of indigenous genetic resources are paramount (Halima Hassen, 2007) [21] , improvement and conservation of indigenous chicken resource demands characterization of the available genotype (Getachew Bekele et al., 2015) [18] . Although there is difference in socioeconomic status, growth and density of population, availability of social services, facility and infrastructure among urban, rural and peri-urban residents may cause variation in small scale poultry management practices, relatively no or little research has been carried out to characterize understand and improve small scale poultry management based on location (Nega Mekonnen et al., 2016) [30] . The information on farmers breeding practices and traits of economic importance for most parts of Ethiopia are deficient. Developing appropriate breeding program for village conditions requires characterization of production circumstances and identification of breeding practices and trait of economic performance of farmers (Abdelqader et al., 2007) [1] With this background, the current study is initiated to explore the existing village chicken production systems and constraints in relation to urban, peri-urban and rural locations; morphological characterization, production performance, breeding practices and market preference of indigenous chicken ecotype in selected areas of West Hararghe Zone, Oromia National Regional State, Ethiopia.
Objectives 1.General objective
To assess the production systems and characterize phenotypic performance of indigenous chicken ecotype at West Harerghe Zone of Oromia regional state, Ethiopia.
Specific objectives
To assess the village chicken production system and identify the production constraints at different locations of study areas To characterize phenotypic performance of the indigenous chicken ecotype of indigenous chicken at study areas
Materials and Methods
Materials and Methods
Sampling Techniques
In the first stage, the three study settings were chosen purposively based on the availability of indigenous chickens and representativeness in terms of the rural, peri-urban and urban areas of the three districts Gamachis, Tullo and Ciro which have different agro ecological zones high-altitude, midaltitude and low-altitude respectively, in consultation with zonal and district bureau of agriculture experts. Households were randomly selected from each kebele located in urban peri-urban and rural areas. Sampling frame was three districts per zone, three kebeles per district, each kebele was in different location and twenty households were interviewed per kebele. Generally, a total of 180 households (60 from each district) were sampled for interview from the selected Kebeles. For linear body measurements a total of 420 from both female and male indigenous chickens, was sampled from all districts. Nine groups which have above six members which include women, agriculture development agent, elders and others were formed for group discussion from all districts.
Methods of Data Collection
The data was generated through observation, structured questionnaire, by employing linear body measurements and organizing group discussion. Both primary and secondary data were used in the study. Two types of primary data were collected in the study. The first involves a questionnaire where productive and reproductive traits, breeding practice, and major constraints of the chicken production, were collected from selected households.
Secondly, physical measurements were taken on sampled 155 male and 265 female mature chickens. The measurements include quantitative morphological traits (shank length, comb height, comb length, body length, chest circumference, wattle length, wing span, height at back and height at comb in cm.) and body weight in kg was measured by using tailor meter and spring balance. A qualitative trait (feather morphology, feather distribution, plumage pattern, plumage color, shank color, earlobe color, and comb type and comb size) was recorded following the FAO descriptors for chicken genetic resources (FAO, 2012).
Method of data management and analysis
All the data which were coded in Microsoft excel sheet, and where analyzed by using an appropriate statistical packages. A general linear model GLM of SAS (version 9.13) was employed for quantitative variables (body weight (BW), body length (BL),chest circumference (CC), wing span (WS), shank length (SL), comb length (CL), comb width (CW), wattle length (WL),earlobe length (EL), height at back (HB) and height at comb(HC) and productive and reproductive traits (age at first egg for hens and age at first mating for cocks, clutch size, clutch length, eggs incubated per bird, eggs hatched per clutch, number of laying cycles/hen/year, total number of eggs/hen/year) and SPSS (version 20) for qualitative traits (feather morphology, feather distribution, plumage pattern, plumage color, shank color, earlobe color, comb type and comb size), socioeconomic characteristics, husbandry practices, flock structure, and market preference were used to detect statistical differences among sampled indigenous chicken populations.
A statistical analysis was made separately for male and female chicken on variables that varied on sex; otherwise the data was merged and analyzed together and compared by using Duncan`s Multiple Range test for multiple comparisons at a 95% probability level. Also Chi-square tests was applied to determine associations between the phenotypic qualitative traits observed in three districts.
For mature animals, sex and location of the experimental indigenous chickens were fitted as fixed independent variables. The effects of class variables and their interaction are expressed as Least Square Means (LSM) ± SE.
The model for analysis of data on the linear body measurements for sample populations was
Where: Y ij = the observed body weight or linear body measurements in the i th agro ecology, j th sex and ij th the interaction effects of agro ecology by sex μ= over all mean
Ai =the effect of i th agro ecology (i=high-land, mid-altitude or low-land) Sj= the effect of jth sex (j=male or female) AS ij = the interaction of agro ecology by sex e ijk = Residual random error The major poultry production constraints and breeding objective of the producers was analyzed and summarized by index method.
Index =Σ (n x number of HHs ranked 1st) + (n-1) x number of HHs ranked HHs ranked 1st+ (n-1) x number of HHs ranked 2nd+…. +1x number of HHs ranked last) for all traits, and where n = number of traits under consideration. The variable with the highest index value was the highest economically important (Kosgey, I.S. 2004) [27] .
Results and Discussions 3.1 Chicken Production Systems 3.1.1 Feeding practice
In this study the major feed resources of poultry are presented in (Table 1). Overall, the most important feed resources of poultry in the three surveyed locations were feeds obtained from scavenging around the back yard (herbage seeds, worms, green leaves and minerals), homemade wastes and grain supplements like (wheat, maize and sorghum). Comparable proportion of respondents' in all locations reported in making use of grain supplements. About 55%, 36.7% and 36.7% of the respondents from urban, peri urban and rural areas respectively used sorghum as supplementary feed. Mapiye and Sibanda (2005) [29] indicated that, in Ethiopia, Gambia and Tanzania, scavenging was the major feeding system; however, chickens food was supplemented with leftovers and grains. According to Aichi and Kitaly (1998) [4] in village chicken production systems, the major proportion of the feed was obtained through scavenging. Poultry production in tropical countries was based on the traditional scavenging system and characterized by low output per bird (Mapiye and Sibanda, 2005) [29] . Majority of the respondents at different locations provided their chickens the same amount of feeds during winter and summer seasons. During winter season, there is accessibility of feed outside for chickens; this is due to harvesting crop production. Because of that, about 21.1% of the respondents provided more feeds at summer season. Especially at rural and peri-urban areas the owners reduce the amount of feed they provide during this season. In the meantime in summer season the chickens found the flowering vegetation's outside which may cause them diarrhea if they didn't have any supplementary feeds before they start scavenging. [30] which indicated 80%, 60% and 40% separate house accommodation respectively in urban, peri urban and rural areas in Benshangul Gumuz region western Ethiopia. About 13.3% of the respondents in peri-urban households and 21.7% in rural households reported accommodating poultry together with the family in the family house. Sonaiya et al. (1999) [35] also reported that in South Wollo Ethiopia about 41.3% of households shared the same room followed by a separate quarter in the same roof 37.5% and separately constructed houses 21.2%. About 18.3%, 18.3% and 43.3% of urban, peri-urban and rural area respondents use perch in kitchen for accommodating their poultry. The majority of the respondents indicated that they keep their chicken at various night sheltering places in the main house including perches inside the house and perches in the kitchen. These sites are obviously the most secure overnight locations to avoid predators and theft. However, this may increase the risk of disease transmission (Agide Yisma, 2015) [3] . However, newly hatched chicks are separated from adults and kept in family house until they become strong enough to prevent damaging by larger birds. As described by Gueye (1998) [19] the small scale poultry production system is characterized by provisions of simple night enclosures. The 98.3%, 66.7% and 58.3% of respondents in urban, peri-urban and rural area respectively had thrown away the excrement of the poultry. While 1.7%, 33.3% and 41.7% of them used as fertilizer respectively.
| Feeding activities | Production system | — | — | Overall (N=180) % |
|---|---|---|---|---|
| Urban (N=60) % | Peri-Urban (N=60)% | Rural (N=60) % | ||
| Supplementary Feed | ||||
| Yes | 100 | 100 | 85 | 95 |
| No | - | - | 15 | 5 |
| Amount of feed provided based on Season | ||||
| More at summer | 18.3 | 20 | 25 | 21.1 |
| Same amount | 81.7 | 80 | 75 | 78.9 |
| Feed Types | ||||
| Wheat | 16.7 | 20 | 13.3 | 16.7 |
| Maize | 25 | 36.7 | 28.3 | 30 |
| Barely | - | 3.3 | - | 1.1 |
| Sorghum | 55 | 36.7 | 36.7 | 42.8 |
| House hold scraps | 3.3 | 3.3% | 21.7 | 9.4 |
Table text extracted from the original PDF; superscript letters are shown inline. The original table image is below.
View original table image
Breeding practice of chicken in urban, peri-urban and rural locations
According to the cross-sectional survey, in traditional system of chicken production, mating is uncontrolled and type of mating practiced is flock mating. Majority of respondents in all study areas had used their own cocks for breeding purpose which is similar with the findings of Nega Mekonnen et al., (2016) [30] . The major attributes of chicken used by farmers in selecting breeding stock are given in (Table 4.7). Higher percentage of respondents (86.7%) in the three surveyed locations indicated reported that they selected breeding hens. They used productive (age at first egg for hens and age at first mating for cocks) and reproductive performance (clutch size, clutch length, eggs hatched per clutch, number of laying cycles/hen/year, total number of eggs/hen/year) as the main criteria followed by body size and color during selection of breeding flock in their order of importance. To explore the advantage of hetrosis about 52.8% of the respondents selected cross breed for production. About 64.4% of respondents respond that broodiness is sometimes in their production system and about 55.6% of them prevented unwanted broodiness by tying their hens. While 11.1% of them hanging hen upside down and 25% of them taking to another place which is less than report of Eskinder Aklilu (2013) [16] in Horro and Jarso hanging upside down (35%) and taking to another neighborhood places (34%) were the main methods to break broodiness, respectively. About 50.6% of the respondents use carton filled by straw as an incubating material.
| Major constraints | Production system | — | — | Over all (N=180) |
|---|---|---|---|---|
| Urban (N=60) | Peri urban (N=60) | Rural (N=60) | ||
| Index R | Index | Index | Index | |
| Diseases | 0.26 | 0.27 | 0.25 | 0.26 |
| Housing | 0.20 | 0.22 | 0.30 | 0.24 |
| Feeding | 0.20 | 0.22 | 0.25 | 0.22 |
| Dust making and lack of technical support | 0.26 | 0.21 | 0.07 | 0.18 |
| Predator | 0.08 | 0.08 | 0.13 | 0.09 |
Table text extracted from the original PDF; superscript letters are shown inline. The original table image is below.
View original table image
Major Constraints of Chicken Production in urban peri-urban and rural areas
There are many constraints to village poultry production: poor management practices (housing, nutrition), diseases and parasites, low extension services and poor credits. Indigenous birds have to find food, but the feed supplement mainly consists of locally available cereals is provided (Dorji & Gyeltshen, 2012) [12] . Disease is ranked first as a major constraint which hinders the village chicken production in different locations, followed by husbandry practices like housing and feeding. This has been also reported by Tadelle Dessie and Ogle (2001) [38] for the central highlands of Ethiopia. Similarly, study conducted in Fogera woreda by Bogale Kibret, (2008) [7] reported that the two major constraints of poultry production were disease and shortage of supplementary feeds. Khalafalla et al. (2000) [25] also reported that inadequate health care, poor production, inappropriate housing and poor knowledge of poultry management were the major constraints to village poultry production in Sudan. The major diseases reported in the study area were Newcastle disease (locally named `fungil`). The focus group members and respondents confirmed the presence of dangerous disease outbreak in the area, which caused complete devastation of the flock.
In urban and peri -urban areas the respondents lost the interest of producing chickens, because village chickens scatter litter and root up the vegetations and flowers in the garden of their compound and neighbors. Due to this they were afraid of arguing with their neighbors. Also, agricultural development technicians did not regularly assist them in the management system of their indigenous chickens. Rather, they came to convince them to take exotic chicks when the agricultural office proposed to introduce it. That is why lack of technical support was raised as one of the major problems which hinder the production. Additionally, predators like wild cat and eagle (locally named `addala` and `chululie`, respectively) hunt small chicks which cannot defend themselves. These challenges made the owners lose the interest to raise chickens. In contrast to the present results, Yemane Negatu (2009) [41] reported that predators' attack was the main constraint of poultry production in the Halaba woreda, Southern Ethiopia. Overall, red and red brown plumages appeared most frequently (38.33%) followed by Wheaten (22.4%), black (14.5%) and white (12.1%) yellowish and black (7.1%), reddish and white (6). The occurrence of several plumage colours observed in the local chicken population in the current study might be the result of uncontrolled breeding of chickens in the rural areas since random mating is a typical breeding practice under free range management system (Guni and Katule, 2013) [20] . Preference of the people in the study area for red and red brown plumage might also account for the predominant occurrence of the colours since plumage colour might influence consumer preference and utilization. Normal feather morphology and feather distribution was the main plumage characteristic of local chicken populations in the study areas (Table 4.10). However, unique features such as crested-head, naked-necked, muffs and beard were observed. Of the total population studied 13.8% was identified as crest-headed, the remaining birds had normal head shape. A higher proportion of crest-headed birds were observed in females than in males. The proportion of chickens with naked-necks from the total chicken population in the study areas was quite small (4.3%). The naked-neck chickens were observed at Chiro district, which is low-altitude agro ecologically. The naked-neck character is described as the expression of a major gene found in local chicken populations of the tropics and is considered to have desirable effects on heat tolerance (Horst, 1989) [23] . 78.1% the total chicken observed Plumage pattern was plain while remain 21.9% was barred. The current study showed that 47.1%, 44.5% and 8.3% of all the chickens have yellow, white and green black colour shanks, respectively. The observed predominant occurrence of yellow shanks in the current study was similar to that reported by other researchers (Sewannyana et al., 2008; Daikwo et al., 2011; Cabarles et al., 2012) [33,11,8] . The occurrence of various types of shank colours might have been due to combinations of pigment controlling genes responsible for colour determination (Guni and Katule, 2013) [20] . X 2 = Chi square significant at p<0.05; where different superscript letters a, b, d indicate, within a column highly significant differences at the 0.5% level of probability between different agro ecologies. Differences in earlobe colour were observed. Most (49.3%) of the chickens had white-patched red earlobes. The second most frequent earlobe colour was red (24.3%) while 18.6% of the chickens had white and 7.9% has yellow colour earlobes. Two comb types were also observed in the current study. Pea/double comb type was the most common (81%) and was predominant in all districts and sexes. The sizes of combs occurring in the population could be conveniently classified as being small, medium or large.
On the basis of the classification criterion adopted it was observed that there were differences between sexes with respect to comb size. In general, chickens with small combs were most frequent (41.2%) followed by those with medium sized combs (36.2%), and while birds with large combs were the least frequently observed (22.6%) in the districts. Small and medium sized combs occurred more frequent in female chickens while male chickens tended to have large combs. Similar findings have been reported in Nigeria (Ige et al., 2012) [24] . The predominant occurrence of small sized combs in the local chicken populations suggests that the size of face and head appendages could be under the influence of hormones which are connected with reproduction, particularly egg production (Guni and Katule, 2013) [20] .
Quantitative traits
Quantitative traits of chickens have high economic importance for indigenous chickens. These gene traits of chickens can be expressed by measuring production traits that can mostly been affected by many genes (Mammo Mengesha, 2012) [28] . These traits can be also affected by the environment which the animal is exposed. From the total 420 matured local chickens sampled in both sexes eleven measurable parameters such as body weight (BW), body length (BL), chest circumference (CC), wing span (WS), shank length (SL), comb length (CL), comb width (CW), wattle length (WL), earlobe length (EL), height at back (HB) and height at comb (HC) were measured in cm. The GLM least squares means and interaction effects of sex with agro ecology of body weight and other linear body measurements of chickens from Gamachis, Tullo and Chiro were presented in Table 7.
| Effect and level | N | EL | WL | WS | HB | HC |
|---|---|---|---|---|---|---|
| LSM±SE | LSM±SE | LSM±SE | LSM±SE | LSM±SE | ||
| Over all | 420 | 2.03±.03 | 2.4±.042 | 37.77±.089 | 23.29±.062 | 33.35±.112 |
| CV | 29.26 | 33.07 | 4.33 | 4.88 | 6.15 | |
| Sig. | *** | *** | *** | *** | NS | |
| Agro ecology effect | *** | *** | *** | NS | NS | |
| Highland | 1.82±.055b | 1.94±.077c | 37.39±.163b | 23.18±.113a | 33.21±.204a | |
| Midland | 2.23±.059a | 2.35±.082b | 37.73±.174b | 23.4±.121a | 33.57±.218a | |
| Lowland | 2.05±.041a | 2.93±.057a | 38.18±.122a | 23.27±.085a | 33.26±.153a | |
| Sex | *** | *** | *** | *** | * | |
| Male | 155 | 2.55±.05a | 3.13±.069a | 38.29±.15a | 23.64±.1a | 33.58±.18a |
| Female | 265 | 1.51±.034b | 1.69±.047b | 37.25±.1b | 22.93±.07b | 33.1±.13a |
| Agro ecology by sex | NS | *** | *** | ** | NS | |
| G*M | 36 | 2.34±.09 | 2.68±.13 | 38.38±.27 | 23.29±.19 | 33.34±.34 |
| G*F | 84 | 1.3±.06 | 1.19±.08 | 36.4±.18 | 23.08±.12 | 33.1±.22 |
| T*M | 29 | 2.72±.1 | 2.86±.14 | 38.46±.3 | 23.86±.21 | 33.96±.38 |
| T*F | 91 | 1.74±.06 | 1.84±.08 | 37.01±.17 | 22.94±.12 | 33.17±.22 |
| C*M | 90 | 2.59±.06 | 3.84±.08 | 38.34±.17 | 23.76±.12 | 33.44±22 |
| C*F | 90 | 1.5±.06 | 2.03±.08 | 38.04±.17 | 22.78±.12 | 33.08±.22 |
Table text extracted from the original PDF; superscript letters are shown inline. The original table image is below.
View original table image
| Effect and level | N | BW | BL | CC | SL | CL | CH |
|---|---|---|---|---|---|---|---|
| LSM±SE | LSM±SE | LSM±SE | LSM±SE | LSM±SE | LSM±SE | ||
| Over all | 420 | 1.33±.009 | 35.93±.119 | 27.42±.097 | 8.03±.033 | 4.43±.048 | 1.22±.38 |
| CV | 13.1 | 6.17 | 6.49 | 7.69 | 21.08 | 64.47 | |
| Sig. | *** | *** | *** | *** | *** | *** | |
| Agro ecology effect | NS | *** | * | *** | NS | *** | |
| Gamachis | 1.35±.017b | 36.7±.218a | 27.56±.176a | 8.07±.061a | 4.3±.087b | 0.96±.068b | |
| Tullo | 1.33±.018ba | 35.01±.163b | 27.1±.132b | 7.89±.065c | 4.47±0.93b | 1.56±.073a | |
| Chiro | 1.3±.013a | 36.1±.163a | 27.6±.132a | 8.15±.061b | 4.52±.065a | 1.14±.051a | |
| Sex effect | *** | *** | *** | *** | *** | *** | |
| Male | 155 | 1.49±.015a | 37.5±.197a | 28.11±.16a | 8.64±.055a | 5.7±.079a | 1.83±.062a |
| Female | 265 | 1.17±.01b | 34.13±.134b | 26.75±.11b | 7.43±.037b | 3.17±.054b | 0.6±.042b |
| Agro ecology by sex | NS | *** | *** | NS | *** | *** | |
| G*M | 36 | 1.52±.028 | 38.35±.36 | 28.12±.29 | 8.62±.1 | 5.18±.15 | 1.17±.11 |
| G*F | 84 | 1.18±.018 | 35.1±.24 | 27.1±.19 | 7.51±.07 | 3.43±.09 | 0.76±.08 |
| T*M | 29 | 1.49±.031 | 37.37±.41 | 28.2±.33 | 8.51±.11 | 5.81±.16 | 2.37±.13 |
| T*F | 91 | 1.17±.018 | 32.62±.23 | 26.1±.19 | 7.27±.06 | 3.13±0.9 | 0.75±.07 |
| C*M | 90 | 1.46±.018 | 28.12±.29 | 28±.19 | 8.79±.06 | 6.11±.09 | 1.96±.07 |
| C*F | 90 | 1.15±.018 | 27.1±.19 | 27.27±.19 | 7.5±.06 | 2.94±.09 | 0.31±.07 |
Table text extracted from the original PDF; superscript letters are shown inline. The original table image is below.
View original table image
The overall mean square of body weight obtained for mature chickens were significantly varied in body weight (p< 0.05).
The overall mean for body weight obtained for mature chicken was 1.33±.009 kg which is higher than 1.2 kg of (Nigussie Dana, 2011) [31] . But, it's lower than the average weight of the indigenous chicken of the Central High-altitudes of Ethiopia (1.5 kg) reported by Alemu Yami and Tadelle Dessie (1997) [5] . Similarly, the overall mean body weight for mature cocks 1.49±.01 and hens 1.17±.01 were higher than 1.26kg and 0.87kg for mature cocks and hens of northwest Ethiopian chicken reported by Halima Hassen (2007) [21,22] also, it`s lower and slightly similar with the result of Eskinder Aklilu (2013) [16] 1.69 kg for Horro and 1.42kg for Jarso male ecotypes respectively. The average shank length of males found in this study 8.64±.05 is lower than report of Nigussie Dana (2011) [31] with the shank length of 9.22cm for cocks. Similarly, the female shank length 7.43±.037 is in line with the range of shank length (6.6-7.8 cm) in five ecotypes of Ethiopia (Nigussie Dana et al., 2010) [31] but shorter than 9.2 cm in Horro and 8.5 cm in Jarso ecotypes (Eskinder Aklilu, 2013) [16] . Among the fixed effects, sex influenced all the traits significantly (p<0.05). Traits like body length, comb height, wattle length and wing span were significant at (p<0.05) affected by agro-ecology, sex and (sex with agro ecology) interaction effect.
Performance of Local Chicken Ecotypes
According to the estimate of the respondents, the average age at first lay of village chicken in urban, peri-urban and rural areas were not significant at (p<0.05). However, clutch size/year, average number of eggs/hen/year, number of hens hatched/ incubated and number of hens survived per hatch was highly significant at (p<0.05). This indicated the effect of management system at different locations. The overall mean age at first lay in the study areas 5.18±0.07 is less than result of 5.35, 5.5, 6.8 months reported by Mammo Mengesha (2006) [28] , Halima Hassen (2007) [22] and Fisseha Moges et al.
(2010) [17] , respectively for village chickens. Also, the average number of eggs/year 64.78±2.18 in urban, 55.4±1.67 in periurban and 50.18±1.09 and in rural areas is significantly different across the production systems. These resulted from different management practices of the three areas. Also the overall average result 56.78±1.08 is greater than result of the total egg production per hen per year of local hen is 47.35, 49.13 and 47.51 eggs in Kowet, Menze Gera Mider and Moretina Jiru districts, respectively (Agide Yisma, 2015) [3] and is compatible with 54.48 and 55.23 in Horro and Jarso, respectively (Eskinder Aklilu, 2013) [16] . The average number of eggs/ clutch/hen is 19.01, 18.53 and 17.51 in urban, peri-urban and rural areas, respectively. This result is higher than the finding of Eskinder Aklilu (2013) [16] who reported 15.00 and 12.94 eggs in Horro and Jarso, respectively and 15.7, 13.2 and 14.9 eggs in Bure, Fogera and Dale districts, in Ethiopia, respectively reported by Azage et al. (2010) but, the result from rural area 17.51 is similar with the result of Tadelle Dessie (2003) [39] who reported 17.7 eggs for five regions in Ethiopia.
Conclusion and recommendations 5.1 Conclusion
The husbandry practice in urban location is better in terms of feeding and providing separate shelter for their chickens, followed by peri-urban and rural areas. The study showed the presence of different breeding objectives at urban, peri-urban and rural areas. On the other hand, the breeding practices in the study area was characterized by uncontrolled mating and absence of planned breeding program but selection takes place for hens with high hatching ability during incubating the egg.
On the basis of qualitative and quantitative characters observed in the study areas, it is concluded that local chicken populations constitute various subpopulations which exist in various plumage forms and colours which may vary in frequency of occurrence from one location to another. The local chicken eco-types at the study areas had normal feather morphology and distribution. Naked neck ecotype was found at low-altitude of study areas, this was due to the mechanism of its heat resistance. Based on the morphological characteristics of the local chickens, it is concluded that local chicken populations studied are not unique from the rest of the Ethiopian indigenous chicken populations as the observed characters are also found in other areas of the country. However, further studies involving morphometric, production and molecular analyses are important for exhaustive characterization. Such information will form a basis for conservation, selection and sustainable improvement strategies for the identified prospective local chickens. The local chickens found in urban area produced the average number of 64.78±16.85 eggs, followed by 55.4±12.96 in periurban and 50.18±8.42 in rural areas. In addition, the chicks survived per hatch were highly significant (P<0.05) in the three locations. So, this implicate that the different location management system influences the productivity and survival rate of the indigenous chickens. In all locations, eco-types which have red and red brown plumage color with double/pea comb type had better market value and were more preferred than others for consumption. The low preference of other ecotypes plumage colors and single comb types by the consumers may cause danger to the conservation of the genes of these eco-types poses. Disease is ranked first as a major constraint which hinders the village chicken production in different locations, followed by husbandry practices like housing, feeding and predators. In urban and peri-urban areas the respondents' loss of interest in producing chickens because village chickens scatter litter and root up vegetation's and flowers in the garden of their compound and neighbors. Also agricultural development experts' support regarding the production of indigenous chickens was found to be limited. They rather encourage the owners to rare exotic chickens for better production output. This activity of the development experts did not explore the unique feature of the indigenous chickens to produce. That is why the issue was raised as one of the major constraints hindering the production of indigenous chickens.
Recommendations
Based on the parameters studied the indigenous ecotypes have various performance capabilities suggesting that selection could be an option for improvement intervention. Selection of the chickens based on plumage color is observed as major selection criteria by farmers and needs to be strengthened as it may also help to conserve the ecotypes. Besides rising the awareness of farmers on selection of chickens based on productive performance is crucial to increase selection response of indigenous ectypes. Conducting characterization at molecular level would provide detail information on the unique variations of the ecotypes included in the study.
Figures and tables from the paper
| Production system | — | — | — | — | — |
|---|---|---|---|---|---|
| Urban (N=60) | Peri-urban (N=60) | Rural (N=60) | Overall (N=180) | ||
| Housing | Separate shelter | 68.3% | 56.7% | 15% | 46.7% |
| Perch in house | - | 13.3% | 21.7% | 11.7% | |
| Perch in kitchen | 18.3% | 18.3% | 43.3% | 26.7% | |
| Perch in veranda | 13.3% | 11.7% | 20% | 15% | |
| Method of waste disposal | Fertilizer | 1.7% | 33.3% | 41.7% | 25.6% |
| Thrown away | 98.3% | 66.7% | 58.3% | 74.4% |
Table text extracted from the original PDF; superscript letters are shown inline. The original table image is below.
View original table image
| Activities related to breeding practice | Production system | — | — | — |
|---|---|---|---|---|
| Urban (N=60) | Peri urban (N=60) | Rural (N=60) | Overall (N=180) | |
| N % | N % | N % | N % | |
| Selection | ||||
| Yes | 60(100) | 60(100) | 58(96.7) | 178(98.9) |
| No | - | - | 2(3.3) | 2(1.1) |
| Selection of chickens | ||||
| Rosters | - | 3(5) | 4(6.7) | 12(6.7) |
| Hens | 60(100) | 52(86.7) | 52(86.7) | 156(86.7) |
| Both | - | 5(8.3) | 4(6.7) | 12(6.7) |
| Trait preference | ||||
| Weight | 3(5) | 5(8.3) | 2(3.3) | 10(5.6) |
| Egg production | 57(95) | 50(83.3) | 54(90) | 161(89.4) |
| color | - | 5(8.3) | 4(6.7) | 9(5) |
| Breed preference | ||||
| Local | 21(35) | 17(28.3) | 25(41.7) | 63(35) |
| Exotic | 2(3.3) | 10(16.7) | 10(16.7) | 22(12.2) |
| Cross | 37(61.7) | 33(55) | 25(41.7) | 95(52.8) |
| Broodiness | ||||
| Common | 4(6.7) | 11(18.3) | 15(25) | 30(16.7) |
| Sometimes | 28(46.7) | 43(71.7) | 45(75) | 116(64.4) |
| Rare | 28(46.7) | 6(10) | - | 34(18.9) |
| Unwanted broodiness | ||||
| Hanging hen upside down | - | 5(8.3) | 15(25) | 20(11.10 |
| Inserting feathers through nostrils | - | - | 2(3.3) | 2(1.1) |
| Taking to another place | 11(18.3) | 16(26.7) | 18(30) | 45(25) |
| Tying | 49(81.7) | 34(56.7) | 17(28.3) | 100(55.6) |
| Taking the brooding nest | - | 5(8.3) | 8(13.3) | 13(7.2) |
| Materials used for incubating | ||||
| Mud containers | 2(3.3) | 24(40) | 47(78.3) | 73(40.6) |
| Clay/other materials | 8(13.3) | 3(5) | 2(3.3) | 13(7.2) |
| Making hole | - | - | 2(3.3) | 3(1.7) |
| Carton with straw | 50(83.3) | 33(55) | 9(15) | 91(50.6) |
Table text extracted from the original PDF; superscript letters are shown inline. The original table image is below.
View original table image
| Plumage color | Gamachis (n=120) | Tullo (n=120) | Chiro (n=180) | Overall (n=420) |
|---|---|---|---|---|
| N (%) | N (%) | N (%) | N (%) | |
| Red (kei) and red brown(key dama) | 57(47.5) | 39(32.5) | 63(35) | 159(38.33) |
| Black (tikur) | 20(16.7) | 23(19.2) | 18(10) | 61(14.5) |
| Wheaten(daleti) | 27(22.5) | 31(25.8) | 36(20) | 94(22.4) |
| White (netch) | 7(5.8) | 13(10.8) | 31(17.2) | 51(12.1) |
| Reddish &White (libework) | 5(4.2) | 6(5) | 14(7.8) | 25(6) |
| Yellowish & black (gebsima) | 4(3.3) | 8(6.7) | 18(10) | 30(7.1) |
| X2 = 70.600* |
Table text extracted from the original PDF; superscript letters are shown inline. The original table image is below.
View original table image
| Parameter | Gamachis (N=120) | Tullo (N=120) | Chiro (N=180) | Overall (n=420) | X2 |
|---|---|---|---|---|---|
| N % | N % | N % | N % | ||
| Sex | |||||
| Male | 36(30) | 29(24.16) | 90(50) | 155(36.9) | 57.943a |
| Female | 84(70) | 91(75.83) | 90(50) | 255(63.1) | |
| Feather morphology | |||||
| Normal | 120(100) | 120(100) | 144(80) | 384(91.4) | 288.343a |
| Silky | - | - | 36(20) | 36(8.6) | |
| Feather Distribution | |||||
| Normal | 110(91.7) | 88(73.3) | 90(50) | 288(68.6) | 434.933b |
| Naked neck | - | - | 18(10) | 18(4.3) | |
| Muffs and beard | - | 20(16.7) | 36(20) | 56(13.3) | |
| Crested-head | 10(8.3) | 12(10) | 36(20) | 58(13.8) | |
| Plumage pattern | |||||
| Plain | 120(100) | 91(75.8) | 117(65) | 328(78.1) | 132.610a |
| Barred | - | 29(24.2) | 63(35) | 92(21.9) | |
| Shank color | |||||
| White | 46(38.3) | 60(50) | 81(45) | 187(44.5) | 118.557d |
| Yellow | 65(54.2) | 34(28.3) | 99(55) | 198(47.1) | |
| Green black | 9(7.5) | 26(21.7) | - | 35(8.3) | |
| Ear-lobe color | |||||
| White | 27(22.5) | 24(20) | 27(15) | 78(18.6) | 155.486b |
| Red | 9(7.5) | 30(25) | 63(35) | 102(24.3) | |
| White and red | 64(53.3) | 62(51.7) | 81(45) | 207(49.3) | |
| Yellow | 20(16.7) | 4(3.3) | 9(5) | 33(7.9) | |
| Comb type | |||||
| Single | 38(31.7) | 24(20) | 18(10) | 80(19) | 160.952a |
| Double | 82(68.3) | 96(80) | 162(90) | 340(81) | |
| Comb size | |||||
| Small | 46(38.3) | 82(68.3) | 45(25) | 173(41.2) | 23.271d |
| Medium | 74(61.7) | 15(12.5) | 63(35) | 152(36.2) | |
| Large | - | 23(19.2) | 72(40) | 95(22.6) |
Table text extracted from the original PDF; superscript letters are shown inline. The original table image is below.
View original table image
References
15 in the original paper- Aberra Melesse, Tegene Negesse. Phenotypic and morphological characterization of Indigenous chicken population in Southern region of Ethiopia. Animal Genetic Resources Information Journal. 2011;49:19-31.
- Benitez F. Reasons for the use and Conservation of Some Local Genetic Resources in Poultry, In: Proc. 7th World Cong. Genetic Applied Livestock Production, August 1923, 2002, Montpellier, France; c2002.
- Cabarles Jr JC, Lambio AL, Vega SA, Capitan SS, Mendioro MS. Distinct morphological features of traditional chickens (Gallus gallus domesticus L.) in Western Visayas, Philippines. Animal Genetic Resources. 2012;51:73-87. Doi: 10.1017/S2078633612000410
- Central Statistical Agency. Livestock and livestock characteristics: Statistical bulletin. Addis Ababa, Ethiopia. 2015/16;3:583.
- Daikwo IS, Okpe AA, Ocheja JO. Phenotypic Characterization of Local Chickens in Dekina. International Journal of Poultry Science. 2011;10:444447.
- Dorji N, Gyeltshen T. Characterizations of family poultry production in Haa and Mongar districts of Bhutan Livestock Research for Rural Development. 2012;24(155). Retrieved February 6, 2015, from http://www.lrrd.org/lrrd24/9/dorj24155.htm
- Duguma Reta. Phenotypic characterization of some indigenous chicken ecotypes of Ethiopia Livest Res. Rural Dev. 2006;18(9). Available at www.cipav.org.co/lrrd/lrrd18/9/dugu18131.htm.
- Guèye EF. Village egg and fowl meat in Africa Regional report World's Poultry Sci. J. 1998;54:73-86.
- Halima Hassen, Neser FWC, Van Marle-Koster E, Kock ADE. Village based indigenous chicken production systems in north-west Ethiopia. Trop. Anim. health Prod. 2007;39(3):189-197.
- Horst P. Native fowl as reservoir for genomes and major genes with direct and indirect effects on the adaptability and their potential for tropically oriented breeding plans, Archiv für Geflügelkunde. 1989;53(3):93-101.
- Ige AO, Salako AE, Yakubu A, Adeyemi SA. Qualitative Traits Characterization of Yoruba and Fulani Ecotype Indigenous Chickens in Derived Savannah Zone of Nigeria. International Journal of Poultry Science. 2012;11(10):616-620. http://www.pjbs.org/ijps/fin2264.pdf
- Nega Mekonnen, Aklilu H/Michael, Haimanot Disassa. Reproductive and Productive Performance of Poultry Kept in Rural, Peri-Urban and Urban Settings in Assosa District, Benshangul Gumuz Region, Western Ethiopia. Department of Animal Science, Assosa University, Assosa, Ethiopia Axsum University, Axum Ethiopia. Nature and Science. 2016;14(1):8-14.
- Reta Duguma. Phenotypic characterization of some indigenous chicken ecotypes of Ethiopia, Livestock Research for Rural Development, 2006. 18. Article #131
- Sewannyana E, Ssali A, Kasadha T, Dhikusooka M, Kasoma P, Kalema J, et al. On-farm characterization of indigenous chickens in Uganda. Journal of Animal and Plant Sciences. 2008;1(2):33-37 http://www.m.elewa.org/JAPS/2008/1.2/1.pdf
- Tadelle Dessie, Ogle B. Village poultry production systems in the central high-altitudes of Ethiopia Trop. Anim. health Prod. 2001;33(6):521-537.
Cited by 5
From OpenAlex, OpenCitations and reference lists read by Scinovex
- Relationship between Village Chicken Availability and Dietary Diversity along a Rural–Urban Gradient ↗
Cresswell Mseleku, M. Chimonyo, Rob Slotow, Mjabuliseni Simon Cloapas Ngidi · Nutrients · 2024
Dietary diversity is one of the fundamental factors of nutritional security and a proxy used to measure diet quality. The objective of this study was to investigate the relationship between village chicken availability and the dietary diversity of households along a rural–urban gradient. Face-to-face interviews were conducted using a structured questionnaire in rural (n = 100), peri-urban (n = 100),…
❝ 2PDF - Genetic basis of Abigar and Sheko cattle breed adaptations in the tsetse infested lowlands of Ethiopia: A review ↗
Abera Fekata Dinkissa · International Journal of Bioscience and Biochemistry · 2023
The objective of this review paper was to assess the genetic foundation of the Abigar and Sheko cattle breeds and their adaptations in the tsetse-infected lowlands of Ethiopia. Sheko cattle are more resistant to biting fly attacks and maintain their body condition, unlike Zebu cattle, making them less likely to get the disease. The sheko breed is prized for its
❝ 1Found by Scinovex - Preliminary major health problems and associated risk factors of calves’ mortality in selected districts of Ilubabor and Jimma Zones, Ethiopia
Moti Wakgari Amenta · International Journal of Agriculture and Food Science · 2024
Introduction: Even though good beginnings of initiatives on calves to improve blood level of local breeds in Ethiopia through artificial insemination, health problems and calf mortality are becoming a bottle neck on livestock production and livelihood of poor farmers. The aim of the study was to know preliminary major health problems and associated risk factors of calves’ mortality. Cross-sectional study was conducted on calves from February to June 2023. Binary outcome Logistic Regression data analysis was used to summarize using Stata software version 13. Cluster random sampling technique wa
- Prevalence of poultry coccidiosis in and around Jimma town, south western Ethiopia
Abdisa Keshu, Gemeda Dilgasa, Wazir Shafi · International Journal of Biology Sciences · 2023
A cross sectional study design was conducted from November, 2014 to April, 2015 to estimate the prevalence of poultry coccidiosis in and around Jimma town, south western Ethiopia and to assess its relationship with different risk factors. Simple random sampling technique was conducted to select birds found in and around the town. Test tube flotation technique was used for qualitative study of coccidial oocyst and descriptive statistics was utilized to summarize the data. The association between the prevalence of the disease and risk factors was assessed by Chi-square. Out of the total 384 chic
- Review on current epidemiological status and public health importance of bovine tuberculosis in Ethiopia ↗
Yeshiwas Tarekegn · Zoological and Entomological Letters · 2023
The review conducted in these papers revealed the prevalence estimate of B. tuberculosis in Ethiopia was determined to be 5.8%. Bovine tuberculosis (BTB) is a known endemic illness of cattle in Ethiopia. The prevalence of intensive dairy production systems was higher (3.1-68%) than that of large livestock production systems (3.4-6.2%) and slaughterhouses (3.5-32%) in different regions of the nation. In