
Research article · 2019 · Full text
International Journal of Horticulture and Food ScienceEffect of different chemical preservatives on preservation of pear nectar
Volume 1(2) · Pages 35–40 · DOI: 10.33545/26631067.2019.v1.i2a.27 ↗
Research areasSensory Analysis and Statistical MethodsEssential Oils and Antimicrobial ActivityBotanical Research and Applications
Abstract
Author-writtenThe study was conducted to estimate the effect of antimicrobial agents for example sodium benzoate and potassium sorbate separately and in combination with different concentration for preservation of pear nectar. The samples were packed in 250 ml transparent plastic bottles at room temperature for storage period of 90 days. The treatments were P0 (pear nectar with no preservative), P1 (pear nectar + 0.1% sodium benzoate), P2 (pear nectar + 0.1% potassium sorbate), P3 (pear nectar + 0.05% sodium benzoate), P4 (pear nectar + 0.05% potassium benzoate) and P5 (pear nectar + 0.05% sodium benzoate and 0.05% potassium sorbate). Samples of pear nectar were evaluated for total soluble solids, ascorbic acid, %acidity, pH, reducing and non-reducing sugar and sensory evaluation (color, flavor, taste and overall acceptability). pH decrease from 4.03 to 3.60, total soluble solids increase 14.90 to 16.03, % acidity 0.93 to 1.02,ascorbic acid decrease 7.04 to 5.15, reducing sugar increase 18.03 to 18.28, non-reducing sugar decrease 3.88 to 3.40, color decrease 8.10 to 5.57, flavor 8.20 to 5.75, taste 8.10 to 5.60 and overall acceptability decreased 7.18 to 5.02 during period of storage. The results shows that storage period and treatments had significant effect (p
Summary
Source-checkedPlain-language reading of the full paper, prepared with AI and checked against the text. Each point links to the authors' own words.
Why it matters
- Pears (Pyrus pyrifolia) are widely cultivated fruits, primarily in temperate regions. View evidence ↗
- Because fresh fruits have a short shelf life, they are processed into products to ensure they are available during the off-season. View evidence ↗
- Sodium benzoate and potassium sorbate are commonly used chemical preservatives to extend the shelf life of food products. View evidence ↗
The question
- The study aimed to evaluate how sodium benzoate and potassium sorbate, used alone or in combination at various concentrations, affect the preservation of pear nectar. View evidence ↗
What they did
- Pear nectar samples were stored in 250 ml transparent plastic bottles at room temperature for a total of 90 days. View evidence ↗
- Six treatments were tested: a control (P0), 0.1% sodium benzoate (P1), 0.1% potassium sorbate (P2), 0.05% sodium benzoate (P3), 0.05% potassium sorbate (P4), and a combination of 0.05% of both (P5). View evidence ↗
- The nectar was analyzed for physicochemical properties (TSS, ascorbic acid, acidity, pH, and sugars) and sensory attributes (color, flavor, taste, and overall acceptability). View evidence ↗
What they found
- Total soluble solids (TSS) increased during storage, with the highest increase in the control (P0, 11.74%) and the lowest in the combination treatment (P5, 4.90%). View evidence ↗
- Acidity increased during storage, showing the maximum increase in the control (P0, 17.78%) and the minimum in the combination treatment (P5, 6.67%). View evidence ↗
- Ascorbic acid levels decreased over time, with the most significant loss in the control (P0, 38.83%) and the least loss in the combination treatment (P5, 16.90%). View evidence ↗
- The pH of the nectar decreased during storage, with the largest drop in the control (P0, 18.85%) and the smallest drop in the combination treatment (P5, 6.93%). View evidence ↗
- Non-reducing sugars decreased during storage, with the highest decrease in the control (P0, 14.07%) and the lowest in the combination treatment (P5, 9.87%). View evidence ↗
- Color scores declined during storage, with the control (P0) showing the highest decline (44.44%) and the combination treatment (P5) showing the lowest (22.22%). View evidence ↗
- Flavor scores decreased most in the control (P0, 43.75%) and least in the combination treatment (P5, 22.35%). View evidence ↗
- Taste scores showed the highest decline in the control (P0, 43.75%) and the lowest decline in the combination treatment (P5, 22.50%). View evidence ↗
- Overall acceptability decreased most in the control (P0, 45.71%) and least in the combination treatment (P5, 15.06%). View evidence ↗
What it means
- The authors concluded that the combination of 0.05% potassium sorbate and 0.05% sodium benzoate (P5) and 0.1% sodium benzoate (P1) were the most effective preservatives, whereas the control (P0) performed poorly. View evidence ↗
Visual summary
1 visualsIllustrations explain the paper; they do not show study data.
Preservative Treatment Groups
AI-generated conceptual illustration (glass bottles of pear nectar). It explains the idea and does not show study data.
View source evidence ↗Figures & tables
From the original paper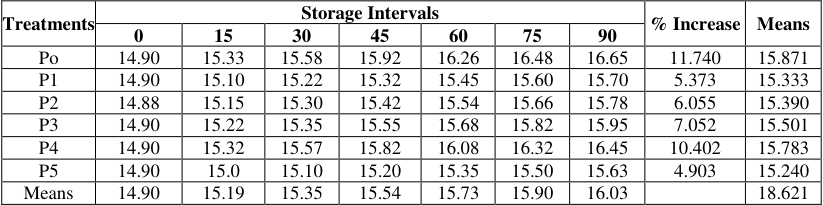 Table 1
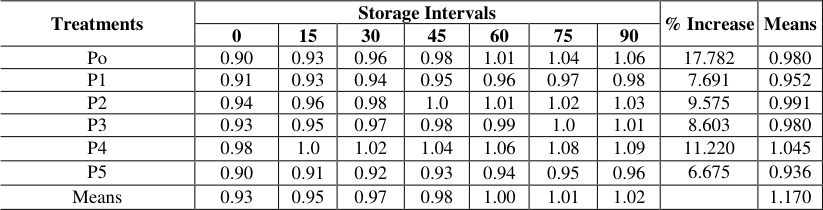 Table 2
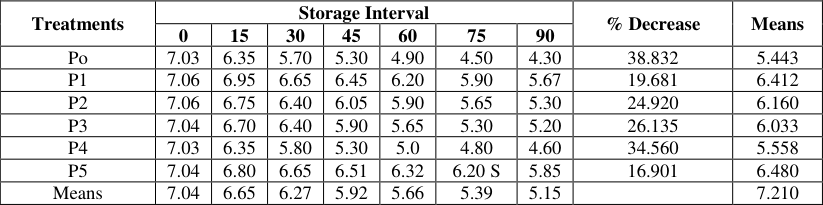 Table 3
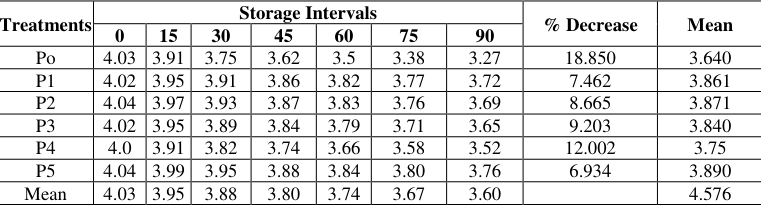 Table 4
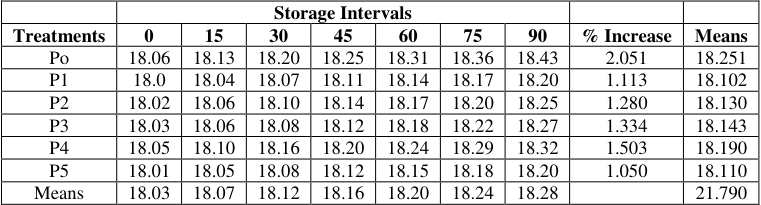 Table 5
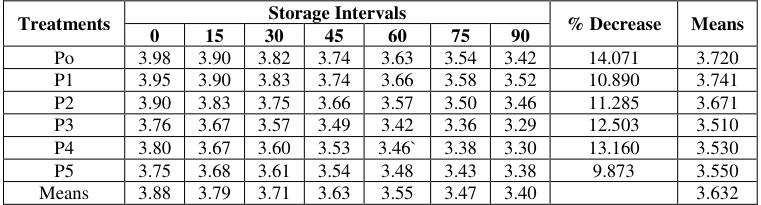 Table 6
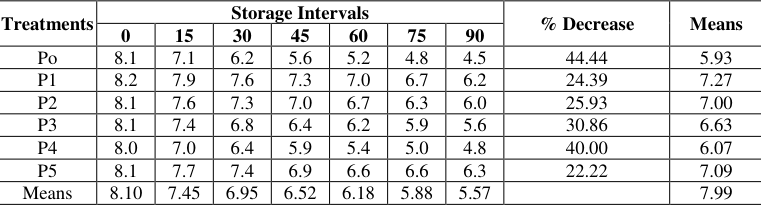 Table 7
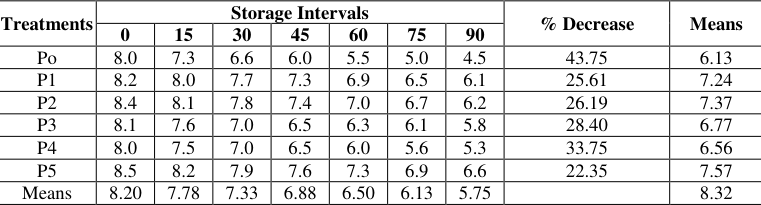 Table 8
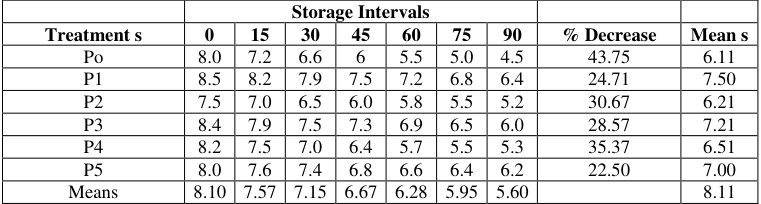 Table 9
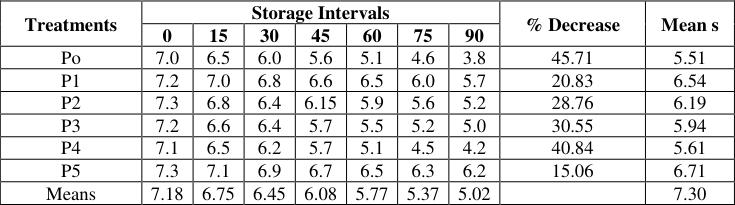 Table 10
Introduction
The pear (Pyrus pyrifolia) is a tree and shrub specie of genus Pyrus in the family Rosaceae. The pear is cultivated all over the world and mostly produced in temperate zone (Shakir et al., 2009) [34] , pear has low caloric level and very delicious to eat, it is liked by the consumer. It has a low content of protein and lipids and is rich in sugar (Sensor et al., 1999) [33] . The total area under cultivation of pear in Pakistan is 2.4 thousand hectares which include 0.1 Punjab, 1.8 KPK, 0.2 thousand hectares Baluchistan while the total production in Pakistan is 19.0 thousand tones which includes 0.1 Punjab, 18.4 KPK, 0.5 thousand tons Baluchistan (Agriculture Statistics of Pakistan, 2011-2012). Pear help in producing 242 KJ energy, 15.46g carbohydrates, 3.1g dietary fibers, 0.38g protein, 119mg potassium, 4.2mg vitamin C, 9mg calcium, 0.17mg iron, 7mg magnesium, 11mg phosphorus, 0.157mg niacin(vit B3), 0.028mg vitamin B6, 0.012mg thiamine and 0.025mg riboflavin (Vit.B2) per 100g to our body (USDA Nutrient database 2009) [38] . The shelf life of fruits is not prolong so fruit based products are processed to make sure the availability in off season. Chemical preservatives such as sodium benzoate and potassium sorbate have been used in food products to enhance their shelf life (Mishra et al., 2011) [27] . Use of chemical additives in food preservation has low cost as well either to be used into the products. Due to greater solubility in water, the salts of sorbic acid are mostly used in food. Sorbate act as a primary inhibitor against yeast and molds while the activity against bacteria is not wide-ranging and appears to be selective, overall sorbates are the safest food preservatives for juice and nectar preservation (Shew et al., 1995) [37] .
Materials and Methods
Sound and healthy pear of proper size and optimum maturity were collected from Azad Jammu and Kashmir and brought to the laboratory of Food Science and Technology, The University of Agriculture Peshawar Pakistan.
Preparation of samples
After washing and cutting grinder were used to extract pulp from the fruit.
And the nectar was prepared by using this extracted pulp. Pear nectar samples were prepared by the addition of water and sugar. Treatments P0 = Pear nectar without preservatives P1 = Pear nectar + 0.1% sodium benzoate P2 = Pear nectar + 0.1% potassium sorbate P3 = Pear nectar + 0.05% sodium benzoate P4 = Pear nectar + 0.05% potassium sorbate P5 = Pear nectar + 0.05% sodium benzoate + 0.05 potassium sorbate
Storage
To evaluate the physic-chemical properties and organoleptic evaluation the prepared nectar samples were packed in 250ml plastic bottles and stored at ambient temperature for 90 days and the samples were evaluated after each 15 day of interval during through the storage period.
Product Analysis Physico-chemical Analysis
Total soluble solids, Titratable acidity, pH, Ascorbic acid, Reducing sugar and Non-reducing sugar was determined by the standard method of AOAC (2012) [2] .
Sensory Evaluation
Organoleptic evaluation (color, taste, texture and overall acceptability) were evaluated by a panel of selected panel using 9-point hedonic scale of Larmond (1977).
Statistical Analysis
All the analyses were performed in triplicate and the results were calculated statistically by simple CRD two way analyses as recommended by (Steel and Torrie. 1998).
Results and Discussions
Pear nectar was packed in 250ml plastic bottles and analyzed for TSS in storage period of 90 days. The highest TSS mean value for treatment was noted in sample P0 (15.87°brix) followed by P4 (15.78°brix), while lowest mean value was noted in sample P5 (15.24°brix) followed by P1 (15.33°brix). During the storage period the highest increase was noted in sample P0 (11.74%) followed by P4 (10.40%) and lowest increase was observed in sample P5 (4.90%) followed by P2 (5.37%). TSS may be increase during storage due to the conversion of sucrose into (glucose + fructose). The results of TSS closely related to the findings of Ayub et al. (2010) they founded increase in TSS value from (16.5 to 17.4obrix. Pear nectar was packed in 250ml plastic bottles and analyzed for acidity in storage period of 90 days. Table .2 shows the statistical data of mean value of % acidity which was significantly (p<0.05) increased from 0.93 -1.02 during storage period. Pear nectar sample P4 showed the highest mean value of %acidity (1.04) which was followed by P2 (0.99), whereas, pear nectar sample P5 (0.93) observed lowest mean value followed by P1 (0.95). Maximum increase was noted in P0 (17.78%) followed by P4 (11.22%) and minimum acidity value recorded in P5 (6.67%) followed by P1 (7.69%). The results of current research work similar to the findings of Cecilia and Maia (2002) [7] they found increase in % acidity caused by acidic compound formation and oxidation of reducing sugar in apple juice during storage temperature, increased in acidity may be caused due to oxidation of reducing sugar into pectinic acid (Iqbal et al. 2001) [19] . Pear nectar was packed in 250ml plastic bottles and analyzed for ascorbic acid in storage period of 90 days. Table .3 showed that ascorbic acid mean value significantly (p<0.05) minimized from 7.04 to 5.15 mg/100g, whereas maximum value of ascorbic acid for treatments was obtained in P5 (6.48) which was followed by P1 (6.41) mg/100g, however minimum value of mean was calculated in P0 (5.44) mg/100g followed by P4 (5.55) mg/100g. P0 (38.83%) showed the highest decrease followed by P4 (34.56%) and lowest decline was observed in P5 (16.90%) followed by P1 (19.68%). Ayub et al. (2010) deliberated that during storage period minimum loss of ascorbic acid had occurred by the addition of sodium benzoate and potassium sorbate. Pear nectar was packed in 250ml plastic bottles and analyzed for pH in storage period of 90 days. The decreasing mean of pH presented in Table-4 which showed decline significantly (p<0.05) from 4.03 to 3.60 during storage where P5 (3.89) followed by P2 (3.87) found as highest mean value of pH and sample P0 (3.64) followed by P4 (3.75) observed as lowest mean. Results revealed that highest decrease was recorded in nectar sample P0 (18.85%) followed by P4 (12.0%) while lowest decrease was recorded in sample P5 (6.93%) followed by P1 (7.46%). pH of the sample might be decreased due to the conversion of pectin into organic acid or also due to minimum increment in acidity during the storage period. Previously Imran et al. (2000) [20] stated that declined in pH value may be due to the conversion of pectin into organic acid. Pear nectar was packed in 250ml plastic bottles and analyzed for reducing sugar in storage period of 90 days. The results of current research work revealed that the reducing sugar value increased from 18.03 to 18.28 during the storage period Table-V and the highest mean value observed in sample P0 (18.25) followed by P4 (18.19) while least mean value was noticed in sample P1 (18.10) followed by P5 (18.11). Results shows that highest increase was found in P0 (2.05%) followed by P4 (1.50%) while least increased in pear nectar sample P5 (1.05%) followed by P1 (1.11%). Kinh et al. (2001) [21] stated in their research work that breakdown of sucrose into (glucose + fructose) may be caused increment in reducing sugar in the presence of acidity. Pear nectar was packed in 250ml plastic bottles and analyzed for non-reducing sugar in storage period of 90 days. Results shows that non-reducing sugar was calculated highest mean value in nectar sample P1 (3.74) followed by P0 (3.72) whereas least value found in P3 (3.51) followed by P4 (3.53). The highest decrease noticed in sample P0 (14.07%) followed by P4 (13.16%) while lowest in sample P5 (9.87%) followed by P1 (10.89%). The results of nonreducing sugar value related to the findings of Hussain et al.
(2010) they revealed that non-reducing sugar value from (6.99 to 6.57). The decline in non-reducing sugar value may be due to the conversion of non-reducing sugar in to glucose and fructose Sandi et al. (2004) [31] similarly Ali (1965) [3] reported that during the storage period increase in reducing sugar may be responsible due to the conversion of nonreducing sugar into reducing sugar.
Sensory Evaluation
The pear nectar samples were evaluated for sensory evaluation (color, flavor, taste and overall acceptability) in the presence of panel judges they scored 9-1 extremely like and dislike by pre described method of Larmond (1977). The results of panel judge represented that the maximum mean value was observed P1 (7.27) followed by P5 (7.09), while minimum mean value noted in sample P0 (5.93) followed by P4 (6.07) whereas the highest decline in color score was found in nectar sample P0 (44.44%) followed by P4 (40%) awhile least score noticed P5 (22.22%) followed by P1 (24.39%). Previous work revealed that due to the presence of oxygen and non-enzymatic browning responsible in color degradation Brendor et al. (1985) [4] . During the storage period the flavor of samples decreased from 8.2 to 5.75 significantly (p<0.05) which represented in Table-VIII. The highest mean value for the pear nectar sample was noted in P5 (7.57) followed by P2 (7.37), and lowest was found in P0 (6.13) followed by P4 (6.56). The highest decrease was noticed in sample P0 (43.75%) followed by P4 (33.75%) while lowest decrease was found in sample P5 (22.35%) followed by P1 (25.61%). Previously Navarro et al. (1981) studied in their research work Valencia orange concentrates (60 0Brix) stored at 0-9.0 and 18 0C to find out the adequate conditions for bulk storage at 0oC and revealed that flavor of the product lose during the storage. Similarly Ayub et al. (2005) also stated that decline in flavor (5.04 to 3.14) during storage of guava slice. The mean score for taste was significantly (p<0.05) decreased from 8.10 to 5.60 with the passage of time (Table-IX). The highest mean value was noted in sample P1 (7.50) followed by P3 (7.21) and lowest was found in sample P0 (6.11) followed by P 2 (6.21). The highest decline in score was noticed in sample P0 (43.75%) followed by P4 (35.37%) while lowest decrease was recorded in sample P5 (22.50%) followed by P1 (24.71%). The results of this research work closely related to the findings of Marcy et al. (1984) [25] they reported that effect of storage temperature and time on quality of orange juice stored at 12.2, 6.6, 1.1 and 4.4 0C and also increased in acidity responsible for the degradation of taste. During storage period the maximum mean value was calculated in sample P5 (7.93) followed by P1 (6.54) and minimum mean value was recorded in sample P0 (5.51) followed by P4 (5.61). The highest decrease was noted in sample P0 (45.71%) followed by P4 (4.84%) while lowest decrease was noticed in sample P5 (15.06%) followed by P1 (20.83%). Rosario (1996) [30] studied in his research work with the passage of time and the presence of temperature responsible in breakdown of quality of any fruit which results in decline in overall acceptability similar study was found by Kinh et al. (2001) [21] they preserved apple pulp with the addition of potassium metabisulphite.
Figures and tables from the paper
| Treatments | Storage Intervals | — | — | — | — | — | — | % Increase | Means |
|---|---|---|---|---|---|---|---|---|---|
| 0 | 15 | 30 | 45 | 60 | 75 | 90 | |||
| Po | 14.90 | 15.33 | 15.58 | 15.92 | 16.26 | 16.48 | 16.65 | 11.740 | 15.871 |
| P1 | 14.90 | 15.10 | 15.22 | 15.32 | 15.45 | 15.60 | 15.70 | 5.373 | 15.333 |
| P2 | 14.88 | 15.15 | 15.30 | 15.42 | 15.54 | 15.66 | 15.78 | 6.055 | 15.390 |
| P3 | 14.90 | 15.22 | 15.35 | 15.55 | 15.68 | 15.82 | 15.95 | 7.052 | 15.501 |
| P4 | 14.90 | 15.32 | 15.57 | 15.82 | 16.08 | 16.32 | 16.45 | 10.402 | 15.783 |
| P5 | 14.90 | 15.0 | 15.10 | 15.20 | 15.35 | 15.50 | 15.63 | 4.903 | 15.240 |
| Means | 14.90 | 15.19 | 15.35 | 15.54 | 15.73 | 15.90 | 16.03 | 18.621 |
Table text extracted from the original PDF; superscript letters are shown inline. The original table image is below.
View original table image
| Treatments | Storage Intervals | — | — | — | — | — | — | % Increase | Means |
|---|---|---|---|---|---|---|---|---|---|
| 0 | 15 | 30 | 45 | 60 | 75 | 90 | |||
| Po | 0.90 | 0.93 | 0.96 | 0.98 | 1.01 | 1.04 | 1.06 | 17.782 | 0.980 |
| P1 | 0.91 | 0.93 | 0.94 | 0.95 | 0.96 | 0.97 | 0.98 | 7.691 | 0.952 |
| P2 | 0.94 | 0.96 | 0.98 | 1.0 | 1.01 | 1.02 | 1.03 | 9.575 | 0.991 |
| P3 | 0.93 | 0.95 | 0.97 | 0.98 | 0.99 | 1.0 | 1.01 | 8.603 | 0.980 |
| P4 | 0.98 | 1.0 | 1.02 | 1.04 | 1.06 | 1.08 | 1.09 | 11.220 | 1.045 |
| P5 | 0.90 | 0.91 | 0.92 | 0.93 | 0.94 | 0.95 | 0.96 | 6.675 | 0.936 |
| Means | 0.93 | 0.95 | 0.97 | 0.98 | 1.00 | 1.01 | 1.02 | 1.170 |
Table text extracted from the original PDF; superscript letters are shown inline. The original table image is below.
View original table image
| Treatments | Storage Interval | — | — | — | — | — | — | % Decrease | Means |
|---|---|---|---|---|---|---|---|---|---|
| 0 | 15 | 30 | 45 | 60 | 75 | 90 | |||
| Po | 7.03 | 6.35 | 5.70 | 5.30 | 4.90 | 4.50 | 4.30 | 38.832 | 5.443 |
| P1 | 7.06 | 6.95 | 6.65 | 6.45 | 6.20 | 5.90 | 5.67 | 19.681 | 6.412 |
| P2 | 7.06 | 6.75 | 6.40 | 6.05 | 5.90 | 5.65 | 5.30 | 24.920 | 6.160 |
| P3 | 7.04 | 6.70 | 6.40 | 5.90 | 5.65 | 5.30 | 5.20 | 26.135 | 6.033 |
| P4 | 7.03 | 6.35 | 5.80 | 5.30 | 5.0 | 4.80 | 4.60 | 34.560 | 5.558 |
| P5 | 7.04 | 6.80 | 6.65 | 6.51 | 6.32 | 6.20 S | 5.85 | 16.901 | 6.480 |
| Means | 7.04 | 6.65 | 6.27 | 5.92 | 5.66 | 5.39 | 5.15 | 7.210 |
Table text extracted from the original PDF; superscript letters are shown inline. The original table image is below.
View original table image
| Treatments | Storage Intervals | — | — | — | — | — | — | % Decrease | Mean |
|---|---|---|---|---|---|---|---|---|---|
| 0 | 15 | 30 | 45 | 60 | 75 | 90 | |||
| Po | 4.03 | 3.91 | 3.75 | 3.62 | 3.5 | 3.38 | 3.27 | 18.850 | 3.640 |
| P1 | 4.02 | 3.95 | 3.91 | 3.86 | 3.82 | 3.77 | 3.72 | 7.462 | 3.861 |
| P2 | 4.04 | 3.97 | 3.93 | 3.87 | 3.83 | 3.76 | 3.69 | 8.665 | 3.871 |
| P3 | 4.02 | 3.95 | 3.89 | 3.84 | 3.79 | 3.71 | 3.65 | 9.203 | 3.840 |
| P4 | 4.0 | 3.91 | 3.82 | 3.74 | 3.66 | 3.58 | 3.52 | 12.002 | 3.75 |
| P5 | 4.04 | 3.99 | 3.95 | 3.88 | 3.84 | 3.80 | 3.76 | 6.934 | 3.890 |
| Mean | 4.03 | 3.95 | 3.88 | 3.80 | 3.74 | 3.67 | 3.60 | 4.576 |
Table text extracted from the original PDF; superscript letters are shown inline. The original table image is below.
View original table image
| — | Storage Intervals | — | — | — | — | — | — | — | — |
|---|---|---|---|---|---|---|---|---|---|
| Treatments | 0 | 15 | 30 | 45 | 60 | 75 | 90 | % Increase | Means |
| Po | 18.06 | 18.13 | 18.20 | 18.25 | 18.31 | 18.36 | 18.43 | 2.051 | 18.251 |
| P1 | 18.0 | 18.04 | 18.07 | 18.11 | 18.14 | 18.17 | 18.20 | 1.113 | 18.102 |
| P2 | 18.02 | 18.06 | 18.10 | 18.14 | 18.17 | 18.20 | 18.25 | 1.280 | 18.130 |
| P3 | 18.03 | 18.06 | 18.08 | 18.12 | 18.18 | 18.22 | 18.27 | 1.334 | 18.143 |
| P4 | 18.05 | 18.10 | 18.16 | 18.20 | 18.24 | 18.29 | 18.32 | 1.503 | 18.190 |
| P5 | 18.01 | 18.05 | 18.08 | 18.12 | 18.15 | 18.18 | 18.20 | 1.050 | 18.110 |
| Means | 18.03 | 18.07 | 18.12 | 18.16 | 18.20 | 18.24 | 18.28 | 21.790 |
Table text extracted from the original PDF; superscript letters are shown inline. The original table image is below.
View original table image
| Treatments | Storage Intervals | — | — | — | — | — | — | % Decrease | Means |
|---|---|---|---|---|---|---|---|---|---|
| 0 | 15 | 30 | 45 | 60 | 75 | 90 | |||
| Po | 3.98 | 3.90 | 3.82 | 3.74 | 3.63 | 3.54 | 3.42 | 14.071 | 3.720 |
| P1 | 3.95 | 3.90 | 3.83 | 3.74 | 3.66 | 3.58 | 3.52 | 10.890 | 3.741 |
| P2 | 3.90 | 3.83 | 3.75 | 3.66 | 3.57 | 3.50 | 3.46 | 11.285 | 3.671 |
| P3 | 3.76 | 3.67 | 3.57 | 3.49 | 3.42 | 3.36 | 3.29 | 12.503 | 3.510 |
| P4 | 3.80 | 3.67 | 3.60 | 3.53 | 3.46` | 3.38 | 3.30 | 13.160 | 3.530 |
| P5 | 3.75 | 3.68 | 3.61 | 3.54 | 3.48 | 3.43 | 3.38 | 9.873 | 3.550 |
| Means | 3.88 | 3.79 | 3.71 | 3.63 | 3.55 | 3.47 | 3.40 | 3.632 |
Table text extracted from the original PDF; superscript letters are shown inline. The original table image is below.
View original table image
| Treatments | Storage Intervals | — | — | — | — | — | — | % Decrease | Means |
|---|---|---|---|---|---|---|---|---|---|
| 0 | 15 | 30 | 45 | 60 | 75 | 90 | |||
| Po | 8.1 | 7.1 | 6.2 | 5.6 | 5.2 | 4.8 | 4.5 | 44.44 | 5.93 |
| P1 | 8.2 | 7.9 | 7.6 | 7.3 | 7.0 | 6.7 | 6.2 | 24.39 | 7.27 |
| P2 | 8.1 | 7.6 | 7.3 | 7.0 | 6.7 | 6.3 | 6.0 | 25.93 | 7.00 |
| P3 | 8.1 | 7.4 | 6.8 | 6.4 | 6.2 | 5.9 | 5.6 | 30.86 | 6.63 |
| P4 | 8.0 | 7.0 | 6.4 | 5.9 | 5.4 | 5.0 | 4.8 | 40.00 | 6.07 |
| P5 | 8.1 | 7.7 | 7.4 | 6.9 | 6.6 | 6.6 | 6.3 | 22.22 | 7.09 |
| Means | 8.10 | 7.45 | 6.95 | 6.52 | 6.18 | 5.88 | 5.57 | 7.99 |
Table text extracted from the original PDF; superscript letters are shown inline. The original table image is below.
View original table image
| Treatments | Storage Intervals | — | — | — | — | — | — | % Decrease | Means |
|---|---|---|---|---|---|---|---|---|---|
| 0 | 15 | 30 | 45 | 60 | 75 | 90 | |||
| Po | 8.0 | 7.3 | 6.6 | 6.0 | 5.5 | 5.0 | 4.5 | 43.75 | 6.13 |
| P1 | 8.2 | 8.0 | 7.7 | 7.3 | 6.9 | 6.5 | 6.1 | 25.61 | 7.24 |
| P2 | 8.4 | 8.1 | 7.8 | 7.4 | 7.0 | 6.7 | 6.2 | 26.19 | 7.37 |
| P3 | 8.1 | 7.6 | 7.0 | 6.5 | 6.3 | 6.1 | 5.8 | 28.40 | 6.77 |
| P4 | 8.0 | 7.5 | 7.0 | 6.5 | 6.0 | 5.6 | 5.3 | 33.75 | 6.56 |
| P5 | 8.5 | 8.2 | 7.9 | 7.6 | 7.3 | 6.9 | 6.6 | 22.35 | 7.57 |
| Means | 8.20 | 7.78 | 7.33 | 6.88 | 6.50 | 6.13 | 5.75 | 8.32 |
Table text extracted from the original PDF; superscript letters are shown inline. The original table image is below.
View original table image
| — | Storage Intervals | — | — | — | — | — | — | — | — |
|---|---|---|---|---|---|---|---|---|---|
| Treatment s | 0 | 15 | 30 | 45 | 60 | 75 | 90 | % Decrease | Mean s |
| Po | 8.0 | 7.2 | 6.6 | 6 | 5.5 | 5.0 | 4.5 | 43.75 | 6.11 |
| P1 | 8.5 | 8.2 | 7.9 | 7.5 | 7.2 | 6.8 | 6.4 | 24.71 | 7.50 |
| P2 | 7.5 | 7.0 | 6.5 | 6.0 | 5.8 | 5.5 | 5.2 | 30.67 | 6.21 |
| P3 | 8.4 | 7.9 | 7.5 | 7.3 | 6.9 | 6.5 | 6.0 | 28.57 | 7.21 |
| P4 | 8.2 | 7.5 | 7.0 | 6.4 | 5.7 | 5.5 | 5.3 | 35.37 | 6.51 |
| P5 | 8.0 | 7.6 | 7.4 | 6.8 | 6.6 | 6.4 | 6.2 | 22.50 | 7.00 |
| Means | 8.10 | 7.57 | 7.15 | 6.67 | 6.28 | 5.95 | 5.60 | 8.11 |
Table text extracted from the original PDF; superscript letters are shown inline. The original table image is below.
View original table image
| Treatments | Storage Intervals | — | — | — | — | — | — | % Decrease | Mean s |
|---|---|---|---|---|---|---|---|---|---|
| 0 | 15 | 30 | 45 | 60 | 75 | 90 | |||
| Po | 7.0 | 6.5 | 6.0 | 5.6 | 5.1 | 4.6 | 3.8 | 45.71 | 5.51 |
| P1 | 7.2 | 7.0 | 6.8 | 6.6 | 6.5 | 6.0 | 5.7 | 20.83 | 6.54 |
| P2 | 7.3 | 6.8 | 6.4 | 6.15 | 5.9 | 5.6 | 5.2 | 28.76 | 6.19 |
| P3 | 7.2 | 6.6 | 6.4 | 5.7 | 5.5 | 5.2 | 5.0 | 30.55 | 5.94 |
| P4 | 7.1 | 6.5 | 6.2 | 5.7 | 5.1 | 4.5 | 4.2 | 40.84 | 5.61 |
| P5 | 7.3 | 7.1 | 6.9 | 6.7 | 6.5 | 6.3 | 6.2 | 15.06 | 6.71 |
| Means | 7.18 | 6.75 | 6.45 | 6.08 | 5.77 | 5.37 | 5.02 | 7.30 |
Table text extracted from the original PDF; superscript letters are shown inline. The original table image is below.
View original table image
References
39 in the original paper- Agricultural Statistic of Pakistan. Govt. of Pakistan. Agriculture, Food security and research, Economic Wing, Islamabad, 2012, 96.
- AOAC. Official methods of analysis association of official and analytical chemists 13t Edi. Washington, D.C, 2012.
- Ali M. Canning of fruits and vegetables and their juices. Effect of canning quality of juices from different varieties of oranges. M.Sc. Agri. Thesis Agri. Univ. Faislabad, 1965.
- Brenndor Kennedy, Oswin CO, Trin DS, Mrema GC, Werek C. Bobby solar driers. Their role in post-harvest processing. Common wealth sci. Council, 1985, 78-83.
- Brian AF, Cameron AG. Food Sci. Nutri. and Health. 1995; (5):266-284.
- Calouro F, Jordao P, Duarte L. Characterization of the mineral composition of s pear of the Portuguese cultivar Rocha. Internet. J Horti. 2006; (800):10.
- Cecilia E, Maia GA. Storage stability of cashew apple juice preserved by hot fill and aseptic process. Dept. of Food Tech. Univ. of Ceara, Brazil CEP. 2002; 60:110111.
- Carneiro. Rheological behavior of functional sugar-free guava preserves and effect of the addition of salts. J Food Sci. and Tech. 2013; 31:404-412.
- Dock L, Floros JD, Linton RH. Heat inactivation of Escherichia coli in apple cider containing malic acid, sodium benzoate, and potassium sorbate. J Food Prot. 2000; 63:1026-1031.
- Fang CQ, Lin SH. Present situation and development counter-measure of pear production in China. J China Fruit Tree. 2003; (1):47-50.
- FOA/US. Food and Agri. Organization of UN. Eco. and Social Dept. The Statistical Division, 2008. foastat.fao.org/site/567.
- Gillani SN. Dev. of mango squash from four different cultivars of mango. M.Sc Thesis. Dept. of Food Sci. and Tech. NWFP. Agri. Univ. Pesh, 2002, 511-516.
- Gabas AL, Cabral RAF. Telis-Romero J, Telis VRN, Finzer JRD. Effect of apparent viscosity on fluidized bed drying process parameters of guava pulp. J Food Eng. 2007; 80:1096-1106.
- Gouws PA, Keyser M, Műller IA, Cilliers FP, Nel W. Ultraviolet radiation as a non-thermal treatment for the inactivation of microorganisms in fruit juice. Innovative Food Sci. and Eng. Tech. 2008; 9:348-354.
- Hudina M, Tampar F. Sugar and organic acids contents of European (Pyrus communis) and Asian (Pyrus serotina Rehd.) pear cultivars. J Acta Alimentaria Akademiaikiado. 2000; (29):217-230.
- Hassan LG, Usman BB, Kamba AS, Hassan SW. Protein and amino acid composition of hastala pasta squasch. J. Food Nigeria. 2009; (10):295-299.
- Hudina M, Stamper F. The correlation of the pear (Pyrus communis L.) yield, quality to the foliar nutrition and water regime. J Acta Agri. Slovenica. 2005, 85-200.
- Hashmi AA, Safiullah. Agri. and Food Security, Northern Areas Strategy for Sustainable Development. IUCN Pak. Programme, 2003, 92-93.
- Iqbal S, Yasmin A, Waduad S, Shah WH. Production, storage, packaging and quality evaluation of guava nectar. Pak. J of food Sci. 2001; 11(1):33-36.
- Imran A, Rafiullah K, Muhammad A. Effect of added sugar at various concentration on the storage stability of guava pulp. Department of Food Sci. and Tech. NWFP Agri. Uni, Pesh, Pak. Sarhad. J Agri. 2000; 16(1):8993.
- Kinh Shearer AE, Dunne CP, Hoover DG. Preparation and preservation of guava pulp with chemical preservatives, and mild heat. J of Food Prot. 2001; 28(6):111-114.
- Khan NR. Photochemical changes in packed orange juice during storage. M.Sc. Thesis. Dept. Food Sci. and Tech. NWFP Agri. Univ. Pesh, 1987.
- Lyne RE, Quamme HA. Study of different varieties of pear. J Advances in Fruit Breeding, 1975, 38-70.
- Mahammad MU, Kamba AS, Abubakar L, Bagna EA. Nutritional composition of pear fruits (Pyrus communis). African J Food Sci. and Tech. 2010; 1(3):76-81.
- Marcy JE, Graunlich TR, Crandall PG, Marshall MR. Factors affecting storage of orange concentrates. J Food. Sci. 1984; 49(6):551-555.
- Menezes CC, Borges SV, Ferrua FQ, Vilela CP, Carneiro JDS. Influence of packaging and potassium sorbate on the physical, physicochemical and microbiological alterations of guava preserves. J Food Sci. 2011; 5(12):156-168.
- Mishra B, Gautam S, Sharma A. Shelf life extension of sugarcane juice using preservatives and gamma radiation processing. J Food Sci. 2011; 76(8):573-578
- Park KJ, Bin A, Brod FPR. Drying of pear with and without osmotic dehydration. J food Eng. 2003; (56):97-103.
- Pereira PAP, Souza VRD, Teixeira TR, Queiroz F, Borges SV, Carneiro JD. Rheological behavior of functional sugar-free guava preserves: Effect of the addition of salts. Food Hydrocolloids. 2013; 31:404412.
- Rosario MJG. Formulation of ready to drink blends from fruits and vegetable juices. J of Philippines Univ. Los Banos, College, Laguna (Philippines), 1996, 99.
- Sandi D, Jose BP, Antonio CG, June FM, Marco TC, Patricia BL. Hunter color dimensions, sugar contents and volatile compounds in pasteurized yellow passion fruit juice during storage. 2004; 47(2):233-245.
- Salvador H, Maldonado G, Ana L, Montelongo M, Jacobo CM, Hernandez GH et al. Physicochemical, Nutritional, and Functional Characterization of Fruits Xoconostle (Opuntiamatudae) Pears from CentralMexico Region. J Food science. 2010; 75(6):485-492.
- Senser F, Sherz H, Munchen G. Tablas de composition de Alimentos, 1999, (2).
- Shakir I, Hussain I, Zeb A, Durrani Y. Sensory Evaluation and Microbial Analysis of Apple and Pear mixed fruit jam prepared from varieties grown in Azad Jammu Kashmir. Worid J. Dairy and Food Scie. 2009; 4(2):201-204.
- Spiller GA. Dietary Fiber in prevention and treatment of disease. CRC Handbook of Dietary Fiber in Human Nutrition, 2001, 363-431.
- Shew CW, Salomon D, Simon JL, Sreeualson T, Freese E. Inhibitory compounds on bacteria and mammalian ceff. Antimicrob Agents Chemoth. 1975; 7:349-350.
- USDA. National Nutrient Database for Standard Reference, Release (2009). http://www.bestveganguide.com/pear-nutrition.html
- Vadivel V, Janardhanam K. Plant foods for Human Nutrition. J Pears free diet. 2005; (60):69-75.
- Vanderslice JK, Higgs DJ, Hayes JM, Block G. Ascorbic acid and dehydroascorbic acid content of food. J. Food Composition Analysis. 1990; 3:105-118.