
Research article · 2026 · Full text
International Journal of Geography Geology and EnvironmentThe effect of climatic elements on the spatial and temporal variation of radon gas concentrations in Maytham Al-Tammar district, Al-Kufa city, Iraq
Volume 8(9) · Pages 130–137 · DOI: 10.22271/27067483.2026.v8.i9b.873 ↗
Research areasRadioactivity and Radon MeasurementsIndoor Air Quality and Microbial ExposureRadioactive contamination and transfer
Abstract
Author-writtenRadon gas (222Rn) is a naturally occurring radioactive noble gas that is predominantly generated as a decay product of the radioactive decay of radium-226 in the uranium-238 decay series. Radon can move through the soil and enter homes. The amount of radon in indoor air can vary a lot depending on the environment, weather and the building. The present study aimed to study the spatial and temporal variation of indoor radon concentrations and to investigate their relationship with indoor temperature in Maytham Al-Tammar District, Al-Kufa City, Najaf Governorate, Iraq. A random sample of fifty residential houses was selected as sampling locations to provide representative spatial coverage of the study area. Indoor radon and temperature were measured with an Airthings Wave Plus Radon and Indoor Air Quality Monitor (Model 2930). Measurements were grouped by the six months studied from January to June. The geographical locations of the selected houses were incorporated into a Geographic Information System (GIS) to facilitate spatial representation and interpretation of the measurements. Results indicate a significant temporal variation of the two variables under consideration. The mean indoor temperature increased progressively from 20.0 °C in January to 22.0 °C in February, 25.1 °C in March, 29.0 °C in April, 33.0 °C in May and 41.0 °C in June. Conversely, the mean radon concentration decreased from 90.0 Bq/m³ in January to 82.0 Bq/m³ in February, 70.5 Bq/m³ in March, 59.0 Bq/m³ in April, 45.0 Bq/m³ in May and 25.2 Bq/m³ in June. In addition, the single measurements showed a high spatial variability among the 50 houses, suggesting that the response of radon to changing climatic conditions may be modulated by house characteristics. Overall, the results show a clear inverse temporal relationship between indoor temperature and radon concentration over the study period. The rise in temperature was accompanied by a sharp decrease in radon levels, suggesting that temperature and the associated change in ventilation and air exchange may influence the observed seasonal behavior. However, the spatial differences between the houses studied suggest that temperature should not be considered as the sole controlling factor. Other local environmental factors such as building characteristics, ventilation conditions, soil properties and pressure differences may also affect indoor radon accumulation. Thus, the study emphasizes the need to consider climatic, environmental and building-related factors in the assessment of the spatial and temporal distribution of indoor radon in residential areas.
Summary
Source-checkedPlain-language reading of the full paper, prepared with AI and checked against the text. Each point links to the authors' own words.
Why it matters
- Radon gas is a naturally occurring radioactive noble gas produced from the decay of radium-226. View evidence ↗
- Monitoring radon is important for public health because long-term exposure to high levels is linked to an increased risk of lung cancer. View evidence ↗
- While soil and geology determine radon's presence, climatic elements strongly influence how it moves and its concentration in the atmosphere. View evidence ↗
The question
- The study aimed to analyze how indoor radon concentrations vary over time and space and how they relate to indoor temperature in the Maytham Al-Tammar District of Iraq. View evidence ↗
What they did
- Indoor temperature and radon levels were measured using an Airthings Wave Plus Radon and Indoor Air Quality Monitor (Model 2930). View evidence ↗
- Data collection was grouped by month over a six-month period from January to June. View evidence ↗
- A Geographic Information System (GIS) was used to map the house locations and interpret the spatial distribution of the measurements. View evidence ↗
What they found
- Mean indoor temperatures rose steadily from 20.0 °C in January to 41.0 °C in June. View evidence ↗
- Mean radon concentrations decreased consistently from 90.0 Bq/m³ in January to 25.2 Bq/m³ in June. View evidence ↗
- The study found a clear inverse relationship over time: as indoor temperatures increased, radon concentrations decreased. View evidence ↗
- High spatial variability among the 50 houses suggests that individual building characteristics influence how radon responds to climate. View evidence ↗
- Spatial differences were evident in January, with House 8 (109 Bq/m³) and House 41 (106 Bq/m³) showing higher concentrations than other homes. View evidence ↗
What it means
- The authors conclude that assessing indoor radon requires considering climatic, environmental, and building-related factors together. View evidence ↗
- The authors note that temperature is not the only factor; building characteristics, ventilation, soil properties, and pressure differences also affect radon accumulation. View evidence ↗
Visual summary
2 visualsIllustrations explain the paper; charts are replotted from the paper's own table values.
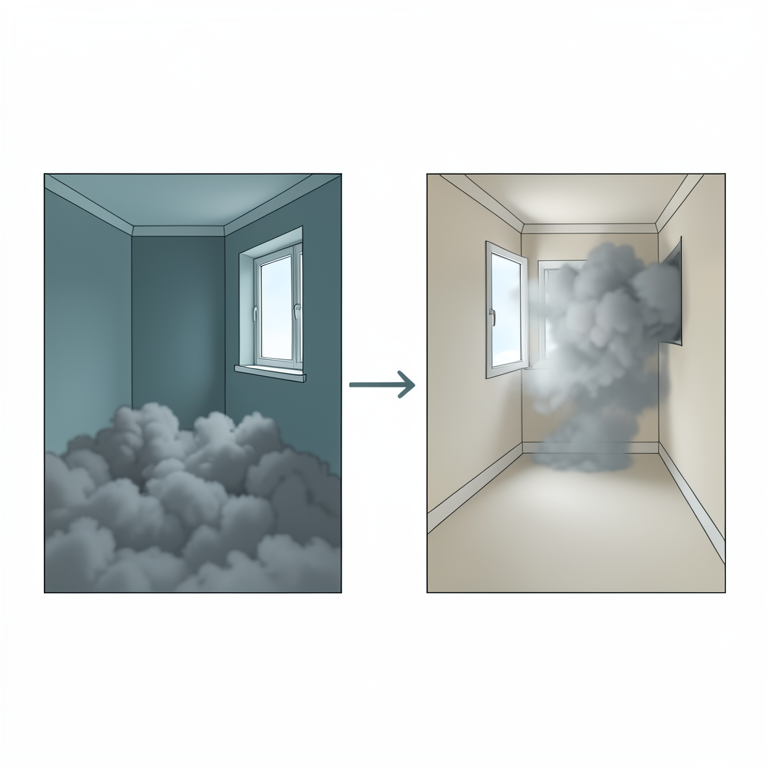
Inverse Relationship Concept
AI-generated conceptual illustration (Indoor residential rooms in Al-Kufa city, Iraq). It explains the idea and does not show study data.
View source evidence ↗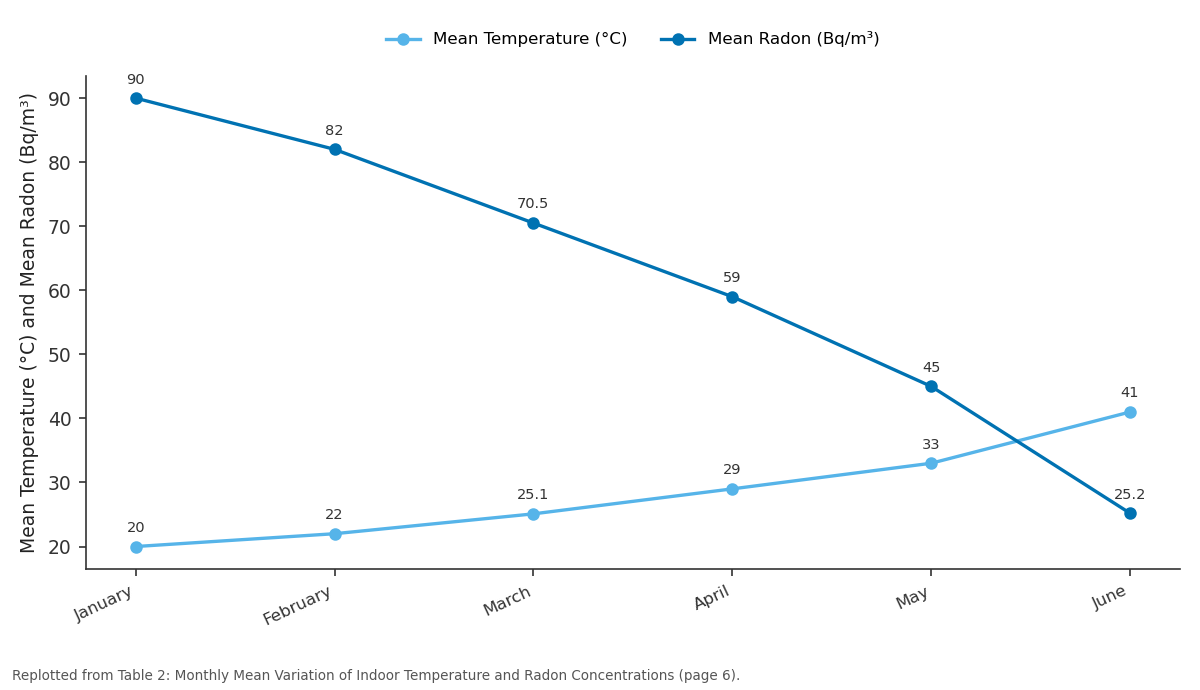
Mean Temperature (°C) and Mean Radon (Bq/m³): January vs February vs March vs April vs May
Replotted from Table 2 (page 6) of the original paper. Every bar is the paper's own table value.
View source evidence ↗Figures & tables
From the original paper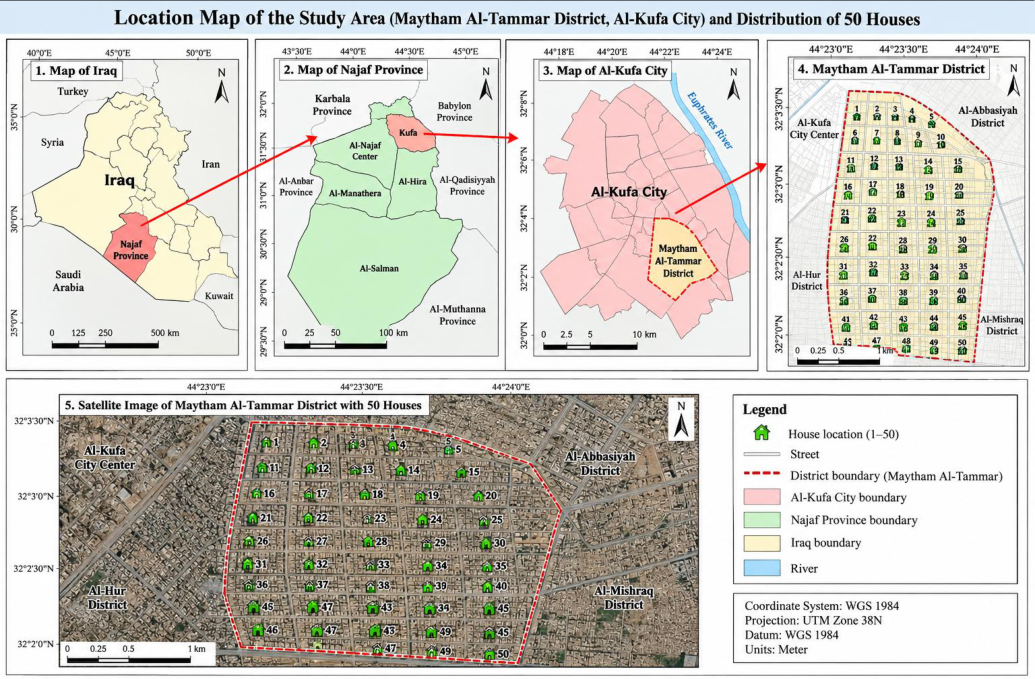 Figure 1
 Figure 2
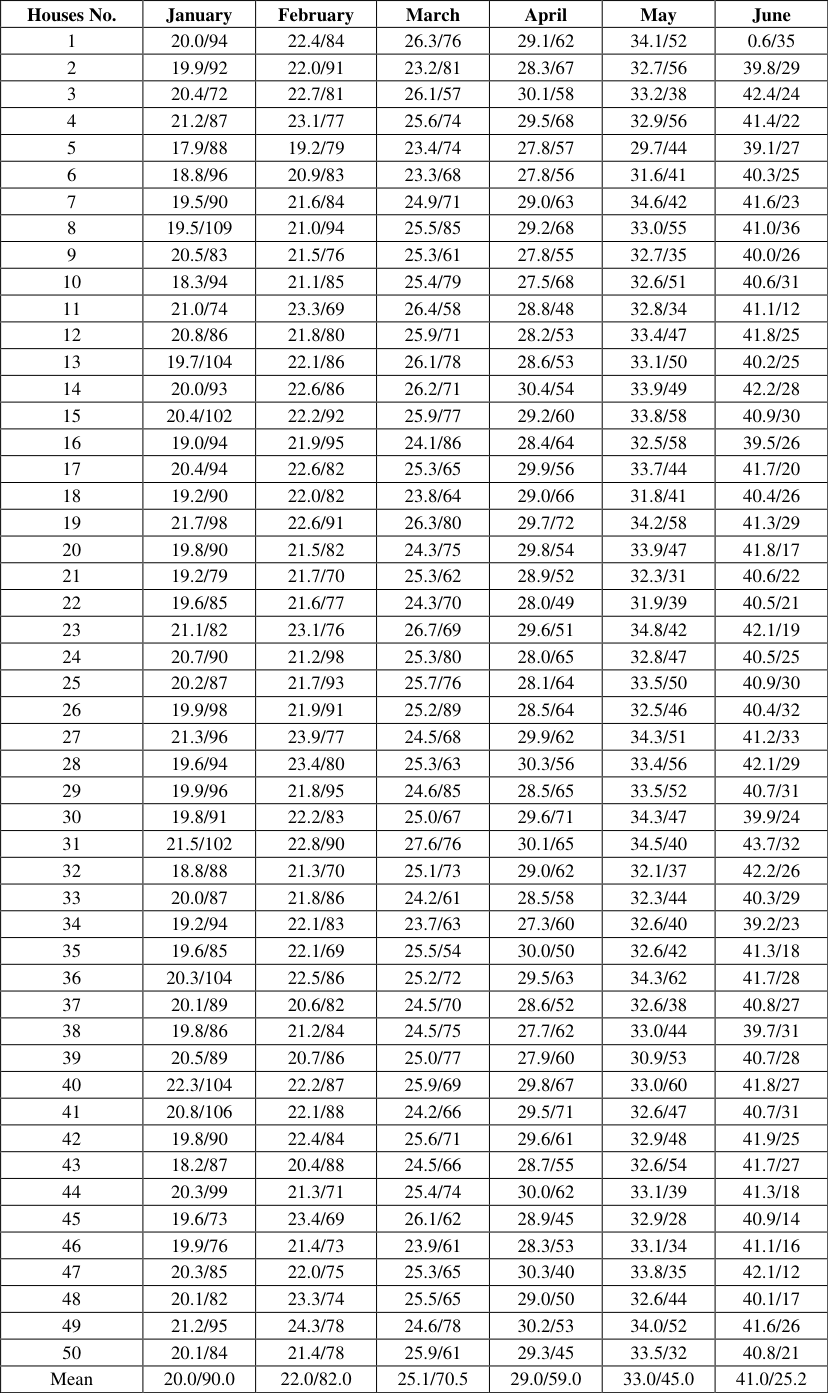 Table 1
 Table 2
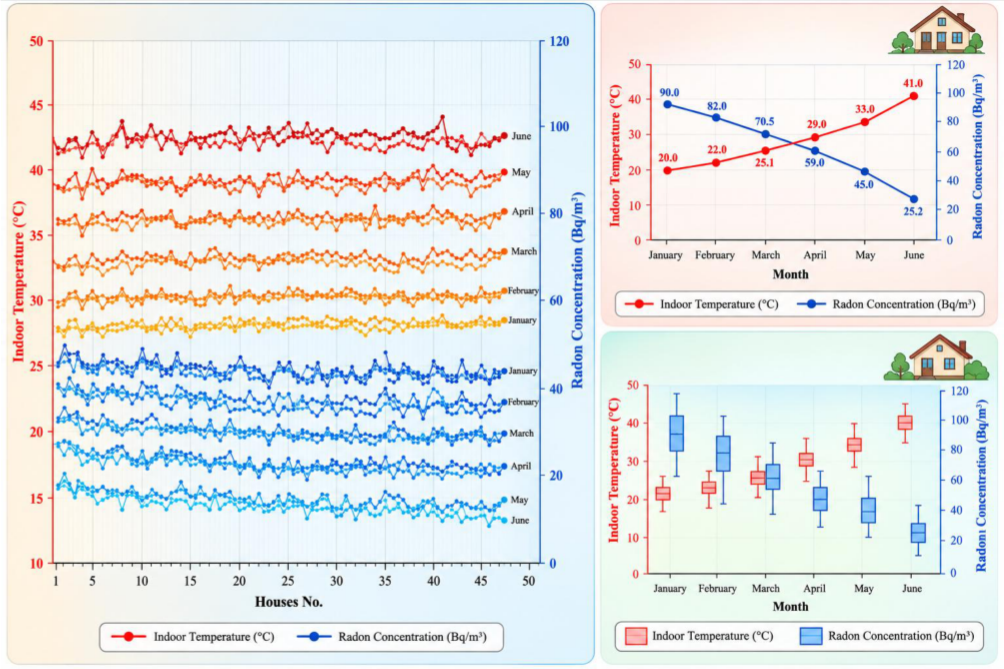 Figure 3
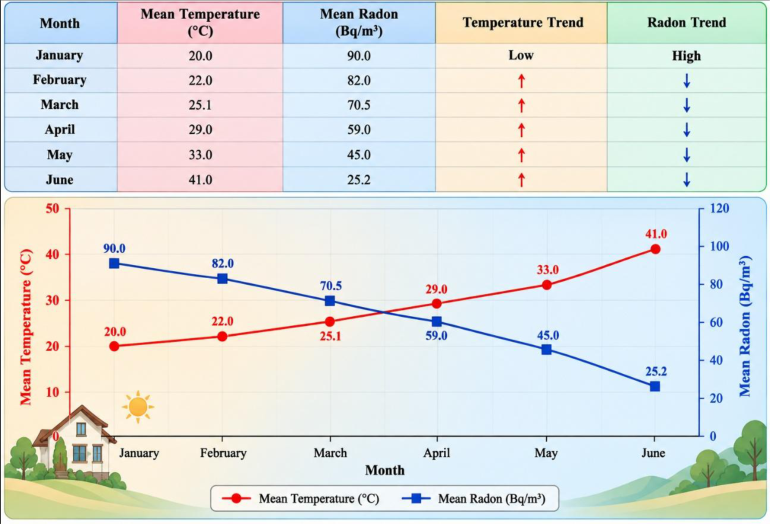 Figure 4
 Table 3
Introduction
Radon (222Rn) is a naturally occurring radioactive noble gas, resulting predominantly from the radioactive decay of radium-226 (226Ra) in the uranium-238 (238U) decay chain. It is able to travel through the pores of the soil and reach the near-surface atmosphere, where its concentration is governed by the interaction of geological, soil, atmospheric, and climatic conditions. Long-term exposure to high concentrations of radon is of considerable environmental and public health importance because it has been linked to an increased risk of lung cancer [1] . While the presence and release of radon are closely related to the radioactive and physical properties of soil and geological materials, the movement and atmospheric concentration of radon are strongly influenced by climatic elements. Temperature, atmospheric pressure, relative humidity, precipitation, wind speed and wind direction can affect radon exhalation from soil, atmospheric dispersion and near-surface accumulation [2] . Thus, radon concentrations can be highly variable in space and time even in relatively small geographical areas. The air temperature is an important factor in determining the radon behavior since changes in the temperature of soil and air can alter the movement of gas, the stability of the atmosphere and the vertical mixing. Variations in near-surface radon concentrations can arise from daily heating and cooling at nite [3] . The atmospheric pressure might also be one of the factors influencing the migration of soil gas and radon transport from the subsurface to the atmosphere, especially when pressure variations are developed over a short period of time [2,4] . Precipitation and soil moisture are other controls on radon transport. Soil moisture variations can change the permeability of soils as well as the movement of gasses through pore spaces. Rain can affect the physical and moisture conditions of the near-surface soil. The relation between moisture and radon is complicated and depends on the nature of the soil and the amount of water present [2] . Wind speed and atmospheric stability are also very important factors in the dispersion of radon. Weak winds and stable atmospheric conditions may cause accumulation near the surface, while stronger winds improve atmospheric mixing and dispersion [4,5] . Differences in the properties of the soil, land use, surface cover, building density and urban structure also affect the spatial distribution of radon. In cities, roads, buildings, paved surfaces and soil compaction can affect the natural exchange of natural gas between the soil and the atmosphere. Also, meteorological conditions can interact with these urban characteristics and lead to local variations in radon concentrations [6] . The temporal behavior of radon is therefore closely associated with the diurnal and seasonal variations of climatic conditions. Fluctuations in temperature, pressure, humidity, precipitation and wind patterns can lead to hourly, daily and seasonal variations in radon levels [3,5] . Moreover, the possible effect of climate change on environmental radioactivity has recently attracted increasing attention, particularly via changes in temperature, precipitation, soil moisture and atmospheric circulation [7] . In this context, Maytham Al-Tammar District in Al-Kufa City offers a good local location to study the correlation between climatic factors and radon fluctuations. The present study aims to analyze the spatial and temporal variation of radon concentrations and their relation with the main climatic elements, especially temperature, atmospheric pressure, relative humidity, precipitation and wind characteristics. A clearer climatological interpretation of the radon behavior and contributions to the environmental assessment and the future monitoring of natural radioactivity in the study area can be obtained from the understanding of these relationships.
Study Area
The district of Maytham al-Tammar is located in the city of al-Kufa in the province of Najaf in central Iraq. The study area is a part of Al-Kufa City as a broader geographical setting of the study area which is a part of the Najaf Governorate. The fact that it is situated on the Euphrates River system provides a very important environmental and climatic setting for the study of the spatial and temporal variation of radon gas concentrations. District is predominantly urban land-use, with residential buildings, streets, paved areas and areas with different surface and soil characteristics. The geographical location of the study area is presented progressively in Figure (1), starting from the location of Iraq in the regional setting, then Najaf Governorate, Al-Kufa City and finally Maytham Al-Tammar District. The detailed map of the district showing the distribution of the 50 selected residential houses, used for radon measurements. The sampling locations were distributed in different parts of the district to ensure a spatial representation of radon concentrations and to facilitate the analysis of their relation with local climatic conditions. The location and distribution of the sampling sites are especially important because radon concentrations may vary spatially with variations in soil properties, surface conditions, building characteristics, ventilation and local atmospheric circulation. The spatial distribution of the 50 houses is suitable for the investigation of the geographical variation of radon in the district and for the comparison of the measured concentrations with climatic elements such as air temperature, relative humidity, atmospheric pressure, wind speed, wind direction and precipitation. The study area map was prepared using a Geographic Information System (GIS) for spatial analysis, so as to ensure that the sampled houses were accurately represented and spatially distributed within Maytham Al-Tammar District. The GIS approach is an effective instrument for visualizing the geographical pattern of radon concentrations and for delineating zones of relatively high and low concentrations. Furthermore, it allows the combination of radon measurements with climatic and environmental variables, thus enabling a more comprehensive interpretation of the spatial and temporal behavior of radon in the study area.
Field Measurements and Experimental Procedure
The practical part of this study was conducted to investigate the spatial and temporal variation of indoor radon concentrations and their relationship with the temperature in Maytham Al-Tammar District, Al-Kufa City, Najaf Governorate, Iraq. Fifty (50) residential houses were selected as the sampling points and spatially distributed to have a representative coverage for the district. All the selected houses were geolocated and imported in a Geographic Information System (GIS). Each house was assigned a unique ID from 1 to 50.The Airthings Wave Plus Radon and Indoor Air Quality Monitor (Model 2930) was used to measure indoor radon concentrations and temperature. The device was installed inside each selected home under normal residential conditions and operated continuously throughout the monitoring period specified. The instrument was located indoors, away from direct sunlight, heating and cooling sources, windows, doors, and areas of high air movement to ensure consistency between sampling locations. All houses were kept as similar as possible concerning installation conditions. The measurements were grouped according to the months of the study period to investigate the temporal variation of temperature and radon concentrations. The instrument continuously logged indoor environmental conditions, in particular temperature, and at the same time radon concentrations were measured. Temperature measurements were expressed in degrees Celsius (°C) and radon concentrations in becquerels per cubic meter (Bq/m3). The observations from each house were grouped by month, to allow temporal comparisons of the measurements over the duration of the study. The recorded measurements were related to the geographical coordinates and the house identification number of each sampling location. The monthly data were assembled into a structured database containing the location of each house, month of monitoring, temperature observations, and radon measurements. This process created a homogenous data set to investigate spatial inequities across 50 houses and temporal differences month on month. In the practical work, the GIS part was used to show the geographical distribution of the 50 residential sampling sites in Maytham Al-Tammar district. The spatial database was built in a way that the radon and temperature observations can be later associated with their respective locations. With such an approach, it is possible to obtain a suitable framework for the production of maps of spatial distribution and for the study of the geographical pattern of radon concentration during the different months of monitoring. A monthly monitoring procedure was specifically established to characterize the thermal variability of the study area and to provide a temporal framework for the evaluation of radon behavior under different thermal conditions. The field measurements thus provided a combined spatial and temporal data set of 50 residential locations, which was subsequently used for the statistical analysis, graphical representation and interpretation of the relationship between temperature and radon concentration presented separately in the Results and Discussion section. .
Results and Discussion
The results from the 50 residential houses investigated showed a clear temporal variation in both the indoor temperature and the radon concentration during the study period. The values measured for each residential house are shown in Table 1 and they are distinguished by a strong spatial variability but also a common temporal pattern for the 6 months under study. In each cell of Table 1 the corresponding indoor temperature (°C) and radon concentration (Bq/m 3) are reported. This allows the simultaneous evaluation of the two variables for all the 50 houses. 2 gives the monthly averages, which better represent the seasonal behavior. The table shows a steady increase in mean temperature and a steady decrease in mean radon concentration from January to June. The lowest mean temperature was recorded in January with the highest mean radon concentration, while the highest mean temperature was recorded in June with the lowest mean radon concentration. This regular monthly pattern is consistent with the view that the residential setting studied exhibited an inverse seasonal relationship between temperature and indoor radon. This is shown in Table 2, where the average radon level fell from 90.0 Bq/m^3 in January to 25.2 Bq/m^3 in June. This is a large decrease of the radon concentration during the period of the sharp increase of the indoor temperature. The observed pattern is in general agreement with previous studies reporting seasonal variation of indoor radon concentrations with higher concentrations often during the colder seasons due to less ventilation and increased radon accumulation inside buildings [12][13][14] . Warmer conditions could change air exchange and ventilation, which could reduce radon. Warmer times can also allow for more natural ventilation by opening windows and doors, and a rise in temperature can change the relationship between indoor and outdoor pressures and air flows. This allows for faster radon ingress into a building and a reduction of its accumulation inside [1516] . But this explanation should be seen in relation to other environmental and structural factors, not just temperature. This is supported by the house-to-house differences in Table 1. The amount of radon reduction was different for each of the 50 houses, but the same seasonal pattern was observed in all houses. Such variability might be related to changes in building construction, ventilation characteristics, floor level, foundation properties, soil permeability, cracks or openings and the presence of pathways for radon to enter residential buildings [17][18] . Therefore, temperature should be considered one of the components of a larger system that controls indoor radon behavior. The monthly trend as shown in Table 2 is in line with observations made in other climatic environments such as desert and semi-arid regions where seasonal trends of indoor radon have been related to temperature, ventilation, soil conditions and building characteristics [19] . But other studies have also shown that the seasonal behavior of radon is not the same in all buildings and geographical settings. In some cases local geology, architecture and climate may alter or even reverse the expected seasonal pattern [20] . This underscores the significance of considering Maytham Al-Tammar's accomplishments within the specific climate and housing conditions. To summarize, Tables 1 and2 show that the houses studied were influenced by spatial heterogeneity and temporal variability of indoor radon concentration. Table 1 shows the differences between the 50 individual residences and Table 2 shows the overall monthly trend. Overall, the interpretation suggests that radon concentrations were generally higher in the cooler months and gradually lower in the warmer months, with the differences between individual houses indicating the additional effect of local residential characteristics. Tables 1 and2 summarize the results. There is a clear seasonal inverse relationship between indoor temperature and radon concentration in the study area. The mean radon concentration in January was 90.0 Bq/m 3 and decreased to 25.2 Bq/m 3 in June where the temperature increased from 20.0 ° to 41.0 °C. Therefore, the results obtained emphasize the importance of considering the climatic conditions with the building properties, ventilation and other environmental factors when studying the spatial and temporal distribution of indoor radon in Maytham Al-Tammar District.
| Month | Mean Temperature (°C) | Mean Radon (Bq/m³) | Temperature Trend | Radon Trend |
|---|---|---|---|---|
| January | 20.0 | 90.0 | Low | High |
| February | 22.0 | 82.0 | ↑ | ↓ |
| March | 25.1 | 70.5 | ↑ | ↓ |
| April | 29.0 | 59.0 | ↑ | ↓ |
| May | 33.0 | 45.0 | ↑ | ↓ |
| June | 41.0 | 25.2 | ↑ | ↓ |
Table text extracted from the original PDF; superscript letters are shown inline. The original table image is below.
View original table image
| Houses No. | January | February | March | April | May | June |
|---|---|---|---|---|---|---|
| 1 | 20.0/94 | 22.4/84 | 26.3/76 | 29.1/62 | 34.1/52 | 0.6/35 |
| 2 | 19.9/92 | 22.0/91 | 23.2/81 | 28.3/67 | 32.7/56 | 39.8/29 |
| 3 | 20.4/72 | 22.7/81 | 26.1/57 | 30.1/58 | 33.2/38 | 42.4/24 |
| 4 | 21.2/87 | 23.1/77 | 25.6/74 | 29.5/68 | 32.9/56 | 41.4/22 |
| 5 | 17.9/88 | 19.2/79 | 23.4/74 | 27.8/57 | 29.7/44 | 39.1/27 |
| 6 | 18.8/96 | 20.9/83 | 23.3/68 | 27.8/56 | 31.6/41 | 40.3/25 |
| 7 | 19.5/90 | 21.6/84 | 24.9/71 | 29.0/63 | 34.6/42 | 41.6/23 |
| 8 | 19.5/109 | 21.0/94 | 25.5/85 | 29.2/68 | 33.0/55 | 41.0/36 |
| 9 | 20.5/83 | 21.5/76 | 25.3/61 | 27.8/55 | 32.7/35 | 40.0/26 |
| 10 | 18.3/94 | 21.1/85 | 25.4/79 | 27.5/68 | 32.6/51 | 40.6/31 |
| 11 | 21.0/74 | 23.3/69 | 26.4/58 | 28.8/48 | 32.8/34 | 41.1/12 |
| 12 | 20.8/86 | 21.8/80 | 25.9/71 | 28.2/53 | 33.4/47 | 41.8/25 |
| 13 | 19.7/104 | 22.1/86 | 26.1/78 | 28.6/53 | 33.1/50 | 40.2/25 |
| 14 | 20.0/93 | 22.6/86 | 26.2/71 | 30.4/54 | 33.9/49 | 42.2/28 |
| 15 | 20.4/102 | 22.2/92 | 25.9/77 | 29.2/60 | 33.8/58 | 40.9/30 |
| 16 | 19.0/94 | 21.9/95 | 24.1/86 | 28.4/64 | 32.5/58 | 39.5/26 |
| 17 | 20.4/94 | 22.6/82 | 25.3/65 | 29.9/56 | 33.7/44 | 41.7/20 |
| 18 | 19.2/90 | 22.0/82 | 23.8/64 | 29.0/66 | 31.8/41 | 40.4/26 |
| 19 | 21.7/98 | 22.6/91 | 26.3/80 | 29.7/72 | 34.2/58 | 41.3/29 |
| 20 | 19.8/90 | 21.5/82 | 24.3/75 | 29.8/54 | 33.9/47 | 41.8/17 |
| 21 | 19.2/79 | 21.7/70 | 25.3/62 | 28.9/52 | 32.3/31 | 40.6/22 |
| 22 | 19.6/85 | 21.6/77 | 24.3/70 | 28.0/49 | 31.9/39 | 40.5/21 |
| 23 | 21.1/82 | 23.1/76 | 26.7/69 | 29.6/51 | 34.8/42 | 42.1/19 |
| 24 | 20.7/90 | 21.2/98 | 25.3/80 | 28.0/65 | 32.8/47 | 40.5/25 |
| 25 | 20.2/87 | 21.7/93 | 25.7/76 | 28.1/64 | 33.5/50 | 40.9/30 |
| 26 | 19.9/98 | 21.9/91 | 25.2/89 | 28.5/64 | 32.5/46 | 40.4/32 |
| 27 | 21.3/96 | 23.9/77 | 24.5/68 | 29.9/62 | 34.3/51 | 41.2/33 |
| 28 | 19.6/94 | 23.4/80 | 25.3/63 | 30.3/56 | 33.4/56 | 42.1/29 |
| 29 | 19.9/96 | 21.8/95 | 24.6/85 | 28.5/65 | 33.5/52 | 40.7/31 |
| 30 | 19.8/91 | 22.2/83 | 25.0/67 | 29.6/71 | 34.3/47 | 39.9/24 |
| 31 | 21.5/102 | 22.8/90 | 27.6/76 | 30.1/65 | 34.5/40 | 43.7/32 |
| 32 | 18.8/88 | 21.3/70 | 25.1/73 | 29.0/62 | 32.1/37 | 42.2/26 |
| 33 | 20.0/87 | 21.8/86 | 24.2/61 | 28.5/58 | 32.3/44 | 40.3/29 |
| 34 | 19.2/94 | 22.1/83 | 23.7/63 | 27.3/60 | 32.6/40 | 39.2/23 |
| 35 | 19.6/85 | 22.1/69 | 25.5/54 | 30.0/50 | 32.6/42 | 41.3/18 |
| 36 | 20.3/104 | 22.5/86 | 25.2/72 | 29.5/63 | 34.3/62 | 41.7/28 |
| 37 | 20.1/89 | 20.6/82 | 24.5/70 | 28.6/52 | 32.6/38 | 40.8/27 |
| 38 | 19.8/86 | 21.2/84 | 24.5/75 | 27.7/62 | 33.0/44 | 39.7/31 |
| 39 | 20.5/89 | 20.7/86 | 25.0/77 | 27.9/60 | 30.9/53 | 40.7/28 |
| 40 | 22.3/104 | 22.2/87 | 25.9/69 | 29.8/67 | 33.0/60 | 41.8/27 |
| 41 | 20.8/106 | 22.1/88 | 24.2/66 | 29.5/71 | 32.6/47 | 40.7/31 |
| 42 | 19.8/90 | 22.4/84 | 25.6/71 | 29.6/61 | 32.9/48 | 41.9/25 |
| 43 | 18.2/87 | 20.4/88 | 24.5/66 | 28.7/55 | 32.6/54 | 41.7/27 |
| 44 | 20.3/99 | 21.3/71 | 25.4/74 | 30.0/62 | 33.1/39 | 41.3/18 |
| 45 | 19.6/73 | 23.4/69 | 26.1/62 | 28.9/45 | 32.9/28 | 40.9/14 |
| 46 | 19.9/76 | 21.4/73 | 23.9/61 | 28.3/53 | 33.1/34 | 41.1/16 |
| 47 | 20.3/85 | 22.0/75 | 25.3/65 | 30.3/40 | 33.8/35 | 42.1/12 |
| 48 | 20.1/82 | 23.3/74 | 25.5/65 | 29.0/50 | 32.6/44 | 40.1/17 |
| 49 | 21.2/95 | 24.3/78 | 24.6/78 | 30.2/53 | 34.0/52 | 41.6/26 |
| 50 | 20.1/84 | 21.4/78 | 25.9/61 | 29.3/45 | 33.5/32 | 40.8/21 |
| Mean | 20.0/90.0 | 22.0/82.0 | 25.1/70.5 | 29.0/59.0 | 33.0/45.0 | 41.0/25.2 |
Table text extracted from the original PDF; superscript letters are shown inline. The original table image is below.
View original table image
Conclusion
The study has shown that there are clear spatial and temporal variations of the indoor radon concentrations in 50 residential houses in the Maytham Al-Tammar District.
During the course of the study a clear inverse relationship was observed between indoor temperature and radon concentration. The temperature gradually increased from the cold to the warm months and radon concentrations decreased. This pattern indicates that climatic conditions, especially temperature, may have a significant impact on indoor radon behavior. The differences observed between individual houses, however, suggest that temperature is not the only controlling factor and that factors such as ventilation, building characteristics, soil conditions, pressure differences and other local environmental factors may also contribute to variations in radon levels. In general, results highlight the relevance of a simultaneous consideration of climatic, environmental and building-related factors in the analysis of the spatial and temporal distribution of indoor radon concentrations in residential environments.
Figures and tables from the paper
| Month | Mean Temperature (°C) | Mean Radon (Bq/m³) | Temperature Change (°C) | Radon Change (Bq/m³) |
|---|---|---|---|---|
| January | 20.0 | 90.0 | 0.0 | 0.0 |
| February | 22.0 | 82.0 | +2.0 | −8.0 |
| March | 25.1 | 70.5 | +3.1 | −11.5 |
| April | 29.0 | 59.0 | +3.9 | −11.5 |
| May | 33.0 | 45.0 | +4.0 | −14.0 |
Table text extracted from the original PDF; superscript letters are shown inline. The original table image is below.
View original table image
References
20 in the original paper- World Health Organization. WHO handbook on indoor radon: a public health perspective. Geneva: World Health Organization; 2009. 1-110 p.
- United Nations Scientific Committee on the Effects of Atomic Radiation. Sources and effects of ionizing radiation, UNSCEAR 2008 report, volume I: sources. New York: United Nations; 2010. 1-219 p.
- Darby S, Hill D, Auvinen A, Barros-Dios JM, Baysson H, Bochicchio F, et al. Radon in homes and risk of lung cancer: collaborative analysis of individual data from 13 European case-control studies. BMJ. 2005;330(7485):223-227.
- Porstendörfer J, Butterweck G, Reineking A. Daily variation of the radon concentration indoors and outdoors and the influence of meteorological parameters. Health Phys. 1994;67(3):283-287.
- Rowe JE, Kelly M, Price LE. Weather system scale variation in radon-222 concentration of indoor air. Sci Total Environ. 2002;284(1-3):157-166.
- Gillmore GK, Phillips PS, Denman AR. The effects of geology and the impact of seasonal correction factors on indoor radon levels: a case study approach. J Environ Radioact. 2005;84(3):469-479.
- Gruber V, Maringer FJ, Landstetter C. Investigations on indoor radon in Austria, Part 1: seasonality of indoor radon concentration. J Environ Radioact. 2007;98(3):329-345.
- Majeed Kareem O, Radhi Jasim H, Azez Bjoo E, Saeed Jassim A. Evaluation of indoor air quality in the village of Al-Bu Mahmid, Iraq. E3S Web Conf. 2025;633:01009-01018.
- Singh M, Singh K, Singh S, Papp Z. Variation of indoor radon progeny concentration and its role in dose assessment. J Environ Radioact. 2008;99(3):539-545.
- Denman AR, Groves-Kirkby CJ, Crockett RG, Phillips PS, Gillmore GK. Identification of tidal and climatic influences within domestic radon time-series from Northamptonshire, UK. Sci Total Environ. 2006;367(1):191-202.
- Groves-Kirkby CJ, Crockett RG, Denman AR, Phillips PS. A critical analysis of climatic influences on indoor radon concentrations: implications for seasonal correction. J Environ Radioact. 2015;148:16-26.
- Dawoud Salman M. Spatial analysis of indoor air pollution in the housing of Al-Abbasiya district in Najaf governorate. E3S Web Conf. 2025;633:07015-07024.
- Al-Khateeb HM, Nuseirat M, Aljarrah K, Al-Akhras MA, Bani-Salameh H. Seasonal variation of indoor radon concentration in a desert climate. Appl Radiat Isot. 2017;130:49-53.
- Taşköprü C, İçhedef M, Saç MM. Diurnal, monthly, and seasonal variations of indoor radon concentrations concerning meteorological parameters. Environ Monit Assess. 2022;195(1):25-36.
- Belete GD, Shiferaw AM. A review of studies on the seasonal variation of indoor Radon-222 concentration. Oncol Rev. 2022;16(1):10570-10578.
- Hahn EJ, Haneberg W, Stanifer SR, Rademacher K. Geologic, seasonal, and atmospheric predictors of indoor home radon values. Environ Res Health. 2023;1(2):025011-025021.
- Spasić D, Gulan L. High indoor radon case study: influence of meteorological parameters and indication of radon prone area. Atmosphere. 2022;13(12):21202132.
- Al-Jamal LA, Abbas SH, Hadi QM, Obayes ES, Hayder RA. Evaluation of radon gas levels in the indoor environment of houses in Albu Mahmid village in Kufa city, Iraq. E3S Web Conf. 2025;633:01010-01019.
- Hassan SA, Abdul Hamid RM, Yousif SN, Jassim AS. Spatial analysis of air pollution concentration (radon, humidity, VOCS) in the homes of the Mitham AlTammar neighborhood in Kufa. E3S Web Conf. 2025;633:07014-07023.
- Author(s) omitted. Indoor radon and its relationship with indoor air temperature, relative humidity, and airchange rate. E3S Web Conf. 2022;356:05036-05044.