
Research article · 2026 · Full text
International Journal of Horticulture and Food ScienceBeyond taste: Food safety, hygiene, and labeling in Indore’s namkeen sector
Volume 8(8S) · Pages 30–33 · DOI: 10.33545/26631067.2026.v8.i8sa.842 ↗
Research areasFood Safety and HygieneFood and Agricultural SciencesConsumer Attitudes and Food Labeling
Abstract
Author-writtenThis study inves8gates the food safety and quality status of namkeen manufacturing in Indore, India, using the Geographically and Industry-Stratified Sampling Method (GISSM). A total of 25 samples from local, medium, and na8onal manufacturers were analyzed for physicochemical parameters (moisture, ash, acid insoluble ash, total polar compounds), hygienic and sanitary practices, and label artwork verification. Results were compared against FSSAI standards to assess compliance, consumer acceptability, and food safety risks. Findings reveal significant disparities across manufacturing scales, with local units showing weakest compliance, medium units mixed performance, and national units generally stronger control and labeling. The study underscores the urgent need for standardized monitoring, regulatory enforcement, and awareness programs to ensure safe, high-quality namkeen production.
Summary
Source-checkedPlain-language reading of the full paper, prepared with AI and checked against the text. Each point links to the authors' own words.
Why it matters
- Indore is known as the 'Snack capital of India' and has a diverse namkeen industry consisting of local, medium, and national manufacturers. View evidence ↗
- The namkeen industry in Indore struggles with maintaining regulatory compliance, hygiene, and food safety despite its economic importance. View evidence ↗
The question
- The study aims to systematically evaluate current industry practices to identify gaps and strengths affecting regulatory enforcement and consumer trust. View evidence ↗
What they did
- The researchers used the Geographically and Industry-Stratified Sampling Method (GISSM) to investigate food safety and quality in Indore. View evidence ↗
- The analysis focused on moisture content, ash, acid insoluble ash, total polar compounds (TPC), label artwork, and hygienic practices. View evidence ↗
What they found
- National manufacturers showed consistent moisture compliance (1.5-2.1%), whereas local units exhibited high variability ranging from 0.5% to 3.3%. View evidence ↗
- Local manufacturers occasionally had ash content exceeding 4%, which suggests potential contamination. View evidence ↗
- All analyzed samples complied with the permissible limit for acid insoluble ash, which is less than 0.1%. View evidence ↗
- Local units often exceeded the 25% safety threshold for Total Polar Compounds (TPC), and one medium unit reached 45%, while national units stayed within limits. View evidence ↗
- National manufacturers scored highest in hygienic and sanitary practices (80-96), compared to medium units (23-70) and local units (16-38). View evidence ↗
What it means
- The authors conclude that while national brands are more compliant, systemic improvements are needed across all production scales to protect consumers and ensure food safety. View evidence ↗
- The authors recommend stricter monitoring, training, and enforcement of Good Manufacturing Practices specifically for local and medium manufacturers. View evidence ↗
Visual summary
1 visualsIllustrations explain the paper; they do not show study data.
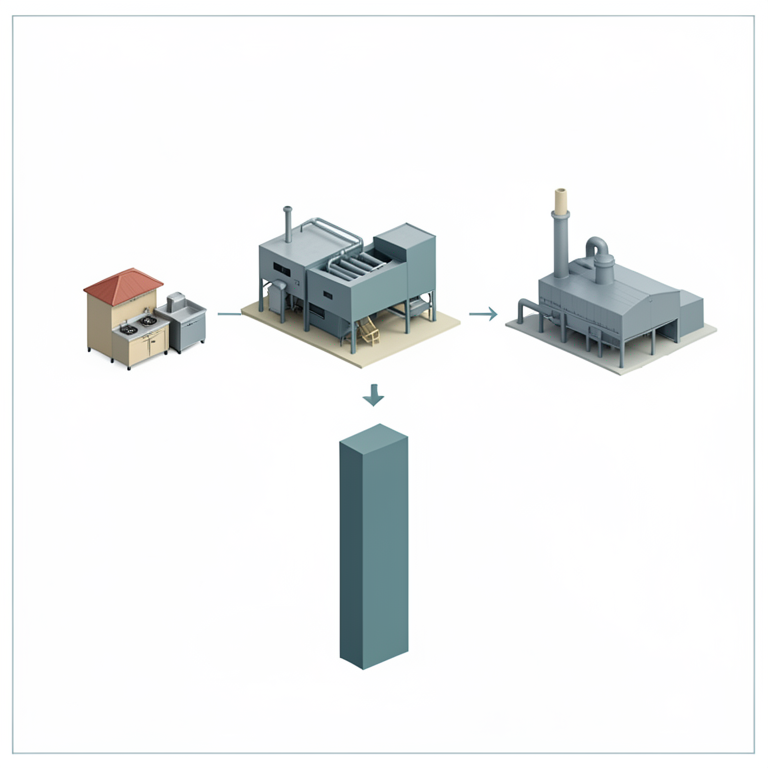
Hygiene Score Comparison
AI-generated conceptual illustration (Indian namkeen snack production facilities). It explains the idea and does not show study data.
View source evidence ↗Figures & tables
From the original paper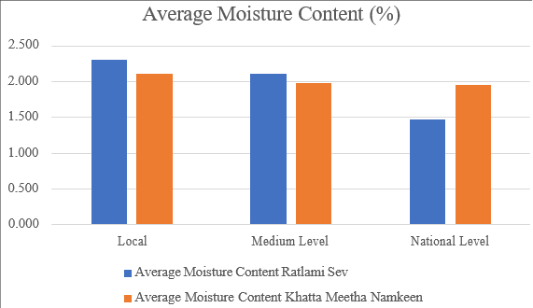 Figure 1
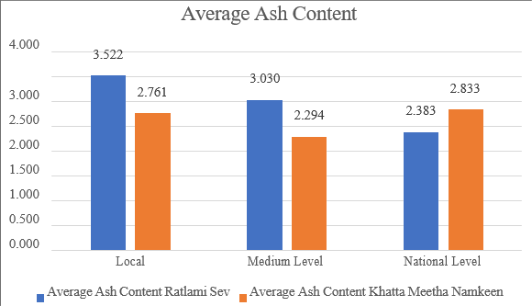 Figure 2
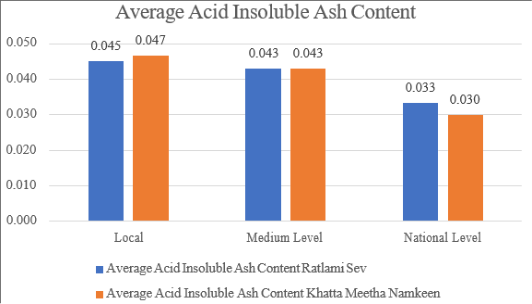 Figure 3
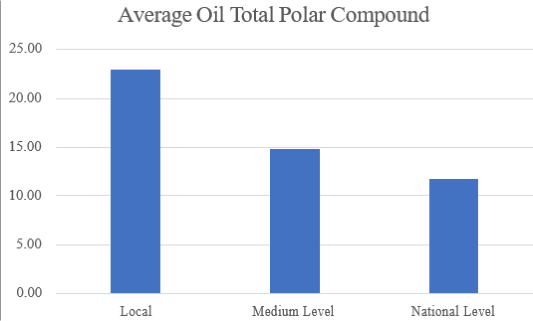 Figure 4
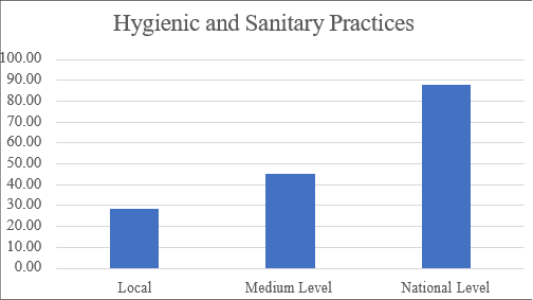 Figure 5
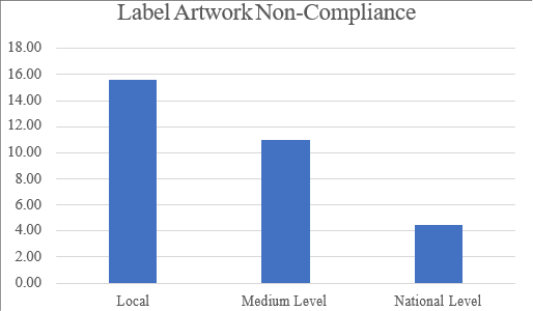 Figure 6
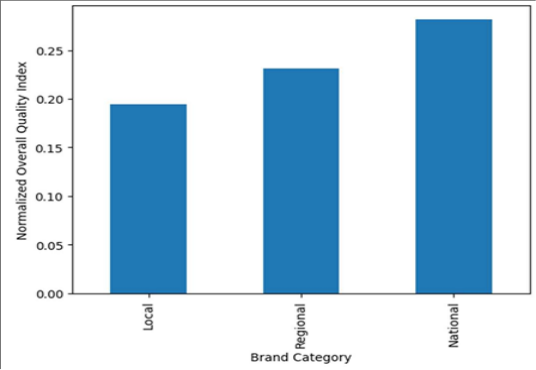 Figure 7
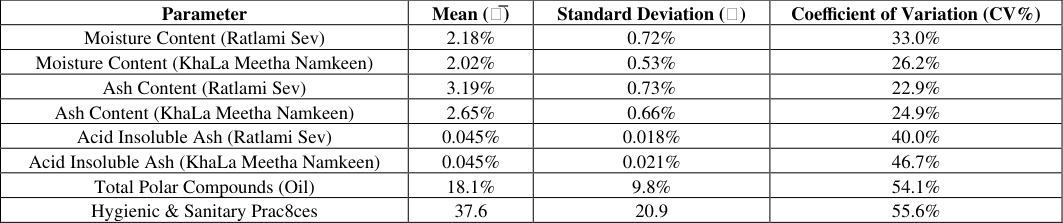 Table 1
Introduction
Indore, oOen referred to as the “Snack capital of India” is home to a thriving namkeen industry that ranges from small-scale local units to large national brands. Despite its cultural and economic significance, the industry faces challenges in maintaining food safety, hygiene, and regulatory compliance. This research aims to provide a systematic evaluation of the industry’s current practices, highlighting strengths and gaps that influence consumer trust and regulatory enforcement.
Methodology
Samples were collected across three categories Local manufacturers (12 Samples): Small-scale, unorganized units. Medium manufacturers (10 Samples): Semi-organized, regionally distributed units. National manufacturers (3 Samples): Large-scale, branded producers. Parameters analyzed included moisture content, ash, acid insoluble ash, total polar compounds (TPC), hygienic practices, and label artwork verification. Statistical tools (mean, standard deviation, coefficient of variation, ANOVA under GISSM) were applied to determine significant differences across categories.
Results And Discussion
Moisture Content: Local units showed high variability (0.5-3.3%), medium units moderate control, and national units consistent compliance (1.5-2.1%). Excess moisture (>3%) risks microbial growth and reduced shelf life. Ash content: Local units occasionally exceeded 4%, suggesting contamination. Medium units showed moderate control, while na8onal units maintained stable values within safe limits. https://www.hortijournal.com Acid insoluble ash: All samples remained within permissible limits (<0.1%), though local units showed slightly higher variability. Na8onal units demonstrated best control. Total Polar Compounds (TPC): Local units frequently exceeded the 25% safety threshold, medium units showed mixed compliance with one severe outlier (45%), while national units consistently remained below limits.
Unsafe TPC levels indicate harmful oil degrada8on and poor frying practices. Hygienic and sanitary practices: Local units scored lowest (16-38), medium units mixed (23-70), and na8onal units highest (80-96). Poor hygiene increases microbial contamina8on risks, while strong prac8ces enhance consumer trust. Label artwork verification: Compliance was inconsistent across all scales. Local units showed moderate adherence, medium units mixed performance, and national unit’s shows strong compliance, highlighting lapses in packaging oversight. Implications The findings reveal that food safety and compliance are uneven across scales of production.
Local and medium manufacturers require stricter monitoring, training, and enforcement of Good Manufacturing Practices, while na8onal manufacturers are maintaining compliances. For consumers, these differences translate into varying levels of product safety, trust, and acceptability. For regulators, GISSM provides a robust framework to capture variability and guide targeted interventions. Fig 1: Average moisture content across local, medium, and national manufacturers Fig 2: Comparative ash content Fig 3: Compara8ve Acid Insoluble Ash Content https://www.hortijournal.com Fig 4: Total Polar Compounds (TPC) compliance chart Fig 5: Hygienic and sanitary practices score comparison as per FSSAI schedule 4, part II Fig 6: Labelling compliance as per FSS (labelling and display) regulation 2020 Fig 7: Overall quality comparison among brand categories https://www.hortijournal.com Table 1: Statistical summary (Mean, SD, CV %) for all parameters 10.
| Parameter | Mean (𝑥̅) | Standard Deviation (𝑥) | Coefficient of Variation (CV%) |
|---|---|---|---|
| Moisture Content (Ratlami Sev) | 2.18% | 0.72% | 33.0% |
| Moisture Content (KhaLa Meetha Namkeen) | 2.02% | 0.53% | 26.2% |
| Ash Content (Ratlami Sev) | 3.19% | 0.73% | 22.9% |
| Ash Content (KhaLa Meetha Namkeen) | 2.65% | 0.66% | 24.9% |
| Acid Insoluble Ash (Ratlami Sev) | 0.045% | 0.018% | 40.0% |
| Acid Insoluble Ash (KhaLa Meetha Namkeen) | 0.045% | 0.021% | 46.7% |
| Total Polar Compounds (Oil) | 18.1% | 9.8% | 54.1% |
| Hygienic & Sanitary Prac8ces | 37.6 | 20.9 | 55.6% |
Table text extracted from the original PDF; superscript letters are shown inline. The original table image is below.
View original table image
Post-certification quality analysis of traditional Indian fried snacks. Appl Sci. 2025;15(13):7404. DOI:10.3390/app15137404. Parameter Mean (𝑥̅) Standard Deviation (𝑥) Coefficient of Variation (CV%) Moisture Content (Ratlami Sev) 2.18% 0.72% 33.0% Moisture Content (KhaLa Meetha Namkeen) 2.02% 0.53% 26.2% Ash Content (Ratlami Sev) 3.19% 0.73% 22.9% Ash Content (KhaLa Meetha Namkeen) 2.65% 0.66% 24.9% Acid Insoluble Ash (Ratlami Sev) 0.045% 0.018% 40.0% Acid Insoluble Ash (KhaLa Meetha Namkeen) 0.045% 0.021% 46.7% Total Polar Compounds (Oil) 18.1% 9.8% 54.1% Hygienic & Sanitary Prac8ces 37.6 20.9 55.6%
Conclusion
This study establishes that while na8onal manufacturers generally demonstrate stronger compliance, systemic improvements are required across all scales to ensure robust food safety, regulatory adherence, and consumer protec8on. The GISSM methodology effectively highlights structural disparities in the namkeen industry of Indore, offering a scien8fic basis for policy recommenda8ons, industry training, and consumer awareness initiatives.
Methods
, FSSAI regulatory framework, and field application in Indian food service operations. Food Sci J. 2026;11(2).
References
9 in the original paper- Food Safety and Standards Authority of India. Food Safety and Standards (Food Products Standards and Food Additives) Regulations, 2011. New Delhi: Food Safety and Standards Authority of India; 2011.
- Food Safety and Standards Authority of India. Food Safety and Standards (Licensing and Registration of Food Businesses) Regulations, 2011: Schedule 4- General hygienic and sanitary practices. New Delhi: Food Safety and Standards Authority of India; 2011.
- Food Safety and Standards Authority of India. Food Safety and Standards (Labelling and Display) Regulations, 2020. New Delhi: Food Safety and Standards Authority of India; 2020.
- Food Safety and Standards Authority of India. Food Safety and Standards (Prohibition and Restrictions on Sales) Regulations, 2011. New Delhi: Food Safety and Standards Authority of India; 2011.
- Food Safety and Standards Authority of India. Repurpose Used Cooking Oil (RUCO): Total Polar Compounds in used cooking oil. New Delhi: Food Safety and Standards Authority of India; 2026.
- Pahlani M, Talati KN, Lopez-Arana S, Narayanan P. Food labelling in India: a scoping review of consumer engagement, comprehension, and purchase behaviour. Glob Health Epidemiol. 2025;18(1):2574132. DOI:10.1080/16549716.2025.2574132.
- Johnson C, Thout SR, Mohan S, Dunford E, Farrand C, Wu JH, et al. Labelling completeness and sodium content of packaged foods in India. Public Health Nutr. 2017;20(16):2839-2846. DOI:10.1017/S1368980017001987.
- Kaur A, Scarborough P, Matthews A, Cradock S, Sacks G, Green J, et al. How many foods in India are correctly labelled according to national and international nutrition labelling guidelines? Public Health Nutr. 2017;20(16):2839-2846.
- Trivedi CHN, Jeyaraman K. Total polar compounds in frying oils: formation chemistry, measurement