
Research article · 2026 · Full text
International Journal of Agriculture and NutritionNutritional evaluation of locally available feed resources and their impact on growth performance of indigenous chicken breeds under smallholder farming systems
Volume 8(5) · Pages 153–158 · DOI: 10.33545/26646064.2026.v8.i5b.720 ↗
Research areasLivestock and Poultry ManagementAnimal Nutrition and PhysiologyMeat and Animal Product Quality
Abstract
Author-writtenHow effectively can smallholder poultry keepers harness their surrounding crop residues and grain by-products to match or even rival the performance of costly commercial rations? This research set out to answer that question by comparing three dietary treatments in indigenous Kenyan chicken breeds raised on smallholder farms in Kiambu County, Kenya, from September 2023 through January 2024. A total of 180 birds were randomly allocated to three groups of 60 each: Treatment 1 received a locally formulated maize-sorghum-based diet, Treatment 2 received a millet-cassava-based diet, and Treatment 3 (control) received a standard commercial broiler-grower feed. Growth parameters weekly body weight, total weight gain, feed intake, and feed conversion ratio (FCR) were recorded over a 12-week trial. Proximate analysis of the experimental feeds confirmed crude protein levels of 17.8%, 15.3%, and 20.1% for Treatments 1, 2, and 3, respectively, while metabolizable energy ranged from 11.4 to 12.7 MJ/kg. Birds on the commercial ration achieved the highest overall weight gain (653.7 g), followed by the maize-sorghum group (610.3 g) and the millet-cassava group (567.6 g). FCR values were 3.21, 3.58, and 2.94 for the three treatments, with significant differences between groups (P<0.05). However, an economic analysis revealed that feed cost per kilogram of weight gain was lowest for Treatment 1 (KES 187.40) compared with KES 209.60 for Treatment 2 and KES 246.80 for the commercial feed. A cost-benefit appraisal showed that the maize-sorghum diet delivered the best return on investment under smallholder conditions. These findings point to viable, low-cost feeding strategies that narrow the performance gap with commercial rations while keeping production economically accessible for resource-limited farmers.
Summary
Source-checkedPlain-language reading of the full paper, prepared with AI and checked against the text. Each point links to the authors' own words.
Why it matters
- Indigenous chickens are a primary protein source for rural households in East Africa, but their growth is limited by the unpredictable nutrition provided by scavenging. View evidence ↗
- Feed costs are a major economic burden for smallholder poultry farmers, accounting for 60-70% of total variable costs in some regions. View evidence ↗
- Many potentially useful feed ingredients like maize, sorghum, millet, and cassava are available on smallholder farms but are often wasted or used for other livestock. View evidence ↗
The question
- The study aimed to evaluate the nutritional composition, growth impact, and economic viability of two local feed mixes (maize-sorghum and millet-cassava) compared to a commercial ration. View evidence ↗
What they did
- The trial took place at three smallholder farms in Kiambu County, Kenya, from September 2023 to January 2024. View evidence ↗
- The study used 180 indigenous Kienyeji-type chickens, starting at 8 weeks of age with an average weight of 310 ± 28 g. View evidence ↗
What they found
- The commercial diet resulted in the highest final body weight (963.7 g), followed by the maize-sorghum (920.3 g) and millet-cassava (877.6 g) groups. View evidence ↗
- The commercial feed had the most efficient feed conversion ratio (2.94), compared to 3.21 for maize-sorghum and 3.58 for millet-cassava. View evidence ↗
- The maize-sorghum diet achieved 93.4% of the weight gain of the commercial diet but cost only 63% as much per bird. View evidence ↗
- The maize-sorghum diet provided a higher net return per bird than the commercial feed, exceeding it by KES 31.42 (12.4%). View evidence ↗
- The millet-cassava group performed the worst, likely due to its lower protein density of 15.3%. View evidence ↗
What it means
- The authors conclude that the maize-sorghum diet is the best alternative to commercial feed, offering a commercially viable balance of growth and cost. View evidence ↗
- Economically, the maize-sorghum diet is recommended as it provides the highest net return per bird (KES 285.25) and the best benefit-cost ratio (4.44). View evidence ↗
- The authors suggest future research should extend trials across both rainy and dry seasons to see if environmental stress affects the performance gap. View evidence ↗
Visual summary
3 visualsIllustrations explain the paper; charts are replotted from the paper's own table values.
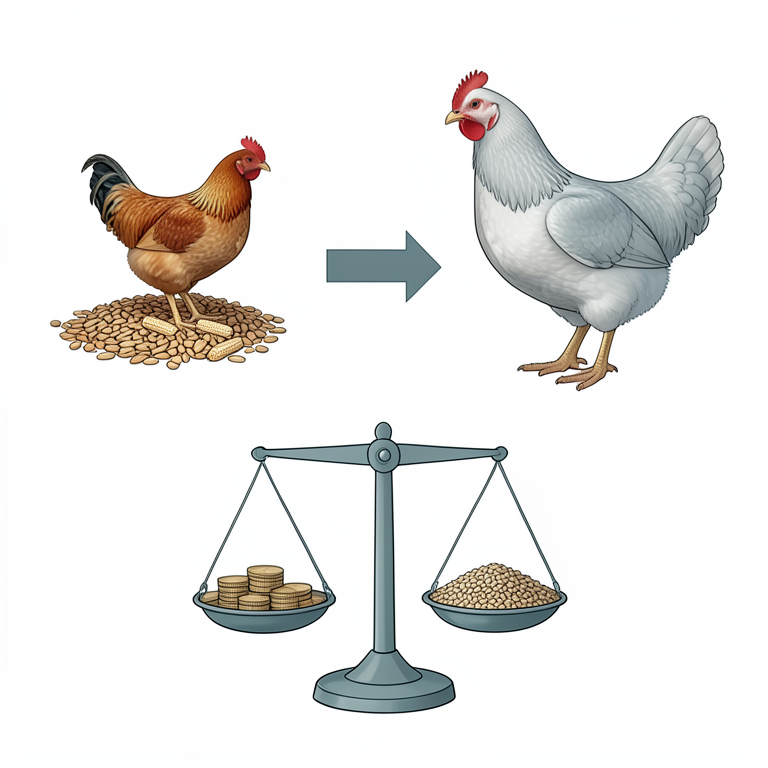
Biological vs Economic Trade-off
AI-generated conceptual illustration (indigenous chickens and local grain feed). It explains the idea and does not show study data.
View source evidence ↗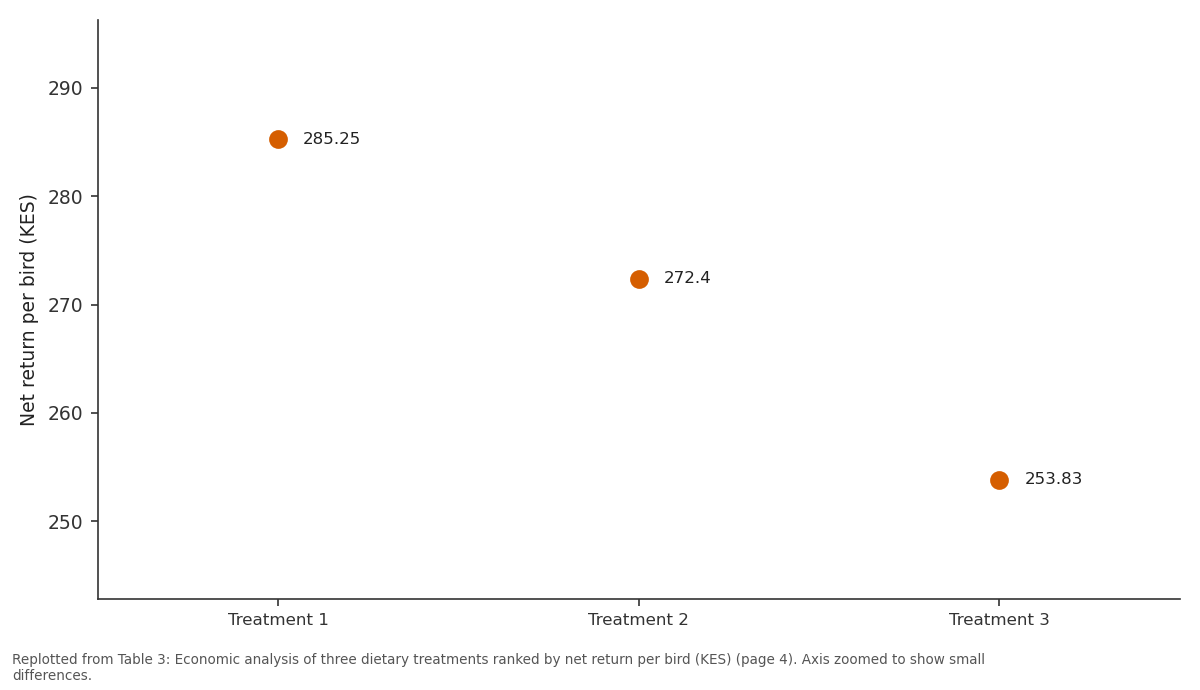
Net return per bird (KES): Treatment 1 vs Treatment 2 vs Treatment 3
Replotted from Table 3 (page 4) of the original paper. Every bar is the paper's own table value.
View source evidence ↗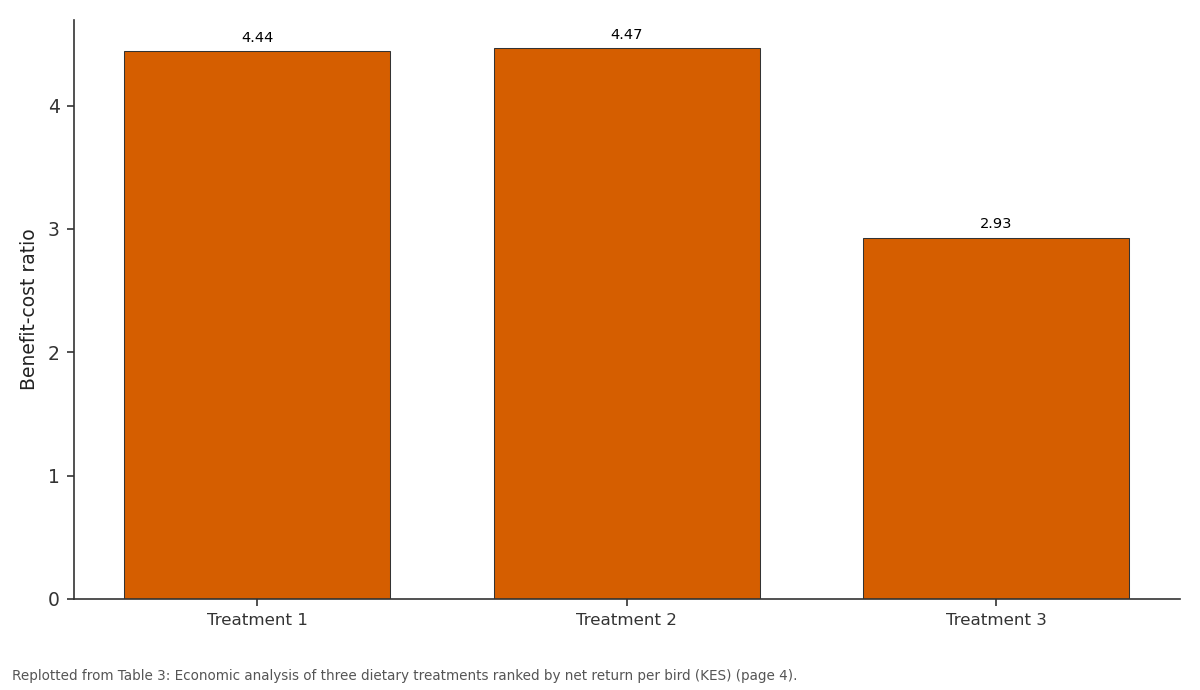
Benefit-cost ratio: Treatment 1 vs Treatment 2 vs Treatment 3
Replotted from Table 3 (page 4) of the original paper. Every bar is the paper's own table value.
View source evidence ↗Figures & tables
From the original paper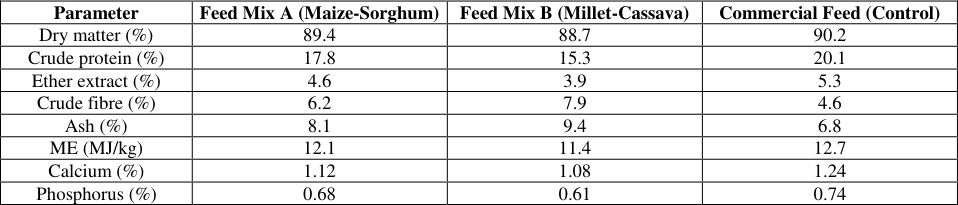 Table 1
 Table 2
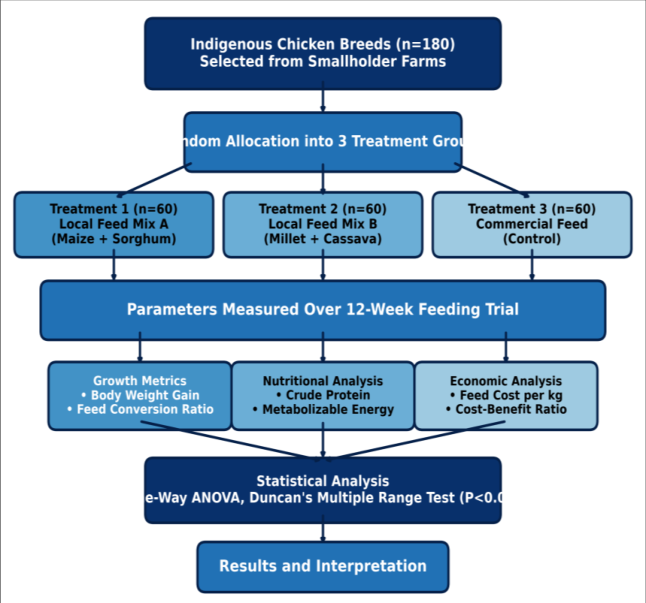 Figure 1
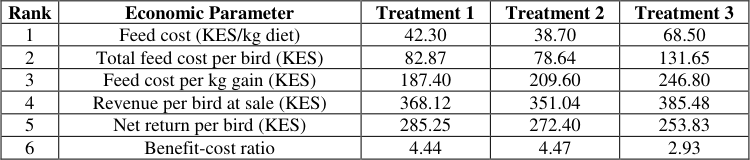 Table 3
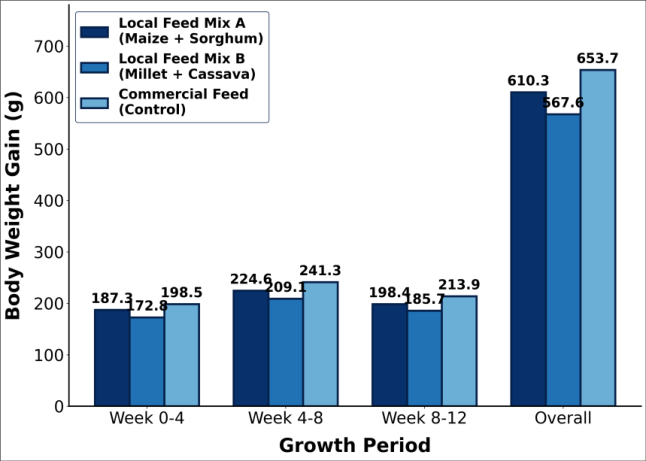 Figure 2
Introduction
Can smallholder farmers in sub-Saharan Africa close the productivity gap between indigenous and commercial chicken breeds simply by reformulating diets from the raw materials already at their doorstep? Across East Africa, indigenous chickens remain the backbone of rural household protein supply, yet their growth rates lag far behind those of exotic breeds, largely because scavenging provides an unpredictable and nutritionally incomplete diet [1] . Kenya alone hosts an estimated 32 million indigenous chickens, the majority kept under free-range or semi-intensive conditions by smallholder families who depend on them for eggs, meat, and modest cash income [2] . But the birds rarely reach their genetic ceiling for weight gain, and the gap between potential and actual performance is widest where feed costs dominate production budgets [3] . Several feed ingredients that could narrow this gap are already grown on or near smallholder farms. Maize, sorghum, millet, cassava, and a range of legume by-products are harvested seasonally, yet much of the material that could serve as poultry feed is discarded, composted, or fed to ruminants [4] . Prior research in Ethiopia and Tanzania has shown that systematic blending of local grains with protein-rich supplements sunflower cake, fish meal, or soybean residue can raise crude protein intake above 16% and bring FCR values within 15% of commercial diets [5,6] . However, the nutritional profiles of these ingredients vary with variety, soil type, and post-harvest handling, so feed formulations that work well in one agro-ecological zone may perform differently elsewhere [7] . A further complication is that indigenous breeds themselves are genetically diverse. Within Kenya, the Kenya Kari Improved Kienyeji, the normal Kienyeji, and various ecotype populations differ in feed efficiency, mature body weight, and disease resistance [8] . Growth trials that lump all indigenous types together risk obscuring breed-specific responses to dietary manipulation. At the same time, most feeding experiments conducted in the region have used onstation designs with tightly controlled environments that do not reflect the labour, storage, and feed-mixing constraints of actual smallholder practice [9,10] . Economic viability is the deciding factor for adoption. A diet may produce acceptable weight gains, but if the cost per kilogram of gain exceeds the local market price for live birds, farmers will not adopt it [11] . Earlier assessments in southern Nyanza documented that feed accounts for 60-70% of total variable costs in semi-intensive indigenous chicken production, meaning even small reductions in feed expenditure can shift a marginal enterprise into profitability [12] . What has been missing from the literature is an integrated evaluation that simultaneously measures biological performance, nutritional composition, and economic return of locally formulated diets under real smallholder management conditions. This research was designed to fill that space. Its objectives were threefold: first, to characterise the proximate nutritional composition of two locally formulated feed mixes based on maize-sorghum and millet-cassava; second, to compare the growth performance of indigenous chickens fed these local diets against a commercial control ration; and third, to carry out a cost-benefit analysis to determine whether locally formulated feeds offer an economically rational alternative for smallholder poultry keepers in the central Kenya highlands.
Material and Methods
Material and Methods
Research area
The research was carried out at three smallholder farms in Kiambu County, central Kenya (1.0314° S, 36.8681° E), between September 2023 and January 2024. Kiambu lies at an elevation of 1,600-1,800 m above sea level, with a subhumid climate characterised by bimodal rainfall (long rains March-May, short rains October-December) and mean annual temperatures of 18-21 °C. The county is part of the upper-midland agro-ecological zone (UM2), where maize, beans, sorghum, and sweet potatoes are the dominant crops. Soils are predominantly humic nitisols with moderate fertility. Smallholder farms in the area typically range from 0.5 to 2.0 hectares, and mixed crop-livestock systems are the norm, with indigenous chickens kept by over 78% of households according to 2022 county agriculture office records. The three participating farms were selected based on willingness to cooperate, existing flock size of at least 80 birds, and proximity to each other (within a 12 km radius) to minimise environmental variation across replicates.
Material
A total of 180 indigenous Kienyeji-type chickens aged 8 weeks (initial body weight 310 ± 28 g) were sourced from a local hatchery. Birds were wing-tagged, vaccinated against Newcastle disease and infectious bursal disease, and allowed a 7-day acclimatisation period before the trial began. Two locally formulated experimental diets were prepared: Feed Mix A comprised maize grain (45%), sorghum grain (20%), sunflower cake (15%), fish meal (8%), maize bran (7%), bone meal (3%), and a vitaminmineral premix (2%); Feed Mix B comprised pearl millet (40%), dried cassava chips (22%), groundnut cake (16%), silver cyprinid (omena) meal (10%), rice bran (7%), limestone (3%), and premix (2%). A standard commercial broiler-grower ration (20% CP, 12.7 MJ ME/kg) served as the control diet (Treatment 3). Feed ingredients were purchased from local agro-dealers in Kiambu town and milled at a local hammer mill to pass a 3 mm screen.
Methods
Proximate analysis of the two experimental feeds and the commercial ration was performed at the Animal Nutrition Laboratory of the research institute following AOAC (2019) procedures. Dry matter was determined by oven-drying at 105 °C for 24 hours; crude protein by the Kjeldahl method (N × 6.25); ether extract by Soxhlet extraction; crude fibre by the acid-detergent method; and ash by muffle-furnace incineration at 550 °C for 4 hours. Metabolizable energy was estimated using the prediction equation of Wiseman (2013). Birds were weighed individually every 7 days using a digital hanging scale (±1 g). Daily feed offered and refusals were recorded per replicate pen. Feed intake was calculated as the difference between offered and refused feed. FCR was computed as total feed consumed divided by total weight gain per pen. Mortality was recorded daily with cause noted where identifiable. All data were subjected to one-way analysis of variance (ANOVA) using R statistical software version 4.3.2. Treatment means were separated using Duncan's multiple range test at P<0.05. Results are presented as means ± standard error.
Field experimental design
The 180 birds were randomly allocated to three dietary treatments in a completely randomised design (CRD) with three replicates per treatment, giving nine experimental units of 20 birds each. Each replicate was housed in a separate deep-litter pen (3 m × 2.5 m) constructed from locally sourced timber and wire mesh, providing a stocking density of 2.7 birds/m². Pens were roofed with corrugated iron sheets and fitted with tube feeders and bell drinkers. Birds had access to an outdoor run of approximately 15 m² per pen during daylight hours, simulating the semi-intensive management typical of progressive smallholders in the region. Feed was offered ad libitum twice daily (07:00 and 16:00 h) and clean water was available at all times. A uniform lighting programme of natural daylight (approximately 12 h) was maintained throughout the 12week feeding period (October 2023 -January 2024).
Results
Across the 12-week trial, all three treatment groups maintained good health with an overall mortality rate of 4.4% (8 birds), distributed evenly among treatments and attributed to predation (n = 3) and coccidiosis (n = 5). No diet-related mortality was recorded. Feed intake, body weight gain, and FCR differed significantly (P<0.05) among the three groups, while the economic indicators showed contrasting patterns that favoured the locally formulated maize-sorghum diet. Proximate analysis confirmed that the three diets differed markedly in nutritional composition. The commercial feed had the highest crude protein content (20.1%), followed by the maize-sorghum mix (17.8%) and the millet-cassava mix (15.3%). Metabolizable energy was broadly similar across diets, ranging from 11.4 MJ/kg for the millet-cassava mix to 12.7 MJ/kg for the commercial ration. Crude fibre was highest in the millet-cassava diet (7.9%) and lowest in the commercial feed (4.6%). The bar chart (Figure 2) illustrates the body weight gains across the three growth sub-periods and the cumulative total. During weeks 0-4, the differences between the maizesorghum group and the commercial control were not significant (P = 0.187), but from week 4 onward the commercial diet produced consistently higher gains. The millet-cassava group lagged behind both other treatments in every sub-period, with the widest margin during weeks 4-8, when protein demand for feather development is typically at its peak. Taken as a whole, the biological data favour the commercial diet, but the economic metrics reverse that ranking. Treatment 1 (maize-sorghum) achieved 93.4% of the commercial diet's total weight gain while costing only 63.0% as much per bird. Its net return per bird exceeded the commercial group by KES 31.42 (12.4%), and its benefitcost ratio was 51.5% higher. The millet-cassava diet was cheapest in raw feed cost but its poorer FCR eroded much of that price advantage, resulting in a higher feed cost per kilogram of gain than the maize-sorghum mix.
Discussion
The maize-sorghum diet produced body weight gains that were statistically lower than the commercial ration yet remarkably close in absolute terms a gap of only 43.4 g over 84 days. Comparable margins have been reported in onstation trials in Ethiopia, where locally formulated diets bridged 88-92% of commercial feed performance [5,13] . The relatively strong showing of the maize-sorghum mix can be attributed to its crude protein level of 17.8%, which sits within the 16-18% range considered adequate for growing indigenous birds past the starter phase [1,14] . Sunflower cake and fish meal, the two main protein concentrates in the formulation, are rich in lysine and methionine amino acids that often limit muscle accretion in cereal-dominated diets [6] .
By contrast, the millet-cassava group lagged behind, and the most likely explanation is the lower protein density of that diet (15.3%). Cassava root is energy-dense but nearly devoid of protein, so the formulation depended heavily on groundnut cake and silver cyprinid meal to supply amino acids. Groundnut cake, while a useful protein source, contains moderate levels of anti-nutritional tannins that can reduce protein digestibility by 8-12% [7,15] . And the higher crude fibre content (7.9%) would have further diluted the nutrient density of the diet, increasing gut fill and reducing voluntary intake of metabolizable energy.
The economic analysis reinforces a point that field-level feeding trials sometimes overlook: biological optimality and economic optimality do not always coincide. Although the commercial feed outperformed both local mixes in growth rate and FCR, its price per kilogram was 1.6 to 1.8 times higher, which compressed net margins. Earlier work in southern Kenya reached a similar conclusion that commercial feeds could be counterproductive for smallholders selling birds at local market prices that are set by live weight and visual condition rather than by dressed carcass yield [12,16] . The maize-sorghum diet offered the best compromise: respectable biological performance at a cost low enough to widen profit margins under typical village market conditions. One limitation worth noting is that the trial was conducted during the short-rain season, when ambient temperatures were mild and some natural scavenging supplemented pen feeding. Performance differences might widen during the hotter, drier months when scavenging resources decline and heat stress depresses appetite. A longer, multi-seasonal trial would strengthen the generalisability of these findings.
Nutrient Budget
A simplified nutrient budget was constructed to compare crude protein and metabolizable energy inputs against the theoretical requirements for 610 g of body weight gain in indigenous chickens. Based on an assumed protein retention efficiency of 32% and an energy maintenance cost of 460 kJ ME/kg BW⁰•⁷⁵/day [14] , the maize-sorghum diet supplied 349 g CP and 23,700 kJ ME per bird over the 12-week trial representing surpluses of 14% for protein and 9% for energy above calculated requirements.
Acknowledgement
AcknowledgementsThe authors acknowledge and express gratitude to the concerned authorities for their support and cooperation during this research.
Figures and tables from the paper
| Parameter | Feed Mix A (Maize-Sorghum) | Feed Mix B (Millet-Cassava) | Commercial Feed (Control) |
|---|---|---|---|
| Dry matter (%) | 89.4 | 88.7 | 90.2 |
| Crude protein (%) | 17.8 | 15.3 | 20.1 |
| Ether extract (%) | 4.6 | 3.9 | 5.3 |
| Crude fibre (%) | 6.2 | 7.9 | 4.6 |
| Ash (%) | 8.1 | 9.4 | 6.8 |
| ME (MJ/kg) | 12.1 | 11.4 | 12.7 |
| Calcium (%) | 1.12 | 1.08 | 1.24 |
| Phosphorus (%) | 0.68 | 0.61 | 0.74 |
Table text extracted from the original PDF; superscript letters are shown inline. The original table image is below.
View original table image
| Parameter | Treatment 1 (Mean ± SE) | Treatment 2 (Mean ± SE) | Treatment 3 (Mean ± SE) | P-value |
|---|---|---|---|---|
| Initial body weight (g) | 312.4 ± 6.8 | 309.2 ± 7.1 | 310.0 ± 6.4 | 0.931 |
| Final body weight (g) | 920.3 ± 21.6b | 877.6 ± 24.3c | 963.7 ± 18.4a | 0.008 |
| Total weight gain (g) | 610.3 ± 16.2b | 567.6 ± 19.7c | 653.7 ± 14.8a | 0.003 |
| Daily weight gain (g/d) | 7.26 ± 0.19b | 6.76 ± 0.23c | 7.78 ± 0.18a | 0.004 |
| Total feed intake (g) | 1959.1 ± 34.7b | 2032.0 ± 41.3a | 1921.9 ± 29.6b | 0.041 |
| FCR | 3.21 ± 0.11b | 3.58 ± 0.14a | 2.94 ± 0.08c | 0.001 |
| Mortality (%) | 5.0 | 5.0 | 3.3 | 0.812 |
Table text extracted from the original PDF; superscript letters are shown inline. The original table image is below.
View original table image
| Rank | Economic Parameter | Treatment 1 | Treatment 2 | Treatment 3 |
|---|---|---|---|---|
| 1 | Feed cost (KES/kg diet) | 42.30 | 38.70 | 68.50 |
| 2 | Total feed cost per bird (KES) | 82.87 | 78.64 | 131.65 |
| 3 | Feed cost per kg gain (KES) | 187.40 | 209.60 | 246.80 |
| 4 | Revenue per bird at sale (KES) | 368.12 | 351.04 | 385.48 |
| 5 | Net return per bird (KES) | 285.25 | 272.40 | 253.83 |
| 6 | Benefit-cost ratio | 4.44 | 4.47 | 2.93 |
Table text extracted from the original PDF; superscript letters are shown inline. The original table image is below.
View original table image
References
16 in the original paper- Kingori AM, Wachira AM, Tuitoek JK. Indigenous chicken production in Kenya: A review. Int J Poult Sci. 2010;9(4):309-316.
- Magothe TM, Okeno TO, Muhuyi WB, Kahi AK. Indigenous chicken production in Kenya: I. Current status. World Poult Sci J. 2012;68(1):119-132.
- Mwacharo JM, Bjørnstad G, Mobegi V,"; et al. Mitochondrial DNA reveals multiple introductions of domestic chicken in East Africa. Mol Phylogenet Evol. 2011;58(2):374-382.
- Padhi MK. Importance of indigenous breeds of chicken for rural economy and their improvements for higher production performance. Scientifica. 2016;2016:2604685.
- Kefale D, Mitiku T. Assessment on backyard chicken feeding practices and health management in Fogera district Amhara region, Ethiopia. Acta Entomol Zool. 2023;4(1):48-54.
- Mutayoba SK, Dierenfeld E, Mercedes VA, Frances Y, Knight CD. Determination of chemical composition and anti-nutritive components for Tanzanian locally available poultry feed ingredients. Int J Poult Sci. 2011;10(5):350-357.
- Raphulu T, Jansen van Rensburg C, van Ryssen JBJ. Assessing nutrient adequacy from the crop contents of free-ranging indigenous chickens in rural villages of the Venda region of South Africa. S Afr J Anim Sci. 2015;45(2):143-152.
- Dana N, Dessie T, van der Waaij LH, van Arendonk JAM. Morphological features of indigenous chicken populations of Ethiopia. Anim Genet Resour. 2010;46:11-23.
- Wondmeneh E, van der Waaij EH, Udo HMJ, Tadelle D, van Arendonk JAM. Village chicken production system: Perception of farmers and simulation of impacts of interventions. Afr J Agric Res. 2014;9(41):3054-3062.
- Alabi OJ, Ng'ambi JW, Norris D, Mabelebele M. Growth and haematological response of indigenous Venda chickens aged 8 to 13 weeks to varying dietary lysine to energy ratios. J Anim Physiol Anim Nutr. 2015;99(3):436-441.
- Mtileni BJ, Muchadeyi FC, Maiwashe A, Groeneveld E, Groeneveld LF, Lenstra JA, et al. Diversity and origin of South African chickens. Poult Sci. 2011;90(10):2189-2194.
- Olwande PO, Ogara WO, Okuthe SO, Muchemi G, Okoth E, Odindo MO. Assessing the productivity of indigenous chickens in an extensive management system in southern Nyanza, Kenya. Trop Anim Health Prod. 2010;42(2):283-288.
- Aklilu HA, Almekinders CJM, Udo HMJ, van der Zijpp AJ. Village poultry consumption and marketing in relation to gender, religious festivals and market access. Trop Anim Health Prod. 2013;45(3):769-776.
- Okeno TO, Kahi AK, Peters KJ. Characterization of indigenous chicken production systems in Kenya. Trop Anim Health Prod. 2012;44(3):601-608.
- Mengesha M, Tamir B, Dessie T. Village chicken constraints and traditional management practices in Jamma district, South Wollo, Ethiopia. Livest Res Rural Dev. 2011;23(2):Article 37.
- Kugonza DR, Kyarisiima CC, Iisa A. Local chicken production in the South-Western agro-ecological zone of Uganda: I. Flock characteristics and management. Livest Res Rural Dev. 2017;29(8):Article 156.