
Research article · 2026 · Full text
International Journal of Agriculture and NutritionAmino Acid Profiling of GI-Tagged Kamalapura Fresh Red Banana (Musa acuminata) from Kalaburagi District, Karnataka, India
Volume 8(6) · Pages 63–65 · DOI: 10.33545/26646064.2026.v8.i6a.655 ↗
Research areasFood and Agricultural SciencesBanana Cultivation and ResearchFood composition and properties
Abstract
Author-writtenKamalapura Red Banana, a Geographical Indication (GI)-tagged indigenous variety of Musa acuminata, is widely cultivated in the Kalaburagi district of Karnataka, India. The present study aimed to evaluate the amino acid profile of fresh Kamalapura Red Dacca banana using standardised analytical techniques. Amino acid profiling was performed at Biochem Research and Testing Laboratory (BRTL) following acid hydrolysis and high-performance liquid chromatography (HPLC) procedures as per AOAC International guidelines. Quantification was carried out using a Biochrom 30 amino acid analyser with post-column ninhydrin derivatisation. Seventeen amino acids, including essential and non-essential amino acids, were identified and quantified. Results were expressed as mean ± standard deviation of duplicate determinations. Glutamic acid (15.92 ± 0.06 mg/100 g) and aspartic acid (10.01 ± 0.32 mg/100 g) were the predominant amino acids. Among essential amino acids, leucine (7.05 ± 0.10 mg/100 g), valine (5.13 ± 0.08 mg/100 g), and histidine (5.25 ± 0.06 mg/100 g) were present in higher concentrations. Sulphur-containing amino acids, methionine and cystine, were comparatively lower. Low standard deviation values indicated high analytical precision and reproducibility. The findings demonstrate that Kamalapura Red Banana possesses a balanced amino acid composition, supporting its nutritional value and potential application in functional and health-oriented food formulations.
Summary
Source-checkedPlain-language reading of the full paper, prepared with AI and checked against the text. Each point links to the authors' own words.
Why it matters
- The Kamalapura Red Banana is an indigenous variety of Musa acuminata grown in the Kalaburagi district of Karnataka, India, and holds Geographical Indication (GI) status. View evidence ↗
- Known locally as the Red Dacca banana, this cultivar is distinguished by its reddish peel, aroma, sweetness, and nutritional properties. View evidence ↗
- Analyzing the amino acid composition of foods is essential because it determines the biological value and quality of the proteins. View evidence ↗
The question
- The study aimed to determine the amino acid profile of fresh Kamalapura Red Dacca bananas using standardized analytical methods. View evidence ↗
What they did
- Fresh Red Dacca banana samples were collected from a farmer's field in Kamalapura, Karnataka, in November 2025. View evidence ↗
- Samples (100 mg) underwent acid hydrolysis using 5 mL of 6N HCl at 110°C for 21 hours, with nitrogen flushing to prevent oxidative degradation. View evidence ↗
- Amino acids were quantified using a Biochrom 30 analyzer with a PEEK resin column and post-column ninhydrin derivatization. View evidence ↗
- The analysis was performed in duplicate (R1 and R2), and results were reported as mean ± standard deviation. View evidence ↗
What they found
- Glutamic acid (15.92 ± 0.06 mg/100 g) and aspartic acid (10.01 ± 0.32 mg/100 g) were the most abundant amino acids in the sample. View evidence ↗
- Among the essential amino acids, leucine (7.05 ± 0.10 mg/100 g), histidine (5.25 ± 0.06 mg/100 g), and valine (5.13 ± 0.08 mg/100 g) were the most concentrated. View evidence ↗
- Methionine (0.35 ± 0.04 mg/100 g) and cystine (0.34 ± 0.02 mg/100 g) were found in the lowest concentrations. View evidence ↗
- The banana contained a moderate amount of lysine (2.70 ± 0.11 mg/100 g), which is significant as lysine is often limited in cereal diets. View evidence ↗
- Appreciable amounts of non-essential amino acids were found, including glycine (4.29 ± 0.06 mg/100 g), serine (3.94 ± 0.06 mg/100 g), alanine (3.85 ± 0.05 mg/100 g), and proline (3.20 ± 0.02 mg/100 g). View evidence ↗
What it means
- The authors conclude that the banana's amino acid profile is nutritionally promising, making it a potential ingredient for functional foods and protein supplements. View evidence ↗
- The low levels of sulphur-containing amino acids may limit the protein's biological value if the banana is used as the only protein source. View evidence ↗
Visual summary
3 visualsIllustrations explain the paper; charts are replotted from the paper's own table values.
Amino Acid Distribution Hierarchy
AI-generated conceptual illustration (Kamalapura Fresh Red Banana (Musa acuminata)). It explains the idea and does not show study data.
View source evidence ↗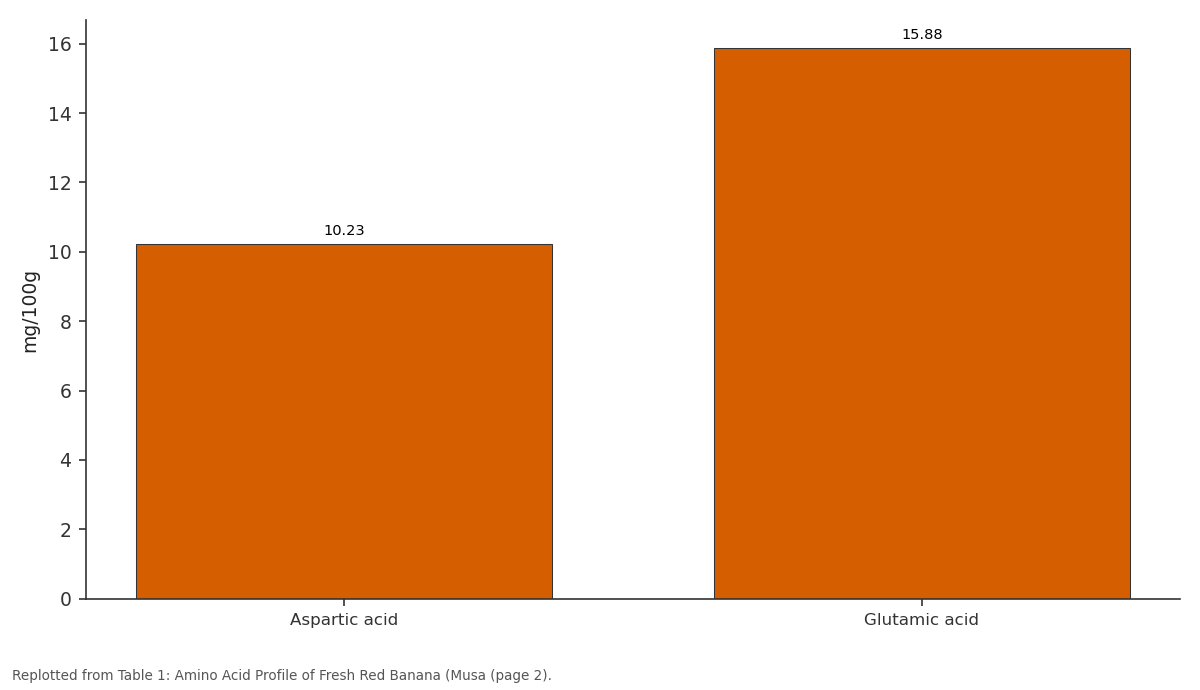
R1: Aspartic acid vs Glutamic acid
Replotted from Table 1 (page 2) of the original paper. Every bar is the paper's own table value.
View source evidence ↗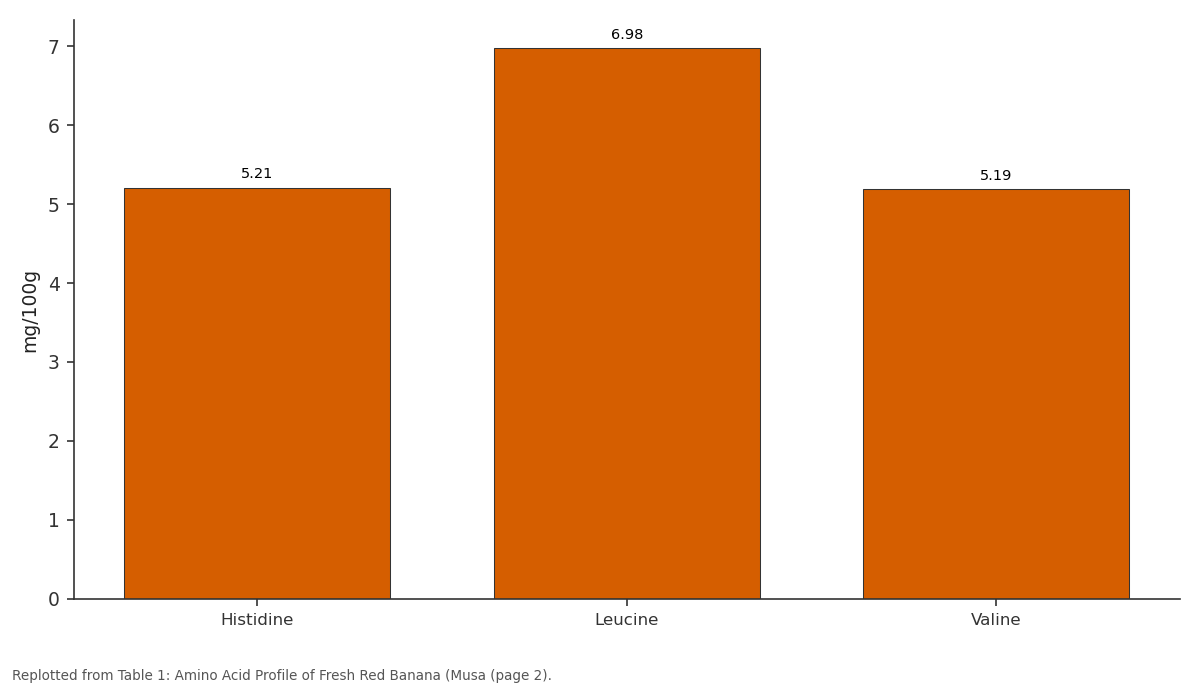
R1: Histidine vs Leucine vs Valine
Replotted from Table 1 (page 2) of the original paper. Every bar is the paper's own table value.
View source evidence ↗Figures & tables
From the original paper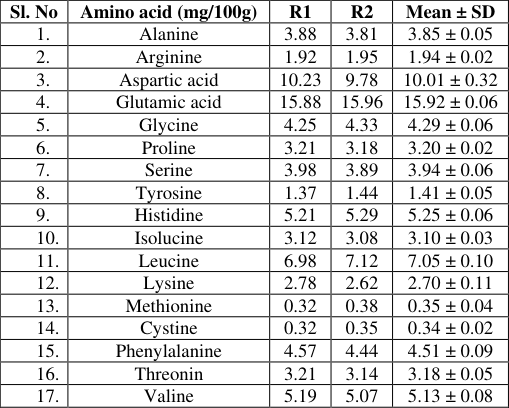 Table 1
Introduction
Kamalapura Red Banana is a traditionally cultivated indigenous variety of Musa acuminata grown predominantly in the Kamalapura region of Kalaburagi district, Karnataka, India. This unique cultivar, locally known as Red Dacca banana, is recognised for its distinctive reddish peel, characteristic aroma, sweetness, and superior nutritional attributes. Due to its unique agro-climatic adaptation and traditional cultivation practices, Kamalapura Red Banana has received Geographical Indication (GI) status from the Government of India, which authenticates its regional origin and distinctive quality characteristics linked to the specific geographical environment. Banana is one of the most important fruit crops globally and is widely cultivated in tropical and subtropical regions. India is the largest producer of bananas in the world, contributing significantly to global production (FAOSTAT, 2023). Bananas are valued not only for their energy-rich carbohydrate content but also for their essential micronutrients, dietary fibre, and bioactive compounds. In addition to vitamins and minerals, bananas contain appreciable amounts of proteins and free amino acids, which contribute to their nutritional and functional significance. Amino acids are fundamental building blocks of proteins and play vital roles in human metabolism, growth, tissue repair, and immune function. Essential amino acids must be obtained through diet, while non-essential amino acids are synthesised within the body. The amino acid composition of foods is a critical determinant of protein quality and biological value (Food and Agriculture Organisation/World Health Organisation, 2013). Evaluation of amino acid profiles in fruits such as bananas provides insight into their contribution toward dietary protein requirements and their potential use in functional food development. Red banana varieties have been reported to possess higher antioxidant activity, enhanced micronutrient content, and improved sensory characteristics compared to conventional yellow cultivars. However, detailed characterisation of the amino acid composition of GI-tagged Kamalapura Red Banana remains limited. Scientific documentation of its biochemical profile is essential to support its nutritional claims, promote value addition, and strengthen its market potential.
Therefore, the present study was undertaken to evaluate the amino acid profile of fresh Kamalapura Red Dacca Banana (Musa acuminata) using standardised analytical techniques.
The findings aim to contribute to the nutritional database of this GI-tagged indigenous fruit and to explore its potential applications in health-oriented and functional food formulations.
Materials and Methods
Materials and Methods
Sample collection of fresh red banana
Fresh Red Dacca banana (Musa acuminata) samples were procured in November 2025 from a farmer's field in Kamalapura, Kalaburagi district, Karnataka, India. The fruits were harvested at the completely unripe stage to ensure uniform physiological maturity and to maintain consistency for biochemical analysis. Immediately after harvest, the banana bunches were packed in jute bags to facilitate aeration and maintain ambient temperature, and subsequently placed in corrugated cardboard boxes to prevent mechanical injury during transit. The samples were transported from Kamalapura to Hyderabad under standard handling conditions for laboratory analysis.
Amino acid profiling of fresh red banana
Amino acid profiling of the fresh Red Dacca banana samples was carried out in November 2025 at the Biochem Research and Testing Laboratory (BRTL). The main laboratory is located at Shiv Shanth, Near Ishwar Temple, Kumareshwar Nagar, Dharwad -580008, Karnataka, with a branch facility at 12-5-149/4/1, No. 202, 2nd Floor, Near Mahankali Temple, Vijaypuri Colony, Tarnaka, Hyderabad -500017, Telangana. The laboratory operates as an incubatee under KRISHIK-ABI (ICAR RKVY-RAFTAAR), University of Agricultural Sciences, Dharwad -580005, Karnataka. All analytical procedures were performed at BRTL following validated and standardised laboratory protocols for quantitative amino acid determination. The analysis was conducted under controlled laboratory conditions, and the results were documented in Report No. BRTL/2026/002. The parameters evaluated included the quantification of individual essential and non-essential amino acids present in the fresh Red Dacca banana samples. The total amino acid profile of fresh Red Dacca banana (Musa acuminata) was determined using standardised analytical procedures for amino acid quantification. The analysis included both essential and non-essential amino acids, namely alanine, arginine, aspartic acid, glutamic acid, glycine, proline, serine, tyrosine, histidine, isoleucine, leucine, lysine, methionine, cystine, phenylalanine, threonine, and valine. Samples were subjected to appropriate hydrolysis and derivatisation procedures before quantitative estimation, and the individual amino acids were separated and quantified using established chromatographic techniques as described in standard methods for amino acid analysis (AOAC, 2019; Henderson et al., 2000). The total amino acid content was calculated as the sum of the quantified individual amino acids and expressed on a fresh weight basis.
Procedure of Amino Acid Analysis by HPLC
Amino acid profiling of fresh Red Dacca banana (Musa acuminata) was performed following standard acid hydrolysis and high-performance liquid chromatography (HPLC) procedures (AOAC, 2019; Henderson et al., 2000). Approximately 100 mg of the homogenised sample was weighed into a 20 mL glass ampoule, and 5 mL of 6N hydrochloric acid (HCl) was added. The sample was frozen and flushed with nitrogen gas for 1 minute to remove oxygen and prevent oxidative degradation of amino acids. The ampoule was sealed and subjected to hydrolysis at 110°C for 21 hours. After hydrolysis, the sample was cooled to room temperature and diluted to a final volume of 25 mL with ultrapure water. The hydrolysate was filtered, and a 5 mL aliquot was evaporated to dryness using a vacuum evaporator. The resulting residue was reconstituted in 2.5 mL of sodium citrate buffer and filtered through a 0.45 µm membrane filter before chromatographic analysis. Quantitative determination of amino acids was carried out using a Biochrom 30 amino acid analyser (Biochrom Ltd., Cambridge, UK). Separation was achieved on a PEEK resin column (20 × 4.6 mm) packed with Ultropac 8 cationexchange resin. Post-column derivatisation was performed using the ninhydrin reagent for detection. The analysis was conducted at a flow rate of 0.5 mL/min with a total run time of 25 minutes. Amino acids were identified and quantified by comparing retention times and peak areas with those of authenticated standards.
Results
Results
Amino Acid Profile of Fresh Red Banana (Musa acuminata)
Amino Acid Profile of Fresh Red Banana (Musa acuminata)
Amino acid profiling of Fresh Red Banana
The total amino acid composition of the sample was quantified and expressed as mean ± standard deviation (SD) of two independent determinations (R1 and R2).
International Journal of Agriculture and Nutrition https://www.agriculturejournal.net Among all amino acids analysed, glutamic acid (15.92 ± 0.06 mg/100 g) was found to be the most abundant, followed by aspartic acid (10.01 ± 0.32 mg/100 g). These acidic amino acids constituted a major proportion of the total amino acid pool. Among essential amino acids, leucine (7.05 ± 0.10 mg/100 g) showed the highest concentration, followed by valine (5.13 ± 0.08 mg/100 g) and histidine (5.25 ± 0.06 mg/100 g). Moderate levels were observed for phenylalanine (4.51 ± 0.09 mg/100 g), isoleucine (3.10 ± 0.03 mg/100 g), and threonine (3.18 ± 0.05 mg/100 g). Non-essential amino acids such as glycine (4.29 ± 0.06 mg/100 g), serine (3.94 ± 0.06 mg/100 g), alanine (3.85 ± 0.05 mg/100 g), and proline (3.20 ± 0.02 mg/100 g) were also present in appreciable amounts. Sulphur-containing amino acids, namely methionine (0.35 ± 0.04 mg/100 g) and cystine (0.34 ± 0.02 mg/100 g), were present in comparatively lower concentrations.
The low SD values observed across all amino acids indicate good analytical precision and reproducibility between replicates.
Discussion
The predominance of glutamic acid and aspartic acid suggests that the sample possesses a strong contribution of acidic amino acids, which are known to enhance flavour characteristics (umami taste) and play a key role in nitrogen metabolism.
The relatively higher concentration of leucine among essential amino acids is nutritionally significant, as leucine is crucial for muscle protein synthesis and metabolic regulation. Similarly, adequate levels of valine and isoleucine contribute to branched-chain amino acid (BCAA) availability, which is important for tissue repair and energy metabolism.
The moderate presence of lysine (2.70 ± 0.11 mg/100 g) is noteworthy, as lysine is often a limiting amino acid in cereal-based foods. Therefore, the observed profile may contribute positively to protein quality when included in composite diets. However, sulphur-containing amino acids (methionine and cystine) were comparatively lower, which may slightly limit the biological value of the protein if consumed as a sole protein source. Complementation with other protein sources rich in sulphur amino acids may enhance overall protein quality.
Overall, the amino acid profile indicates a balanced distribution of essential and non-essential amino acids with good analytical consistency. The presence of substantial levels of essential amino acids supports the nutritional potential of the sample and its possible application in functional food development.
Conclusion
The present study demonstrates that the sample possesses a well-distributed amino acid profile with appreciable levels of both essential and non-essential amino acids. Glutamic acid and aspartic acid were predominant, contributing significantly to the total amino acid content and potentially enhancing both nutritional and sensory properties. Among essential amino acids, leucine, valine, and histidine were present in higher concentrations, indicating good potential for supporting protein synthesis, metabolic regulation, and tissue repair.
Although sulphur-containing amino acids (methionine and cystine) were observed in lower amounts, the overall amino acid composition suggests satisfactory protein quality when the sample is consumed as part of a balanced or complementary diet. The low standard deviation values further confirm the precision and reliability of the analytical procedure.
In conclusion, the evaluated sample exhibits a nutritionally promising amino acid profile and may serve as a valuable ingredient in functional foods, protein supplementation strategies, or composite dietary formulations aimed at improving protein intake and overall nutritional quality.
Acknowledgement
Acknowledgments
Figures and tables from the paper
| Sl. No | Amino acid (mg/100g) | R1 | R2 | Mean ± SD |
|---|---|---|---|---|
| 1. | Alanine | 3.88 | 3.81 | 3.85 ± 0.05 |
| 2. | Arginine | 1.92 | 1.95 | 1.94 ± 0.02 |
| 3. | Aspartic acid | 10.23 | 9.78 | 10.01 ± 0.32 |
| 4. | Glutamic acid | 15.88 | 15.96 | 15.92 ± 0.06 |
| 5. | Glycine | 4.25 | 4.33 | 4.29 ± 0.06 |
| 6. | Proline | 3.21 | 3.18 | 3.20 ± 0.02 |
| 7. | Serine | 3.98 | 3.89 | 3.94 ± 0.06 |
| 8. | Tyrosine | 1.37 | 1.44 | 1.41 ± 0.05 |
| 9. | Histidine | 5.21 | 5.29 | 5.25 ± 0.06 |
| 10. | Isolucine | 3.12 | 3.08 | 3.10 ± 0.03 |
| 11. | Leucine | 6.98 | 7.12 | 7.05 ± 0.10 |
| 12. | Lysine | 2.78 | 2.62 | 2.70 ± 0.11 |
| 13. | Methionine | 0.32 | 0.38 | 0.35 ± 0.04 |
| 14. | Cystine | 0.32 | 0.35 | 0.34 ± 0.02 |
| 15. | Phenylalanine | 4.57 | 4.44 | 4.51 ± 0.09 |
| 16. | Threonin | 3.21 | 3.14 | 3.18 ± 0.05 |
| 17. | Valine | 5.19 | 5.07 | 5.13 ± 0.08 |
Table text extracted from the original PDF; superscript letters are shown inline. The original table image is below.
View original table image
References
4 in the original paper- AOAC International. Official methods of analysis. 21st ed. Rockville (MD): AOAC International; 2019.
- Food and Agriculture Organization of the United Nations, World Health Organization. Dietary protein quality evaluation in human nutrition. FAO Food Nutr Pap No. 92. Rome: FAO; 2013.
- Food and Agriculture Organization of the United Nations. FAOSTAT: Food and agriculture data [Internet]. Rome: FAO; 2023 [cited 2026 Jun 15]. Available from: https://www.fao.org/faostat/
- Henderson JW, Ricker RD, Bidlingmeyer BA, Woodward C. Rapid, accurate, sensitive, and reproducible HPLC analysis of amino acids. Agilent Technologies Technical Note. Palo Alto (CA): Agilent Technologies; 2000.