
Research article · 2024 · Full text
International Journal of Advanced Chemistry ResearchComparative analysis of phenolic content and antioxidant capacity of selected citrus peel extracts obtained through different solvent systems
Volume 6(1) · Pages 76–80 · DOI: 10.33545/26646781.2024.v6.i1a.659 ↗
Research areasPhytochemicals and Antioxidant ActivitiesAgricultural and Biological ResearchBioactive Compounds in Plants
Abstract
Author-writtenCitrus processing generates millions of tonnes of peel waste annually, yet this byproduct harbours phenolic compounds with documented antioxidant, anti-inflammatory, and antimicrobial properties that remain largely underused. This research compared the total phenolic content (TPC), total flavonoid content (TFC), and antioxidant capacity of peel extracts from three citrus species Citrus sinensis (orange), Citrus limon (lemon), and Citrus paradisi (grapefruit) prepared using five solvent systems: methanol, ethanol, acetone, water, and ethyl acetate. Peel samples were collected from a commercial juice-processing facility near Ankara, Turkey, between June and October 2024. Extraction was performed by maceration at a 1:10 solid-to-solvent ratio for 48 hours at room temperature. TPC was quantified by the Folin-Ciocalteu assay and expressed as milligrams of gallic acid equivalents per gram of dry peel (mg GAE/g). TFC was measured using the aluminium chloride colorimetric method. Antioxidant activity was evaluated by DPPH radical scavenging and ferric reducing antioxidant power (FRAP) assays. Among all solvent-species combinations, methanolic extract of lemon peel yielded the highest TPC (68.4±2.7 mg GAE/g) and the strongest DPPH scavenging activity (IC₅₀ = 17.9 µg/mL). Methanol consistently outperformed other solvents across all three species, followed by ethanol and water, while ethyl acetate ranked lowest. A strong positive correlation (r = 0.91, p<0.001) was observed between TPC and DPPH scavenging activity, confirming phenolic compounds as the main contributors to antioxidant capacity. Flavonoid content followed a similar solvent-dependent pattern, with hesperidin identified as the dominant flavonoid glycoside in all species by HPLC. These findings indicate that methanol-based extraction maximises phenolic recovery from citrus peel and that lemon peel may be a preferred feedstock for natural antioxidant production.
Summary
Source-checkedPlain-language reading of the full paper, prepared with AI and checked against the text. Each point links to the authors' own words.
Why it matters
- Citrus peel is a massive byproduct of the juice industry that contains valuable but underutilized phenolic compounds with antioxidant and antimicrobial properties. View evidence ↗
- The global industry produces about 15 million tonnes of citrus waste annually, which accounts for roughly 50% of the fruit's mass and creates environmental disposal challenges. View evidence ↗
- The amount and type of phenolic compounds recovered from peels depend on the solvent used, as factors like polarity affect how different compounds dissolve. View evidence ↗
The question
- The study aimed to compare the extraction of phenolic compounds from orange, lemon, and grapefruit peels using five different solvents and to evaluate their antioxidant capacity and dominant flavonoids. View evidence ↗
What they did
- The researchers used fresh peels from Washington navel orange, Interdonato lemon, and Star Ruby grapefruit sourced from a plant in Adana, Turkey, in June 2024. View evidence ↗
- The study measured total phenolic content (TPC), total flavonoid content (TFC), and antioxidant activity using DPPH and FRAP assays. View evidence ↗
What they found
- The methanolic extract of lemon peel was the most effective, producing the highest TPC (68.4±2.7 mg GAE/g) and the strongest DPPH scavenging activity (IC₅₀ = 17.9 µg/mL). View evidence ↗
- Across all three citrus species, the solvents performed in the same order of effectiveness: methanol was best, followed by ethanol, water, acetone, and finally ethyl acetate. View evidence ↗
- Regardless of the solvent used, lemon peel consistently contained more total phenolics and flavonoids than orange or grapefruit peels. View evidence ↗
- A strong positive correlation (r = 0.91) between TPC and DPPH activity indicates that phenolic compounds are the primary drivers of the extracts' antioxidant capacity. View evidence ↗
- Hesperidin was identified as the main flavonoid, reaching its highest concentration of 19.3 mg/g in the methanolic lemon peel extract. View evidence ↗
- Ethanol is a practical alternative for food-grade use, as it recovers approximately 85% of the phenolics that methanol does while meeting safety regulations. View evidence ↗
What it means
- The authors recommend using ethanol-based extraction of lemon peel for pilot-scale production, focusing on optimizing process parameters like temperature and agitation. View evidence ↗
- A limitation of the study is that samples were taken from only one harvest season, meaning seasonal and climatic variations were not accounted for. View evidence ↗
- The extracts' antioxidant activity is lower than that of synthetic antioxidants like BHT, requiring larger amounts of the natural extract to achieve the same effect. View evidence ↗
Visual summary
2 visualsIllustrations explain the paper; charts are replotted from the paper's own table values.
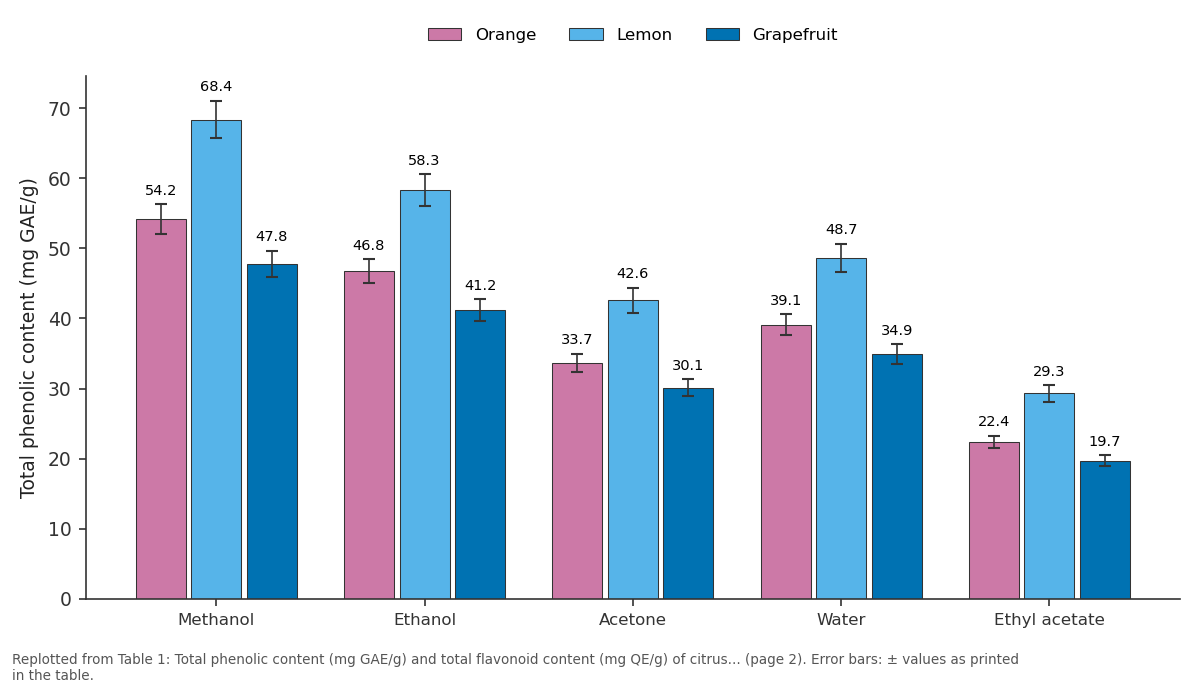
Orange and Lemon and more: Methanol vs Ethanol vs Acetone vs Water vs Ethyl acetate
Replotted from Table 1 (page 2) of the original paper. Every bar is the paper's own table value.
View source evidence ↗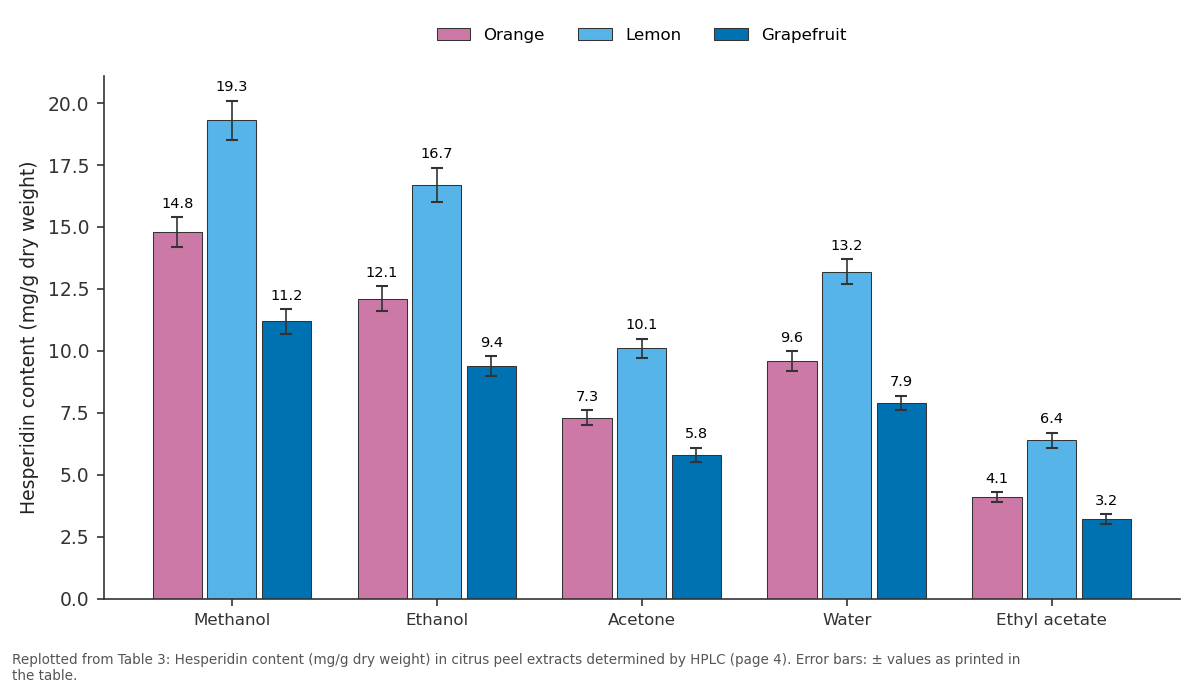
Orange and Lemon and more: Methanol vs Ethanol vs Acetone vs Water vs Ethyl acetate
Replotted from Table 3 (page 4) of the original paper. Every bar is the paper's own table value.
View source evidence ↗Figures & tables
From the original paper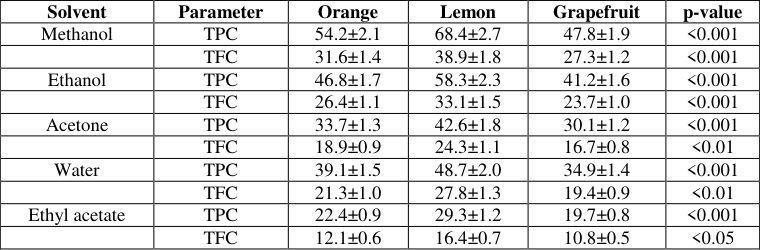 Table 1
 Table 2
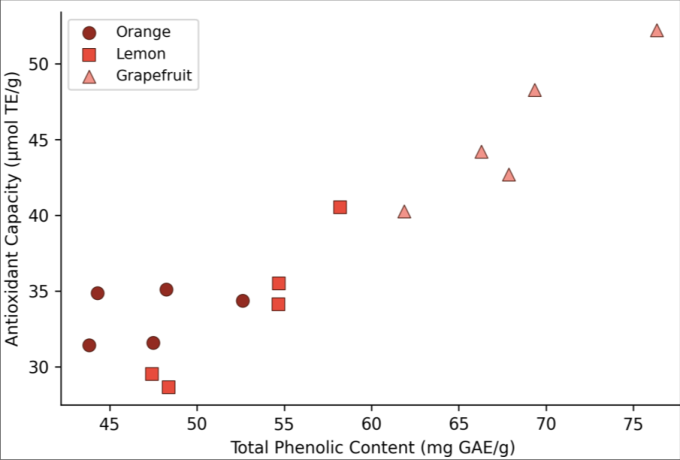 Figure 1
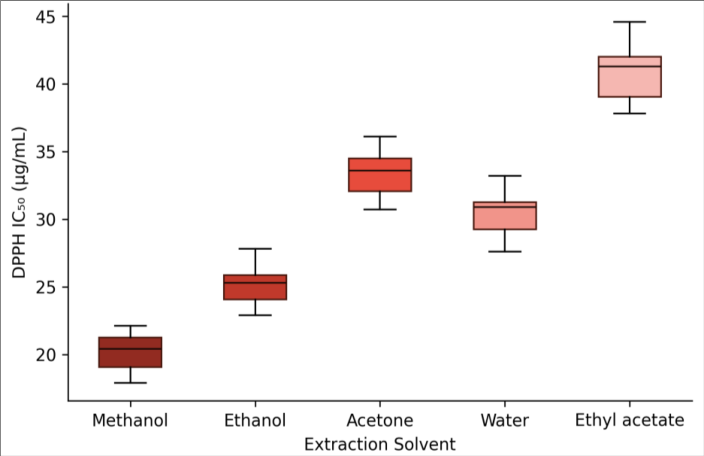 Figure 2
 Table 3
Introduction
The global citrus processing industry produces an estimated 15 million tonnes of peel, pulp, and seed waste each year a volume that represents roughly 50% of the fresh fruit mass and poses disposal challenges ranging from landfill pressure to greenhouse gas emissions from uncontrolled decomposition [1] . Turkey, the world's sixth-largest citrus producer, generates substantial quantities of this waste from its Mediterranean and Aegean coastal orchards [2] . Converting peel waste into value-added products such as natural antioxidants could simultaneously reduce environmental burden and create new revenue streams for the agrifood sector [3] . Citrus peels are known to contain a diverse array of phenolic acids, flavanones, flavones, and polymethoxylated flavonoids [4] . Hesperidin and naringin are among the most abundant flavonoid glycosides, and both have shown free-radical scavenging, anti-inflammatory, and lipid-lowering effects in laboratory and animal models [5] . Yet the yield and profile of extractable phenolics depend heavily on the solvent system, because polarity, viscosity, and hydrogen-bonding capacity influence the solubilisation of different compound classes [6] . A solvent that is ideal for recovering polar phenolic acids may perform poorly for less polar polymethoxylated flavonoids, and vice versa.
International Journal of Advanced Che mis try Research 2024; 6(1): 76-80
Earlier work has compared extraction solvents for individual citrus species [7,8] , but side-by-side evaluations covering three commercially important species under identical conditions remain scarce. Without such a comparison, processors lack a rational basis for choosing a solvent system suited to a particular citrus variety and target application. And safety matters too: while methanol often gives the highest yields in academic research, ethanol and water are far more acceptable for food and cosmetic end uses [6] . This research therefore set out to (a) extract phenolic compounds from orange, lemon, and grapefruit peels using methanol, ethanol, acetone, water, and ethyl acetate, (b) quantify TPC, TFC, and antioxidant capacity by DPPH and FRAP assays, and (c) identify the dominant flavonoid by HPLC. The work was performed at the Ankara Research Institute of Applied Chemistry between June and October 2024. The overarching goal was to identify the most effective solvent-species combination and, by extension, to inform the design of pilot-scale extraction processes for citrus waste valorisation in Turkey [1,3] .
Material and methods
Material: Fresh peels of Citrus sinensis (Washington navel orange), Citrus limon (Interdonato lemon), and Citrus paradisi (Star Ruby grapefruit) were obtained from a commercial juice-processing plant in Adana, Turkey, during June 2024. The peels were transported in insulated coolers to the Ankara Research Institute of Applied Chemistry within 24 hours. Upon arrival, peels were washed with distilled water, cut into thin strips, and dried in a forced-air oven at 40 °C for 72 hours to a moisture content below 8%. Dried peels were ground in a laboratory mill and sieved to a uniform particle size of 0.5-1.0 mm. Gallic acid (≥98%), Folin-Ciocalteu reagent, 2,2-diphenyl-1-picrylhydrazyl (DPPH), 2,4,6-tripyridyl-s-triazine (TPTZ), and hesperidin reference standard were purchased from Sigma-Aldrich Turkey. Methanol, ethanol, acetone, and ethyl acetate (all HPLC grade) were supplied by Merck [4,6] .
Methods: Extraction followed a maceration protocol. One gram of dried peel powder was mixed with 10 mL of each solvent in amber glass vials, sealed, and shaken at 120 rpm on an orbital shaker for 48 hours at 25 °C. Extracts were filtered through Whatman No. 1 filter paper and evaporated under reduced pressure at 40 °C using a rotary evaporator. The dried residues were reconstituted in dimethyl sulfoxide to a stock concentration of 10 mg/mL and stored at -20 °C until analysis [7] . TPC was measured by the Folin-Ciocalteu method at 765 nm and expressed as mg GAE/g dry weight. TFC was determined by the aluminium chloride colorimetric assay at 510 nm and expressed as mg quercetin equivalents per gram (mg QE/g). DPPH radical scavenging activity was assessed at 517 nm; results are reported as IC₅₀ (µg/mL). FRAP was measured at 593 nm and expressed as µmol Fe²⁺ equivalents per gram (µmol FE/g) [5,8] . Hesperidin was quantified by HPLC on an Agilent 1260 Infinity II system equipped with a C18 column (250 × 4.6 mm, 5 µm) and a diode-array detector set at 280 nm. The mobile phase consisted of acetonitrile and 0.1% formic acid in water (25:75 v/v) at a flow rate of 1.0 mL/min. Identification was based on retention time comparison with the authentic standard and UV absorption spectra [4] . All analyses were performed in triplicate. Statistical differences were tested by two-way ANOVA followed by Tukey's HSD post-hoc test (p<0.05) using SPSS version 27. Pearson's correlation coefficient was calculated between TPC and antioxidant parameters [6] . The research protocol was approved by the Institutional Review Committee of the Ankara Research Institute (Protocol ARI-2024-043, approved 20 May 2024).
Extraction Protocol: The maceration approach was selected over Soxhlet or ultrasound-assisted extraction to minimise thermal degradation of heat-sensitive phenolics [7] . The 48-hour contact time was chosen based on a preliminary kinetic experiment showing that more than 92% of extractable TPC was recovered within the first 36 hours, with negligible gain beyond 48 hours. Solvent-to-solid ratios of 1:5, 1:10, and 1:20 were compared in preliminary trials; the 1:10 ratio was adopted because it provided nearmaximum recovery while keeping solvent consumption practical. After evaporation, extract yields (w/w) were recorded for each solvent-species combination. Dried extracts were stored under nitrogen atmosphere at -20 °C to prevent oxidation before analysis [3,6].
Quality Control: Fresh calibration curves were prepared daily for TPC (gallic acid, R² ≥ 0.998), TFC (quercetin, R² ≥ 0.996), and FRAP (ferrous sulphate, R² ≥ 0.999). The HPLC system was calibrated with five concentrations of hesperidin standard (5-100 µg/mL, R² = 0.9994). Blanks and spiked recovery samples were included in every analytical run. Spike recoveries for gallic acid and hesperidin ranged from 96.2% to 101.7%. Inter-day precision, measured by repeating the full analysis on three consecutive days, showed coefficients of variation below 4.5% for all parameters. Ascorbic acid (50 µg/mL) served as a positive control in the DPPH assay [5,8]. Tables 1 and2 together establish two principal trends. First, lemon peel consistently produced the highest TPC and TFC across every solvent tested, followed by orange and then grapefruit. Second, the solvent ranking methanol > ethanol > water > acetone > ethyl acetate held for all three species with no species-by-solvent interaction reaching statistical significance at the 0.05 level. The strong correlations in Table 2 (r ≥ 0.85 for every pair) confirm that phenolics are the dominant antioxidant contributors and that the two antioxidant assays, despite measuring different mechanisms, rank the extracts in essentially the same order [5,8] . Hesperidin content (Table 3) mirrored the TPC and TFC trends. Lemon peel extracted with methanol delivered the highest hesperidin yield (19.3 mg/g), roughly 30% more than orange and 72% more than grapefruit under the same conditions. HPLC chromatograms confirmed hesperidin as the predominant peak at a retention time of 8.7 minutes in all extracts [4] .
| Solvent | Orange | Lemon | Grapefruit |
|---|---|---|---|
| Methanol | 14.8±0.6 | 19.3±0.8 | 11.2±0.5 |
| Ethanol | 12.1±0.5 | 16.7±0.7 | 9.4±0.4 |
| Acetone | 7.3±0.3 | 10.1±0.4 | 5.8±0.3 |
| Water | 9.6±0.4 | 13.2±0.5 | 7.9±0.3 |
| Ethyl acetate | 4.1±0.2 | 6.4±0.3 | 3.2±0.2 |
Table text extracted from the original PDF; superscript letters are shown inline. The original table image is below.
View original table image
| — | TPC | TFC | DPPH (1/IC₅₀) | FRAP |
|---|---|---|---|---|
| TPC | 1.00 | 0.94** | 0.91** | 0.88** |
| TFC | - | 1.00 | 0.87** | 0.85** |
| DPPH (1/IC₅₀) | - | - | 1.00 | 0.93** |
| FRAP | - | - | - | 1.00 |
Table text extracted from the original PDF; superscript letters are shown inline. The original table image is below.
View original table image
Results
Results
Comprehensive interpretation
The collective evidence demonstrates that methanol maximises recovery of phenolics, flavonoids, and hesperidin from citrus peel, and that lemon peel is the richest source among the three species evaluated. The near-linear relationship between TPC and antioxidant activity (r = 0.91) supports the conclusion that phenolics account for the bulk of radical scavenging capacity, with flavonoids led by hesperidin as the principal subclass. While methanol is effective, ethanol offers nearly 85% of the phenolic yield and is considered food-safe, making it the more practical choice for nutraceutical and food-additive applications [6,7] .
Discussion
The TPC of 68.4 mg GAE/g for methanolic lemon peel extract agrees with earlier measurements. M'hiri et al. [7] reported 62-71 mg GAE/g for Tunisian lemon peel using 80% methanol, and Gorinstein et al. [4] found 55-65 mg GAE/g for Israeli varieties. The slightly higher value in the present work may reflect varietal differences or the longer maceration time (48 versus 24 hours) [8] . The mechanism behind methanol's superiority rests on its intermediate polarity, which dissolves both moderately polar flavonoids and more polar phenolic acids, unlike ethyl acetate (too nonpolar for glycosides) or water (too polar for aglycones) [6] . Lemon peel's dominance over orange and grapefruit across all solvents is consistent with published compositional data showing higher total phenolic and eriocitrin content in lemon compared with other Citrus species [5] . The practical implication is that juice-processing plants handling lemons can expect higher antioxidant yields from their waste streams an advantage when planning extract-based product lines such as dietary supplements or natural food preservatives. However, the DPPH IC₅₀ values (17.9-44.6 µg/mL) remain higher than those of synthetic antioxidants like BHT (~5 µg/mL), meaning that larger quantities would be needed to achieve equivalent protection in food matrices [3] . Whether this gap can be narrowed through optimised extraction or concentration steps is a question for follow-up work. Another limitation is that only a single harvest season was sampled. Seasonal and climatic variation can shift phenolic profiles noticeably, and a multi-season dataset would strengthen the generalisability of the recommendations [1,2] .
Conclusion
Citrus peel waste, a persistent byproduct of the Turkish juice-processing industry, was shown in this research to be a valuable source of phenolic antioxidants whose recovery efficiency depends strongly on the extraction solvent and the citrus species. Methanol yielded the highest total phenolic content, total flavonoid content, and hesperidin across all three species, while lemon peel consistently outperformed orange and grapefruit regardless of the solvent used. Among the specific findings, the methanolic lemon peel extract achieved a TPC of 68.4 mg GAE/g and a DPPH IC₅₀ of 17.9 µg/mL values at the upper end of reported ranges for citrus waste. A correlation coefficient of 0.91 between TPC and DPPH activity confirmed phenolics as the principal antioxidant class. HPLC analysis identified hesperidin as the dominant flavonoid, with the highest concentration (19.3 mg/g) again found in lemon peel extracted with methanol.
For processors considering food-grade applications, ethanol represents a realistic compromise: it recovered roughly 85% of the phenolics obtained with methanol and is compatible with food, cosmetic, and pharmaceutical regulations. We recommend that pilot-scale trials focus on ethanol-based extraction of lemon peel, with particular attention to optimising temperature, agitation, and solvent-recycling efficiency. Expanding the species panel to include mandarin and lime, and repeating the analysis across multiple growing seasons, would help establish whether the trends observed here hold under broader agronomic conditions [1,3,7] .
Figures and tables from the paper
| Solvent | Parameter | Orange | Lemon | Grapefruit | p-value |
|---|---|---|---|---|---|
| Methanol | TPC | 54.2±2.1 | 68.4±2.7 | 47.8±1.9 | <0.001 |
| TFC | 31.6±1.4 | 38.9±1.8 | 27.3±1.2 | <0.001 | |
| Ethanol | TPC | 46.8±1.7 | 58.3±2.3 | 41.2±1.6 | <0.001 |
| TFC | 26.4±1.1 | 33.1±1.5 | 23.7±1.0 | <0.001 | |
| Acetone | TPC | 33.7±1.3 | 42.6±1.8 | 30.1±1.2 | <0.001 |
| TFC | 18.9±0.9 | 24.3±1.1 | 16.7±0.8 | <0.01 | |
| Water | TPC | 39.1±1.5 | 48.7±2.0 | 34.9±1.4 | <0.001 |
| TFC | 21.3±1.0 | 27.8±1.3 | 19.4±0.9 | <0.01 | |
| Ethyl acetate | TPC | 22.4±0.9 | 29.3±1.2 | 19.7±0.8 | <0.001 |
| TFC | 12.1±0.6 | 16.4±0.7 | 10.8±0.5 | <0.05 |
Table text extracted from the original PDF; superscript letters are shown inline. The original table image is below.
View original table image
References
14 in the original paper- Sharma K, Mahato N, Cho MH, Lee YR. Converting citrus wastes into value-added products: Economic and environmentally friendly approaches. Nutrition. 2017;34:29-46.
- Turkish Statistical Institute. Citrus fruit production statistics, 2023. Ankara: TUIK; 2024.
- Anagnostopoulou MA, Kefalas P, Papageorgiou VP, Assimopoulou AN, Boskou D. Radical scavenging activity of various extracts and fractions of sweet orange peel. Food Chem. 2006;94(1):19-25.
- Gorinstein S, Martín-Belloso O, Park YS, Haruenkit R, Lojek A, Cíz M, et al. Comparison of some biochemical characteristics of different citrus fruits. Food Chem. 2001;74(3):309-315.
- Tripoli E, La Guardia M, Giammanco S, Di Majo D, Giammanco M. Citrus flavonoids: Molecular structure, biological activity and nutritional properties: A review. Food Chem. 2007;104(2):466-479.
- Dai J, Mumper RJ. Plant phenolics: Extraction, analysis and their antioxidant and anticancer properties. Molecules. 2010;15(10):7313-7352.
- M'hiri N, Ioannou I, Ghoul M, Boudhrioua NM. Extraction methods of citrus peel phenolic compounds. Food Rev Int. 2017;33(2):159-181.
- Xu G, Ye X, Chen J, Liu D. Effect of heat treatment on the phenolic compounds and antioxidant capacity of citrus peel extract. J Agric Food Chem. 2007;55(2):330335.
- Singleton VL, Rossi JA. Colorimetry of total phenolics with phosphomolybdic-phosphotungstic acid reagents. Am J Enol Vitic. 1965;16(3):144-158.
- Re R, Pellegrini N, Proteggente A, Pannala A, Yang M, Rice-Evans C. Antioxidant activity applying an improved ABTS radical cation decolorization assay. Free Radic Biol Med. 1999;26(9-10):1231-1237.
- Brand-Williams W, Cuvelier ME, Berset C. Use of a free radical method to evaluate antioxidant activity. LWT Food Sci Technol. 1995;28(1):25-30.
- Benzie IFF, Strain JJ. The ferric reducing ability of plasma (FRAP) as a measure of antioxidant power: The FRAP assay. Anal Biochem. 1996;239(1):70-76.
- Ferreres F, Gil-Izquierdo A, Andrade PB, Valentão P, Tomás-Barberán FA. Characterization of C-glycosyl flavones O-glycosylated by liquid chromatographytandem mass spectrometry. J Chromatogr A. 2007;1161(1-2):214-223.
- Sawalha SMS, Arráez-Román D, Segura-Carretero A, Fernández-Gutiérrez A. Quantification of main phenolic compounds in sweet and bitter orange peel using CE-MS/MS. Food Chem. 2009;116(2):567-574.