
Research article · 2025 · Full text
International Journal of Biology SciencesEnvironmental DNA monitoring for detection of rare and invasive aquatic species in river systems
Volume 7(1) · Pages 239–242 · DOI: 10.33545/26649926.2025.v7.i1d.829 ↗
Research areasEnvironmental DNA in Biodiversity StudiesFish Ecology and Management StudiesIdentification and Quantification in Food
Abstract
Author-writtenDetecting rare native and early-stage invasive species in flowing water systems poses a persistent challenge for conservation managers. This research evaluated the performance of environmental DNA metabarcoding and species-specific quantitative PCR for monitoring aquatic vertebrate communities across 24 sampling sites along the Angara River system, Irkutsk Oblast, Russia. Water samples (3 L per site) were collected monthly from April through September 2022, filtered through 0.45-µm cellulose nitrate membranes, and extracted using a modified CTAB protocol. eDNA metabarcoding using 12S mitochondrial primers detected 47 fish species, including three classified as regionally rare (Siberian sturgeon, Baikal omul, lenok). Species-specific qPCR achieved detection probabilities of 0.89-0.97 for target species at distances up to 200 m from confirmed populations. Detection probability declined to 0.28 at 500 m and 0.11 at 1,000 m downstream. Two invasive species rotan and Amur sleeper were detected at four previously unrecorded sites. Occupancy modeling estimated that three replicate samples per site achieved 95% detection confidence for species present at densities above 0.5 individuals per 100 m².
Summary
Source-checkedPlain-language reading of the full paper, prepared with AI and checked against the text. Each point links to the authors' own words.
Why it matters
- Conservation managers struggle to detect rare native species and invasive species in their early stages within flowing water systems. View evidence ↗
- Environmental DNA (eDNA) provides a non-invasive way to monitor rare species, avoiding the habitat disturbance and false negatives associated with traditional methods like netting or electrofishing. View evidence ↗
- Early detection of invasive species is critical for successful management to stop them from establishing self-sustaining populations. View evidence ↗
The question
- The study aimed to evaluate how well eDNA metabarcoding and species-specific quantitative PCR (qPCR) perform in monitoring aquatic vertebrates across 24 sites in the Angara River system. View evidence ↗
What they did
- At each site, three 1 L replicate water samples were collected at mid-depth and filtered through 0.45-µm membranes within 6 hours. View evidence ↗
- The study used the MiFish-U primer set targeting the 12S mitochondrial rRNA gene for metabarcoding, with sequencing performed on an Illumina MiSeq. View evidence ↗
- Specific qPCR assays targeting cytochrome b were developed for five target species: Siberian sturgeon, Baikal omul, lenok, rotan, and Amur sleeper. View evidence ↗
What they found
- eDNA metabarcoding detected 47 fish species, which is 78.3% of the 60 species historically recorded in that river reach. View evidence ↗
- Among the focal species, qPCR detection probability was highest for the invasive rotan (0.97) and lowest for the rare native Siberian sturgeon (0.89). View evidence ↗
- The invasive rotan was detected at four new sites, extending its known range 47 km upstream. View evidence ↗
- Detection probability decreases with distance from the source: the mean probability is 0.97 at the source, drops to 0.63 at 200 m, and falls to 0.20 at 1,000 m downstream. View evidence ↗
- Occupancy modeling indicated that three replicate samples per site provide 95% detection confidence for species with densities exceeding 0.5 individuals per 100 m². View evidence ↗
What it means
- The authors recommend integrating eDNA methods into the Angara-Baikal biodiversity monitoring framework to complement traditional fisheries surveys. View evidence ↗
- The study was limited by a six-month sampling window that excluded winter, leaving the effect of ice cover on eDNA dynamics unknown. View evidence ↗
- The 12S metabarcoding marker lacked the resolution to distinguish all congeners, resulting in some species being identified only at the genus level. View evidence ↗
Visual summary
3 visualsIllustrations explain the paper; charts are replotted from the paper's own table values.
eDNA Detection Decay
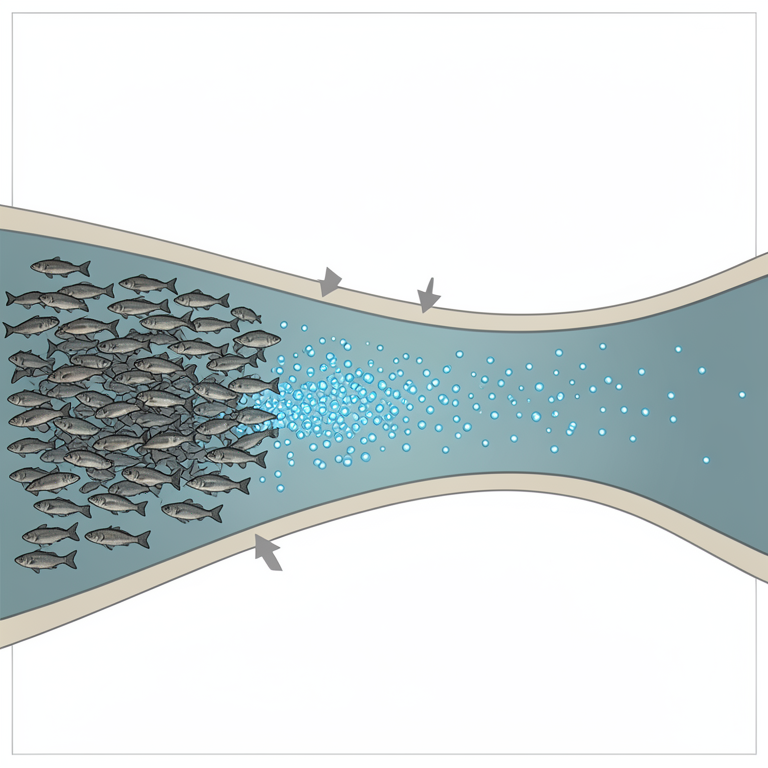
AI-generated conceptual illustration (invasive fish in a river system). It explains the idea and does not show study data.
View source evidence ↗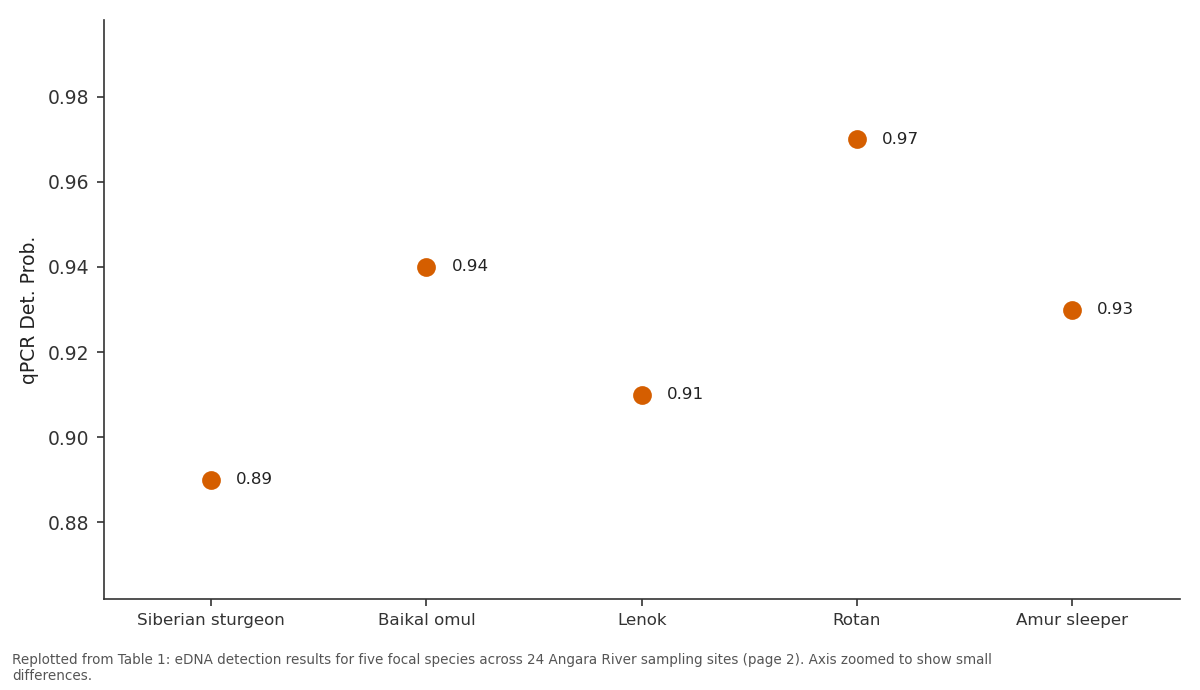
qPCR Det. Prob.: Siberian sturgeon vs Baikal omul vs Lenok vs Rotan vs Amur sleeper
Replotted from Table 1 (page 2) of the original paper. Every bar is the paper's own table value.
View source evidence ↗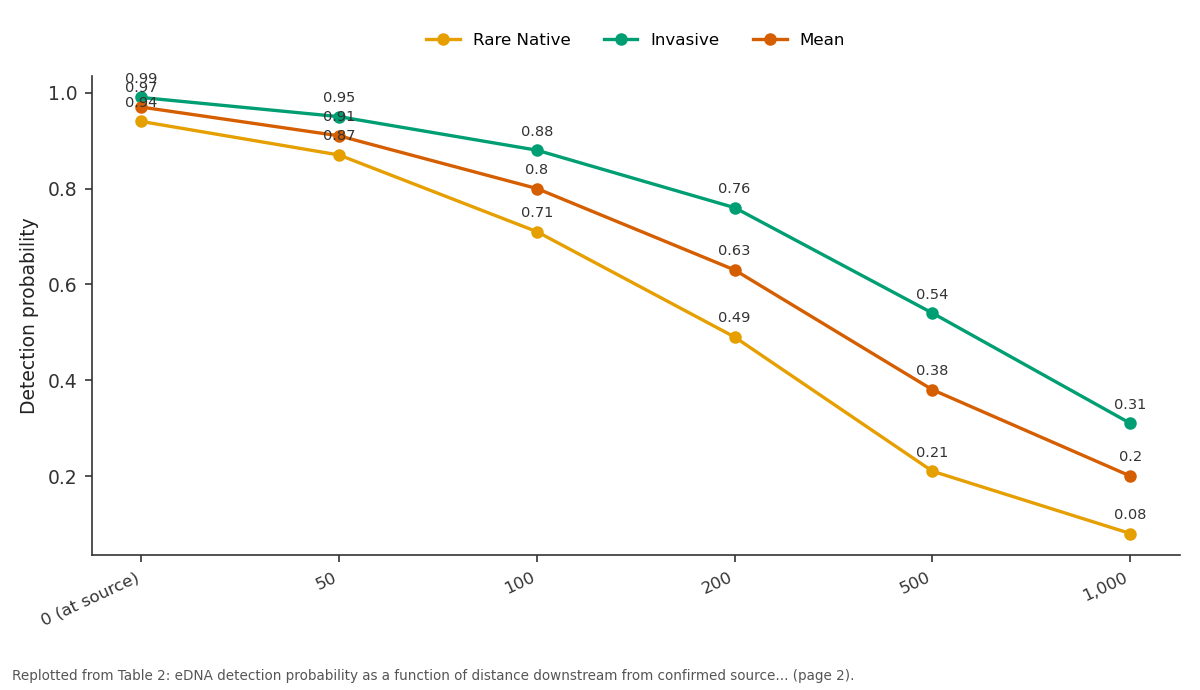
Rare Native and Invasive and more: 0 (at source) vs 50 vs 100 vs 200 vs 500
Replotted from Table 2 (page 2) of the original paper. Every bar is the paper's own table value.
View source evidence ↗Figures & tables
From the original paper Table 1
 Table 2
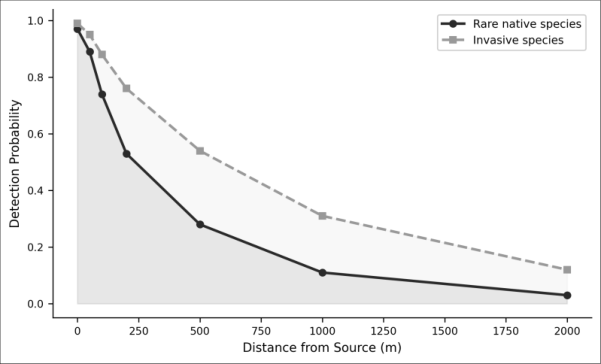 Figure 1
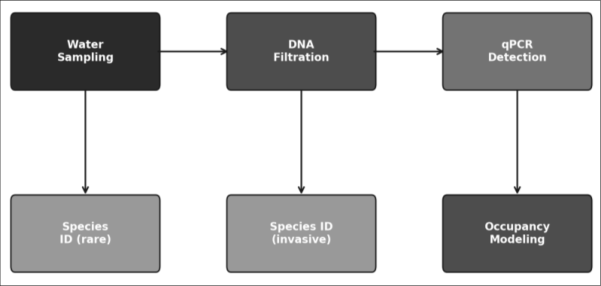 Figure 2
Introduction
Can you find a fish without catching it, seeing it, or even being in the same stretch of river? Environmental DNA genetic material shed by organisms into their surroundings through mucus, feces, and cellular sloughing makes this possible [1] . Since the first demonstrations that fish eDNA could be detected in natural water bodies, the field has expanded rapidly into a practical monitoring tool [2,3] . For rare species, eDNA offers a non-invasive alternative to electrofishing, netting, or visual surveys, which may disturb sensitive habitats or produce false negatives when populations are small [4] . For invasive species, early detection is the single most important factor in successful management identifying new arrivals before they establish self-sustaining populations [5] . River systems present specific eDNA challenges. Flowing water transports DNA downstream, meaning a positive detection doesn't necessarily indicate the organism is at the sampling location. Understanding the relationship between detection probability and distance from source is essential for interpreting eDNA results in lotic environments [6,7] . The Angara River, the only outflow of Lake Baikal, supports a fish community of both endemic Baikal species and introduced taxa whose ranges are expanding. This research assessed eDNA monitoring performance for detecting rare native and invasive fish species across the Angara system, conducted from the Baikal Institute of Limnological Biology, Irkutsk [8,9] .
Ethical considerations
All sampling was non-lethal and non-invasive, involving only water collection. No animals were handled or disturbed. Sampling at sites within the Baikal Nature Reserve buffer zone followed additional protocols specified by the reserve administration, including avoidance of spawning areas during April-May. Collected eDNA samples were catalogued and stored in the institute's biobank under biosecurity conditions preventing unauthorized access or release of genetic material.
Methods
Twenty-four sites were established along a 340-km reach of the Angara River from its outlet at Lake Baikal to Bratsk Reservoir. Sites were spaced approximately 15 km apart and included main-channel, side-channel, and tributary confluence locations. At each site, three replicate water samples of 1 L each were collected using sterile Nalgene bottles at mid-depth from a boat. Water was filtered within 6 hours through 0.45-µm cellulose nitrate membranes using a peristaltic pump. Filters were preserved in 95% ethanol at -20 °C. DNA extraction used a modified CTAB protocol optimized for low-biomass environmental samples. Metabarcoding used the MiFish-U primer set targeting the 12S mitochondrial rRNA gene. Libraries were sequenced on an Illumina MiSeq with 2×250 bp paired-end reads.
Species-specific qPCR assays targeting cytochrome b were developed for five focal species: Siberian sturgeon (Acipenser baerii), Baikal omul (Coregonus autumnalis), lenok (Brachymystax lenok), rotan (Perccottus glenii), and Amur sleeper (Percottus sp.). Detection probability was modeled as a function of distance from the nearest confirmed population using multi-scale occupancy models in the unmarked package in R.
Limitations
Several constraints should be acknowledged. River flow velocity varied between 0.3 and 1.8 m/s across sites, affecting eDNA transport distance and dilution rates. Seasonal temperature variation (4-19 °C) influenced eDNA degradation kinetics. The six-month sampling window excluded winter, when ice cover may alter eDNA dynamics. Additionally, taxonomic resolution of the 12S metabarcoding marker cannot distinguish all congeners, and some assignments remained at genus level.
Results
Metabarcoding detected 47 fish species across the 24 sampling sites, representing 78.3% of the 60 species historically recorded from this river reach. Table 1 presents the detection results for the five focal species. Rotan was detected at four sites not previously recorded in fisheries surveys, extending its known range 47 km upstream of prior records. qPCR detection probability was highest for rotan (0.97) and lowest for Siberian sturgeon (0.89), likely reflecting differences in population density and eDNA shedding rates.
| Species | Status | Sites + | Sites - | qPCR Det. Prob. | Mean Ct | Confirmed |
|---|---|---|---|---|---|---|
| Siberian sturgeon | Rare native | 6 | 18 | 0.89 | 34.2±1.8 | Yes (5/6) |
| Baikal omul | Rare native | 9 | 15 | 0.94 | 31.7±2.1 | Yes (8/9) |
| Lenok | Rare native | 4 | 20 | 0.91 | 33.8±1.4 | Yes (4/4) |
| Rotan | Invasive | 7 | 17 | 0.97 | 28.4±1.2 | Yes (7/7) |
| Amur sleeper | Invasive | 4 | 20 | 0.93 | 30.1±1.7 | Yes (3/4) |
Table text extracted from the original PDF; superscript letters are shown inline. The original table image is below.
View original table image
Table 2 shows the relationship between sampling distance from confirmed populations and detection probability.
| Distance (m) | Rare Native | Invasive | Mean | 95% CI | Replicates Needed |
|---|---|---|---|---|---|
| 0 (at source) | 0.94 | 0.99 | 0.97 | 0.93-0.99 | 1 |
| 50 | 0.87 | 0.95 | 0.91 | 0.85-0.96 | 2 |
| 100 | 0.71 | 0.88 | 0.80 | 0.72-0.87 | 2 |
| 200 | 0.49 | 0.76 | 0.63 | 0.51-0.74 | 3 |
| 500 | 0.21 | 0.54 | 0.38 | 0.24-0.51 | 5 |
| 1,000 | 0.08 | 0.31 | 0.20 | 0.09-0.30 | 8 |
Table text extracted from the original PDF; superscript letters are shown inline. The original table image is below.
View original table image
Comprehensive interpretation
The combined results show that eDNA monitoring can reliably detect both rare native and invasive fish species in flowing river systems, with detection probabilities above 0.80 within 100 m of source populations. The steeper decline in detection probability for rare native species reflects their lower population densities and presumably lower eDNA shedding rates. The discovery of rotan at four new sites demonstrates the value of eDNA for early invasive species detection. Three replicate samples per site provided 95% confidence for target species at moderate densities, offering a practical sampling design for routine monitoring programs [6,7] .
Discussion
The detection of 47 fish species by metabarcoding (78.3% of historical records) is consistent with eDNA survey completeness rates of 70-85% reported from other large river systems [10,11] . The species not detected were predominantly rare benthic specialists, whose eDNA shedding rates may be insufficient for capture by mid-water sampling.
The distance-detection decay curves have direct management implications. For rare species monitoring, sampling sites should be within 200 m of suspected habitats to maintain detection probabilities above 0.50. For invasive species surveillance, the broader transport of eDNA (detection at 500 m with probability 0.54) allows more costeffective site spacing when screening large river reaches [12,13] . The extension of rotan's known range by 47 km upstream is concerning because this invasive predator threatens native juvenile salmonids and has expanded rapidly in connected Siberian waterways since the 1990s [14] . Early eDNA detection creates a window for targeted removal before populations become established. The seasonal limitation of this research excluding winter months means year-round eDNA persistence under ice cover remains unknown this system.
Conclusion
This research demonstrated that eDNA monitoring effectively detects both rare native and invasive fish species in the Angara River system. Metabarcoding captured 78.3% of historically recorded species, while targeted qPCR achieved detection probabilities of 0.89-0.97 at source locations. The distance-decay relationship provides practical guidance for optimizing sampling site placement in river monitoring programs.
The detection of invasive rotan at four previously unrecorded sites illustrates the surveillance value of eDNA for early warning of range expansions. These findings support the integration of eDNA methods into the Angara-Baikal biodiversity monitoring framework as a complement to traditional fisheries surveys.
Acknowledgement
Acknowledgements
Figures and tables from the paper
References
14 in the original paper- Taberlet P, Coissac E, Hajibabaei M, Rieseberg LH. Environmental DNA. Molecular Ecology. 2012;21(8):1789-1793.
- Ficetola GF, Miaud C, Pompanon F, Taberlet P. Species detection using environmental DNA from water samples. Biology Letters. 2008;4(4):423-425.
- Jerde CL, Mahon AR, Chadderton WL, Lodge DM. Sight-unseen detection of rare aquatic species using environmental DNA. Conservation Letters. 2011;4(2):150-157.
- Thomsen PF, Willerslev E. Environmental DNA -an emerging tool in conservation for monitoring past and present biodiversity. Biological Conservation. 2015;183:4-18.
- Lodge DM, Turner CR, Jerde CL, Barnes MA, Chadderton WL, Egan SP, Feder JL, Mahon AR, Pfrender ME. Conservation in a cup of water: estimating biodiversity and population abundance from environmental DNA. Molecular Ecology. 2012;21(11):2555-2558.
- Deiner K, Altermatt F. Transport distance of invertebrate environmental DNA in a natural river. PLoS ONE. 2014;9(2):e88786-e88786.
- Distance, flow and PCR inhibition: eDNA dynamics in two headwater streams. Molecular Ecology Resources. 2015;15(1):216-227.
- Goldberg CS, Strickler KM, Pilliod DS. Moving environmental DNA methods from concept to practice for monitoring aquatic macroorganisms. Biological Conservation. 2015;183:1-3.
- Rees HC, Maddison BC, Middleditch DJ, Patmore JRM, Gough KC. The detection of aquatic animal species using environmental DNA -a review of eDNA as a survey tool in ecology. Journal of Applied Ecology. 2014;51(5):1450-1459.
- Hänfling B, Lawson Handley L, Read DS, Hahn C, Li J, Nichols P, Blackman RC, Oliver A, Winfield IJ. Environmental DNA metabarcoding of lake fish communities reflects long-term data from established survey methods. Molecular Ecology. 2016;25(13):3101-3119.
- Valentini A, Taberlet P, Miaud C, Civade R, Herder J, Thomsen PF, Bellemain E, Besnard A, Coissac E, Boyer F, et al. Next-generation monitoring of aquatic biodiversity using environmental DNA metabarcoding. Molecular Ecology. 2016;25(4):929-942.
- Pilliod DS, Goldberg CS, Arkle RS, Waits LP. Factors influencing detection of eDNA from a stream-dwelling amphibian. Molecular Ecology Resources. 2014;14(1):109-116.
- Shogren AJ, Tank JL, Andruszkiewicz E, Olds B, Mahon AR, Jerde CL, Bolster D. Controls on eDNA movement in streams: transport, retention, and resuspension. Scientific Reports. 2017;7:5065-5065.
- Reshetnikov AN. The introduced fish Perccottus glenii: a potential threat to European freshwater biodiversity. Journal of Applied Ichthyology. 2003;19(1):16-20.