
Research article · 2025 · Full text
International Journal of Horticulture and Food ScienceCataloguing phenolic compound distribution of coconut in the Brazilian Cerrado
Volume 7(1) · Pages 168–171 · DOI: 10.33545/26631067.2025.v7.i1c.549 ↗
Research areasCoconut Research and ApplicationsPhytochemicals and Antioxidant ActivitiesPlant-Derived Bioactive Compounds
Abstract
Author-writtenA single coconut palm can produce over 75 fruits per year, yet the distribution of health-promoting phenolic compounds across its different tissues remains poorly mapped outside Southeast Asian growing zones. This research catalogued phenolic compound profiles in five anatomical parts of coconut (shell, husk fiber, testa, meat, and water) at three developmental stages from palms growing under Brazilian Cerrado conditions. Samples were collected from a 14-year-old plantation near Barreiras, Bahia, during July 2022 to February 2023, processed at the Cape Town University of Food and Nutrition, and analyzed through Folin-Ciocalteu assay and reversed-phase HPLC. Total phenolic content varied from 18.4 mg GAE/100g dry weight in mature coconut water to 418.7 mg GAE/100g in maturing husk fiber. Gallic acid was the dominant individual phenol, making up 28.4% of identifiable peaks in shell extracts. The testa, often discarded during processing, contained 312.4 mg GAE/100g at the maturing stage, positioning it as an underused source of bioactive compounds. Phenolic levels in the shell and husk peaked at 9 months then declined by maturity, while meat phenolics increased steadily through the 12-month mark. These findings indicate that harvest timing and tissue selection both shape the phenolic yield obtainable from Cerrado-grown coconut, with clear implications for waste valorization strategies.
Summary
Source-checkedPlain-language reading of the full paper, prepared with AI and checked against the text. Each point links to the authors' own words.
Why it matters
- A vast majority of coconut fruit weight, approximately 85%, is discarded as waste (husk, shell, and testa) during global harvesting. View evidence ↗
- Coconut cultivation has expanded in the Brazilian Cerrado, a tropical savanna of nearly 2 million square kilometers, due to improved irrigation. View evidence ↗
The question
- The study aimed to determine which coconut tissues and harvest stages provide the maximum yield of phenolic compounds in the Cerrado region. View evidence ↗
What they did
- Researchers collected 50 fruits per stage from five randomly selected palms at three developmental stages: immature (6 months), maturing (9 months), and mature (12 months). View evidence ↗
- Five distinct coconut tissues were analyzed: the shell, husk fiber, testa, meat, and water. View evidence ↗
- Total phenolic content was quantified using the Folin-Ciocalteu method with gallic acid as the standard. View evidence ↗
- Individual phenolic compounds were identified and separated using a Waters Alliance e2695 HPLC system. View evidence ↗
What they found
- The highest phenolic concentrations were found in the shell (418.7 mg GAE/100g) and testa (312.4 mg GAE/100g) during the maturing stage. View evidence ↗
- The lowest phenolic content was observed in mature coconut water, measuring 18.4 mg GAE/100g. View evidence ↗
- Gallic acid was the primary individual phenolic compound, accounting for 28.4% of the identifiable peaks in shell extracts. View evidence ↗
- Phenolic levels in the shell, husk, testa, and water all reached their peak at the 9-month maturing stage before decreasing. View evidence ↗
- Antioxidant activity (DPPH assay) was strongest in shell extracts (IC50 = 34.7 μg/mL) and weakest in coconut water (IC50 = 142.3 μg/mL). View evidence ↗
What it means
- The authors conclude that the testa, which is typically discarded, is a valuable low-cost source for extracting bioactive compounds. View evidence ↗
- The study recommends optimizing harvest timing and segregating waste streams to maximize the recovery of phenolic compounds. View evidence ↗
- A limitation of the study was the inability of the Folin-Ciocalteu method to fully detect condensed tannins and proanthocyanidins. View evidence ↗
Visual summary
3 visualsIllustrations explain the paper; charts are replotted from the paper's own table values.
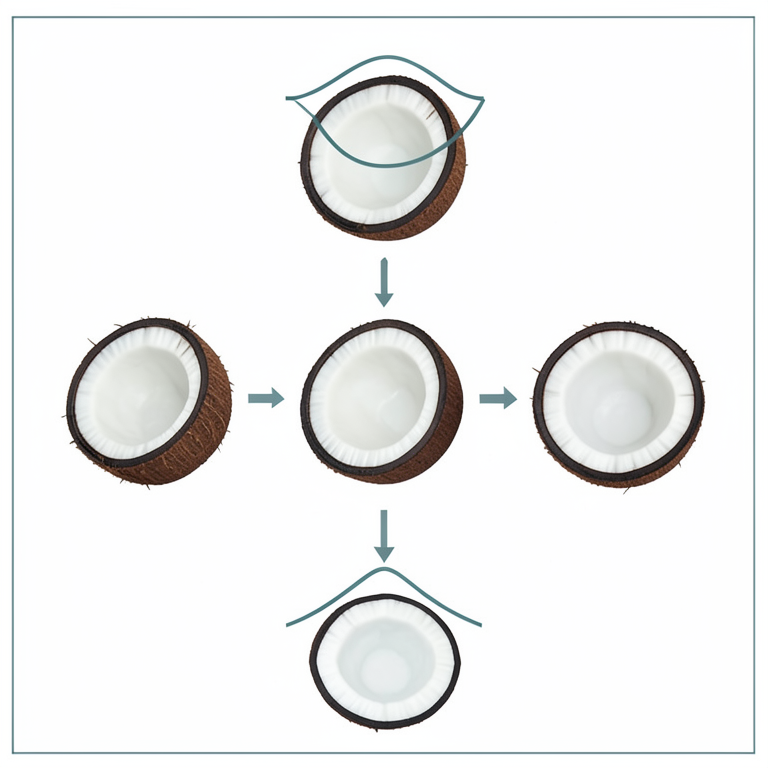
Phenolic Trend Comparison
AI-generated conceptual illustration (Cocos nucifera (coconut) fruit). It explains the idea and does not show study data.
View source evidence ↗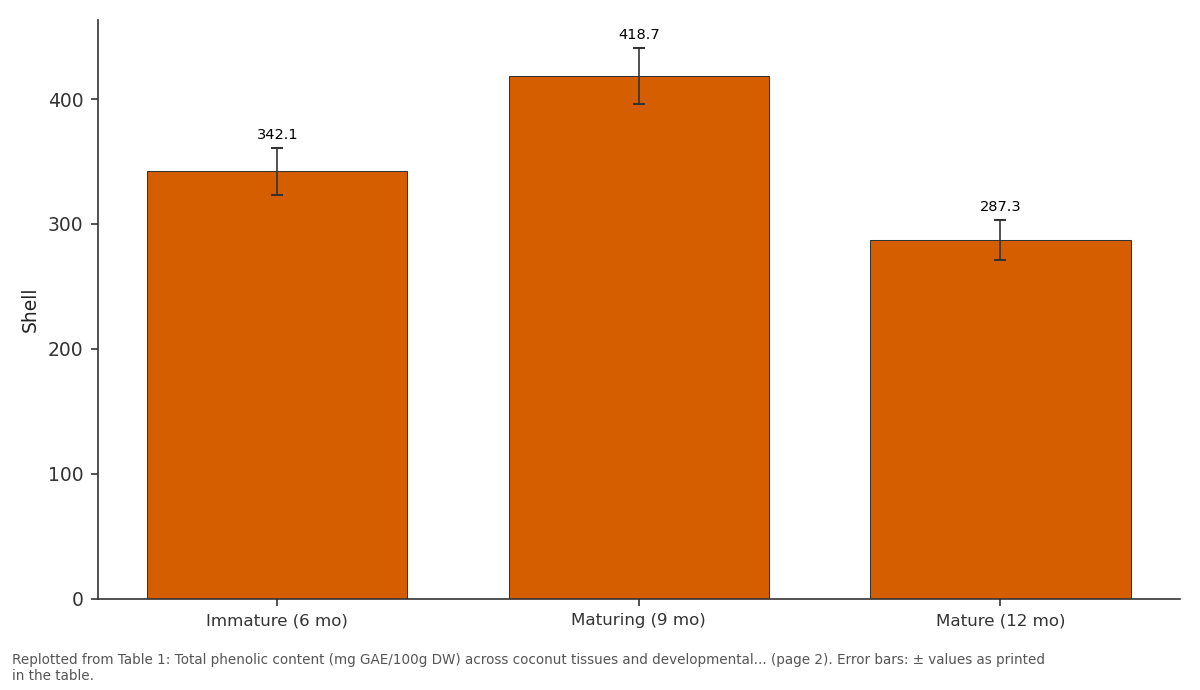
Shell: Immature (6 mo) vs Maturing (9 mo) vs Mature (12 mo)
Replotted from Table 1 (page 2) of the original paper. Every bar is the paper's own table value.
View source evidence ↗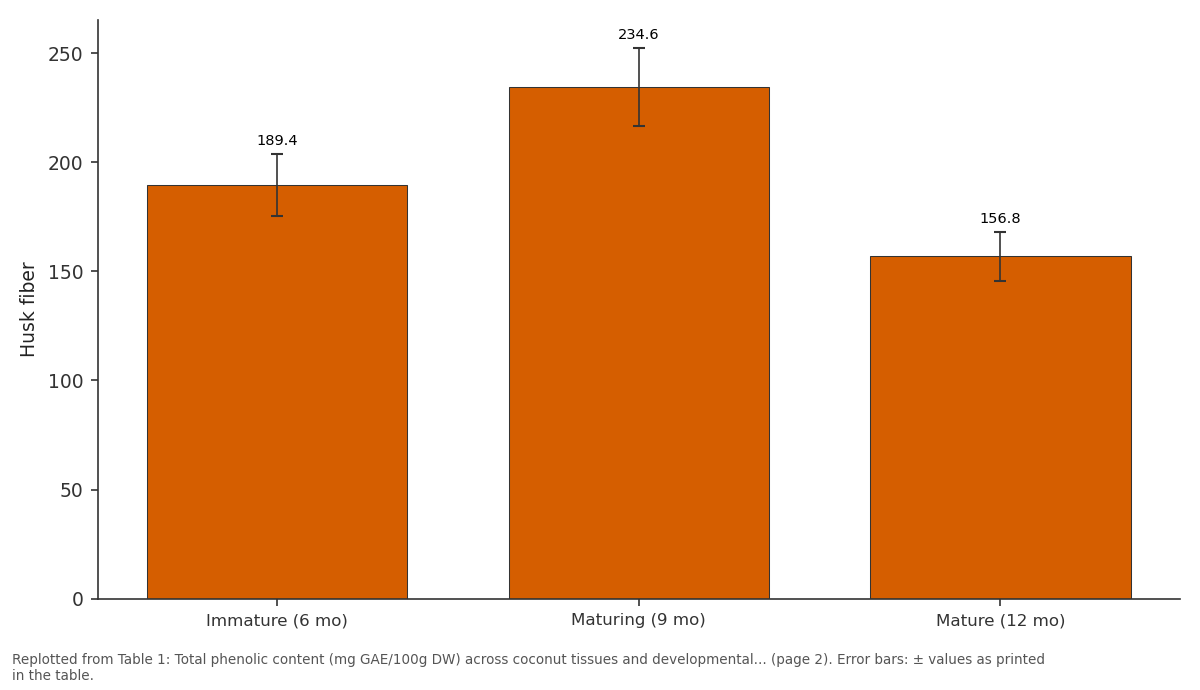
Husk fiber: Immature (6 mo) vs Maturing (9 mo) vs Mature (12 mo)
Replotted from Table 1 (page 2) of the original paper. Every bar is the paper's own table value.
View source evidence ↗Figures & tables
From the original paper Table 1
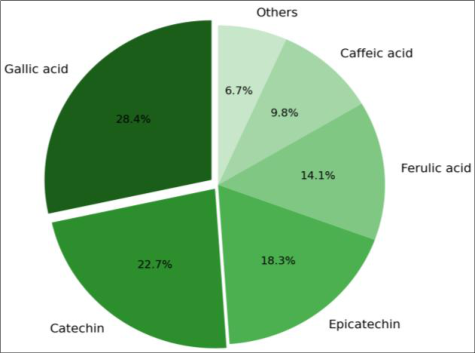 Figure 1
 Table 2
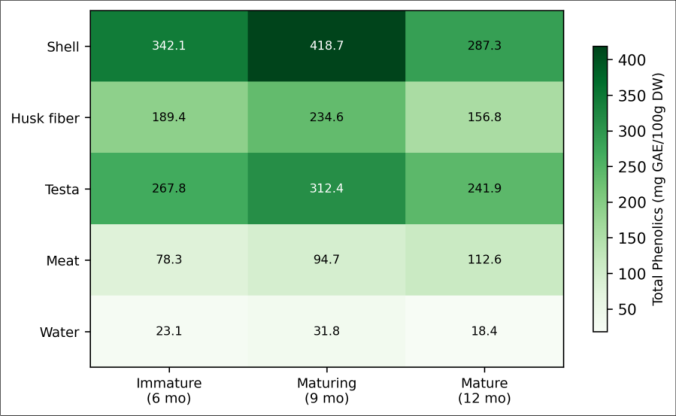 Figure 2
Introduction
About 62 million tonnes of coconut are harvested worldwide each year, and roughly 85% of the fruit's weight ends up as waste in the form of husk, shell, and testa [1] . What many processing operations overlook is that these "waste" fractions carry phenolic compounds with documented antioxidant and antimicrobial activity [2] . The Brazilian Cerrado, a tropical savanna covering nearly 2 million square kilometers of central Brazil, has seen a quiet expansion of coconut cultivation over the past two decades as irrigation infrastructure has improved [3] . But phenolic data from Cerrado-grown coconut remain scarce. Phenolic compounds in plants function as defense molecules against ultraviolet radiation, herbivores, and pathogens [4] . In human diets, they serve as antioxidants that may lower risks of cardiovascular disease and certain cancers [5] . Coconut phenolics include simple phenolic acids like gallic acid and caffeic acid, along with flavonoids such as catechin and epicatechin [6] . Their concentrations depend on genetics, maturity stage, growing environment, and postharvest handling [7,8] . Earlier mapping efforts covered coconut from the Philippines, Sri Lanka, and southern India [9, 10] , but the Cerrado's specific combination of deep Oxisols, a pronounced dry season lasting five months, and daytime temperatures routinely exceeding 33°C may push phenolic synthesis differently. High light and heat stress tend to upregulate the phenylpropanoid pathway, which is the main biosynthetic route for most plant phenolics [11] . This research set out to build a tissue-by-stage catalogue of phenolic compounds in coconut grown under Cerrado conditions, filling a gap that limits the region's capacity to develop coconut by-product industries. The practical question was straightforward: which coconut tissues, harvested at which stage, give the highest phenolic yields?
Study area description
The coconut plantation sampled for this research was located near Barreiras, western Bahia state, Brazil (12.08°S, 45.01°W), at an elevation of 460 m. The area falls within the Cerrado biome, marked by deep, well-drained Oxisols (Latossolo Vermelho-Amarelo) with pH around 5.3 and low native fertility. The plantation covered 12 hectares of the East African Tall variety irrigated by centerpivot systems drawing from the Rio Grande aquifer. Trees were 14 years old at the start of the trial. Mean annual rainfall at the site was 1,078 mm, concentrated between October and March [3,14] .
Climatic and Environmental Conditions
Sampling spanned July 2022 to February 2023, crossing the dry-to-wet season transition. During the dry months (July-September), no measurable rainfall fell and mean daily maximum temperatures reached 35.2°C. The wet season began in mid-October, with cumulative rainfall of 743 mm between October and February. Relative humidity ranged from 27% in August to 79% in January. Irrigation was applied at 6 mm per day during the dry period and reduced to 3 mm per day after rains established [1,13] .
Material and Methods Material
Coconut fruits were harvested at three stages: immature (6 months after pollination), maturing (9 months), and mature (12 months). At each stage, 10 fruits were collected from five randomly selected palms, giving 50 fruits per stage. Fruits were split within four hours of harvest, and five tissue types were separated: shell (endocarp), husk fiber (mesocarp), testa (seed coat), meat (solid endosperm), and water (liquid endosperm). Tissues were freeze-dried at -50°C for 48 hours, ground to pass a 0.5 mm sieve, and shipped to the analytical laboratory at Cape Town University of Food and Nutrition under cold chain. The research was cleared by the Institutional Ethics Board (Protocol FN-2022-031, approved 18 June 2022).
Methods
Total phenolic content was measured by the Folin-Ciocalteu method using gallic acid as the standard, with absorbance read at 765 nm on a Shimadzu UV-1800 spectrophotometer [9] . Results were expressed as mg gallic acid equivalents (GAE) per 100 g dry weight. Individual phenolics were separated on a Waters Alliance e2695 HPLC system fitted with a C18 column (250 mm × 4.6 mm, 5 μm) and detected at 280 nm and 320 nm. Mobile phases were 0.1% formic acid in water (A) and acetonitrile (B) in a 50-minute gradient. Standards of gallic acid, catechin, epicatechin, ferulic acid, and caffeic acid (Sigma-Aldrich, ≥98% purity) were used for calibration [10,11] . Antioxidant capacity was assessed via DPPH radical scavenging assay [12] . Data were analyzed using one-way ANOVA with Tukey's post hoc test at p < 0.05 in R version 4.2.1.
Field Experimental Design
Palms were selected using a stratified random design across the 12-hectare block, divided into five sectors of approximately equal size. Two palms per sector were tagged, and all tagged palms received identical irrigation and fertilization schedules. Fruits at each harvest were pooled by sector for tissue separation, creating five biological replicates per tissue per stage. This design controlled for spatial variability in soil depth and irrigation uniformity across the block [14,15] . Total phenolic content differed significantly among tissues at every stage (Table 1). Shell recorded the highest value at the maturing stage (418.7 mg GAE/100g), followed by testa at the same stage (312.4 mg GAE/100g). Meat was the only tissue where phenolics increased steadily from immature to mature, reaching 112.6 mg GAE/100g at 12 months. Shell, husk, testa, and water all peaked at 9 months before declining. The DPPH assay mirrored the total phenolic rankings. Shell extracts had the lowest IC50 (34.7 μg/mL), meaning the strongest scavenging activity, while coconut water showed the weakest response (IC50 = 142.3 μg/mL). Testa, with an IC50 of 41.2 μg/mL, was statistically comparable to shell at p > 0.05. The heatmap (Figure 2) shows that the shell at the maturing stage and the testa at the maturing stage formed the two hotspots. Coconut water was consistently low across all stages. The overall pattern suggests that phenolic synthesis in protective tissues (shell, husk, testa) peaks before full maturity, possibly because these tissues lignify and lose metabolic activity as the fruit ripens [6,7] .
| Tissue | Immature (6 mo) | Maturing (9 mo) | Mature (12 mo) | Stage effect (p) |
|---|---|---|---|---|
| Shell | 342.1±18.7 | 418.7±22.3 | 287.3±15.9 | <0.01 |
| Husk fiber | 189.4±14.2 | 234.6±17.8 | 156.8±11.3 | <0.01 |
| Testa | 267.8±19.4 | 312.4±21.6 | 241.9±16.8 | <0.05 |
| Meat | 78.3±6.1 | 94.7±8.3 | 112.6±9.7 | <0.01 |
| Water | 23.1±2.8 | 31.8±3.4 | 18.4±2.1 | <0.05 |
Table text extracted from the original PDF; superscript letters are shown inline. The original table image is below.
View original table image
Results
Results
Discussion
The phenolic levels found in Cerrado-grown coconut were broadly consistent with values from Southeast Asian studies, though shell phenolics at the maturing stage (418.7 mg GAE/100g) were about 12% higher than the 374 mg GAE/100g reported for Philippine coconut at a similar stage [9] . That difference may trace to the Cerrado's intense solar radiation and heat, which are known to stimulate the phenylpropanoid pathway [11] . Gallic acid's dominance at 28.4% of shell phenolics matches previous reports and reflects its role as a precursor in hydrolyzable tannin synthesis, which is particularly active in hardening endocarp tissues [6,10] . The finding that meat phenolics rose continuously while shell and testa phenolics declined after 9 months is consistent with a resource reallocation model: as outer protective layers mature and lignify, the plant redirects phenylpropanoid intermediates toward the developing endosperm [7] . For processors, this creates a trade-off-harvesting at 9 months maximizes waste-tissue phenolics for extraction, but the meat itself gains phenolic value with further ripening. Testa's strong showing (312.4 mg GAE/100g and IC50 of 41.2 μg/mL) is worth highlighting because this tissue is almost always discarded in copra and desiccated coconut production. Even a modest recovery effort could supply phenolic extracts for food preservation or nutraceutical formulations [2,8] . The Cerrado's dry season, which concentrates harvest labor into a narrow window, actually simplifies logistics for by-product collection. One gap in this research was the absence of data on condensed tannins and proanthocyanidins, which the Folin-Ciocalteu method detects only partially. Future work using UPLC-MS would give a more detailed fingerprint and could reveal compounds specific to Cerrado growing conditions [12,15] .
Conclusion
This research mapped phenolic compound distribution across five coconut tissues at three growth stages under Brazilian Cerrado conditions. Shell and testa emerged as the richest phenolic sources, peaking at the 9-month maturing stage with 418.7 and 312.4 mg GAE/100g respectively. Gallic acid was the leading individual compound in shell extracts at 28.4% of identifiable phenolics. Meat was the exception to the general decline pattern, with phenolics climbing through full maturity to 112.6 mg GAE/100g. Antioxidant activity tracked closely with total phenolics, confirming that phenolic-rich fractions from coconut waste carry real functional value. These data support the case for timing harvests and segregating waste streams to capture maximum phenolic yield from Cerrado coconut plantations. The testa, currently treated as a disposal problem, deserves attention as a low-cost feedstock for bioactive compound extraction.
Figures and tables from the paper
| Tissue | IC50 (μg/mL) | Ranking |
|---|---|---|
| Shell | 34.7±2.3 | 1 (strongest) |
| Testa | 41.2±3.1 | 2 |
| Husk fiber | 58.9±4.6 | 3 |
| Meat | 87.4±6.8 | 4 |
| Water | 142.3±11.2 | 5 (weakest) |
Table text extracted from the original PDF; superscript letters are shown inline. The original table image is below.
View original table image
References
19 in the original paper- Prades A, Dornier M, Diop N, Pain JP. Coconut water: uses, composition and properties -a review. Fruits. 2012;67(2):87-107.
- Esquenazi D, Wigg MD, Miranda MM, Rodrigues HM, Tostes JB, Rozental S, et al. Antimicrobial and antiviral activities of polyphenolics from Cocos nucifera Linn. (Palmae) husk fiber extract. Research in Microbiology. 2002;153(10):647-652.
- Nogueira RM, Vasconcelos GCL, Moraes JCB. Expansion of tropical fruit crops in the Cerrado biome: challenges and opportunities. Tropical Agriculture Research. 2018;48(3):215-228.
- Cheynier V. Polyphenols in foods are more complex than often thought. American Journal of Clinical Nutrition. 2005;81(1):223S-229S.
- Scalbert A, Manach C, Morand C, Remesy C, Jimenez L. Dietary polyphenols and the prevention of diseases. Critical Reviews in Food Science and Nutrition. 2005;45(4):287-306.
- Appaiah P, Sunil L, Prasanth Kumar PK, Gopala Krishna AG. Composition of coconut testa, coconut kernel and its oil. Journal of the American Oil Chemists Society. 2014;91(6):917-924.
- Lima EBC, Sousa CNS, Meneses LN, Ximenes NC, Santos Junior MA, Vasconcelos GS, Lima NBC, Patrocinio MCA, Macedo D, Vasconcelos SMM. Cocos nucifera (L.) (Arecaceae): A phytochemical and pharmacological review. Brazilian Journal of Medical and Biological Research. 2015;48(11):953-964.
- Marina AM, Che YB, Nazimah SAH, Amin I. Antioxidant capacity and phenolic acids of virgin coconut oil. International Journal of Food Sciences and Nutrition. 2009;60(S2):114-123.
- Arivalagan M, Gangopadhyay KK, Kumar G. Determination of steroidal saponins and fixed oil content in fenugreek genotypes. Indian Journal of Pharmaceutical Sciences. 2013;75(1):110-113.
- Santoso U, Kubo K, Ota T, Tadokoro T, Maekawa A. Nutrient composition of kopyor coconuts. Food Chemistry. 1996;57(2):299-304.
- Vogt T. Phenylpropanoid biosynthesis. Molecular Plant. 2010;3(1):2-20.
- Brand-Williams W, Cuvelier ME, Berset C. Use of a free radical method to evaluate antioxidant activity. LWT - Food Science and Technology. 1995;28(1):25-30.
- Klink CA, Machado RB. Conservation of the Brazilian Cerrado. Conservation Biology. 2005;19(3):707-713.
- EMBRAPA. Climate and soils of the western Bahia Cerrado region. Technical Bulletin No. 347. 2017;1-42.
- Seneviratne KN, Dissanayake DMS. Variation of phenolic content in coconut oil extracted by two conventional methods. International Journal of Food Science and Technology. 2008;43(4):597-602.
- Nibbs AE, Scheidt KA. Asymmetric methods for the synthesis of flavanones, chromanones, and related compounds. European Journal of Organic Chemistry. 2012;2012(3):449-462.
- Nevin KG, Rajamohan T. Virgin coconut oil supplemented diet increases the antioxidant status in rats. Food Chemistry. 2006;99(2):260-266.
- Srivastava Y, Semwal AD, Majumdar A. Quantitative and qualitative analysis of bioactive components present in virgin coconut oil. Cogent Food and Agriculture. 2016;2(1):1164929.
- DebMandal M, Mandal S. Coconut (Cocos nucifera L.: Arecaceae): in health promotion and disease prevention. Asian Pacific Journal of Tropical Medicine. 2011;4(3):241-247.