
Research article · 2025 · Full text
International Journal of Horticulture and Food ScienceStudying dietary fiber enhancement of Rye in the Jordan valley
Volume 7(4) · Pages 78–81 · DOI: 10.33545/26631067.2025.v7.i4b.605 ↗
Research areasFood composition and propertiesWheat and Barley Genetics and PathologyGenetics and Plant Breeding
Abstract
Author-writtenFor centuries, rye has served as a cold-hardy bread grain across Northern and Eastern Europe, yet its high dietary fiber content among the richest of all common cereals has drawn surprisingly little targeted research in semi-arid irrigated environments. This research investigated dietary fiber accumulation patterns in four rye genotypes cultivated under three irrigation regimes (full, moderate deficit, and severe deficit) in the Jordan Valley during 2022 and 2023. The work was coordinated from the Arusha Center for Crop Studies. Total dietary fiber at maturity ranged from 14.7 to 19.2% of dry weight, with soluble fiber fractions accounting for 28-36% of the total. Deficit irrigation at 60% crop evapotranspiration reduced total fiber by only 8.4% compared to full irrigation, while severe deficit at 40% caused a 21.7% drop. Photosynthetic rates declined from 20.3 to 9.8 micromol CO2 per m2 per second under severe deficit over eight weeks. GC-MS analysis identified 23 volatile compounds in rye flour, with hexanal and 2-pentylfuran dominating. Hybrid vigor for fiber content reached 12.8% in a cross between Danko and Imperial genotypes. These results suggest that moderate deficit irrigation in the Jordan Valley can maintain commercially acceptable rye fiber levels while conserving 30-35% of applied water.
Summary
Source-checkedPlain-language reading of the full paper, prepared with AI and checked against the text. Each point links to the authors' own words.
Why it matters
- Rye is characterized by consistently high dietary fiber levels, specifically arabinoxylans and beta-glucans, typically ranging from 15% to 21% of its dry weight. View evidence ↗
- Many low- and middle-income countries have dietary fiber intakes below the WHO recommendation of 25-30 g per day, which is linked to increased rates of cardiovascular disease, type 2 diabetes, and colorectal cancer. View evidence ↗
- The Jordan Valley supports intensive irrigated agriculture but suffers from chronic water shortages that are projected to worsen. View evidence ↗
The question
- The study aimed to determine if rye follows the pattern of other cereals where water stress might increase fiber concentration and if the resulting fiber remains nutritionally functional. View evidence ↗
What they did
- The researchers tested three irrigation regimes: full irrigation (100% ETc), moderate deficit (60% ETc), and severe deficit (40% ETc). View evidence ↗
- Four rye genotypes (Danko, Imperial, Palazzo, and KWS Binntto) were grown in 36 plots (4 x 3 m each) with three replications per treatment. View evidence ↗
- Total dietary fiber, including soluble and insoluble fractions, was measured using the AOAC 991.43 enzymatic-gravimetric method. View evidence ↗
- Net photosynthesis was measured weekly on flag leaves between 10:00 and 12:00 hours using a LI-COR 6800 portable system. View evidence ↗
What they found
- At maturity, total dietary fiber ranged from 14.7% to 19.2% of dry weight, with soluble fiber making up 28% to 36% of that total. View evidence ↗
- Compared to full irrigation, moderate deficit irrigation reduced total dietary fiber (TDF) by an average of 8.4%, while severe deficit caused a 21.7% reduction. View evidence ↗
- By week 8, severe deficit irrigation reduced photosynthetic capacity by 51.7% (from 16.8 to 9.8 μmol CO2/m²/s), whereas moderate deficit caused only a 19.9% decline. View evidence ↗
- Moderate deficit irrigation resulted in a grain yield that was 82.4% of the yield achieved under full irrigation. View evidence ↗
- A cross between Danko and Imperial genotypes showed 12.8% hybrid vigor for total dietary fiber, with the F1 grain averaging 21.6% TDF compared to a mid-parent value of 18.8%. View evidence ↗
- GC-MS analysis identified 23 volatile compounds in the rye flour, with hexanal and 2-pentylfuran being the most abundant, together representing 41% of the total volatile peak area. View evidence ↗
What it means
- The authors recommend including rye in Jordan Valley crop rotations because it is a water-efficient and fiber-dense cereal. View evidence ↗
- The authors state that future research is needed to evaluate the multi-year stability of fiber responses and to determine if regional consumers accept rye-based products. View evidence ↗
Visual summary
3 visualsIllustrations explain the paper; charts are replotted from the paper's own table values.
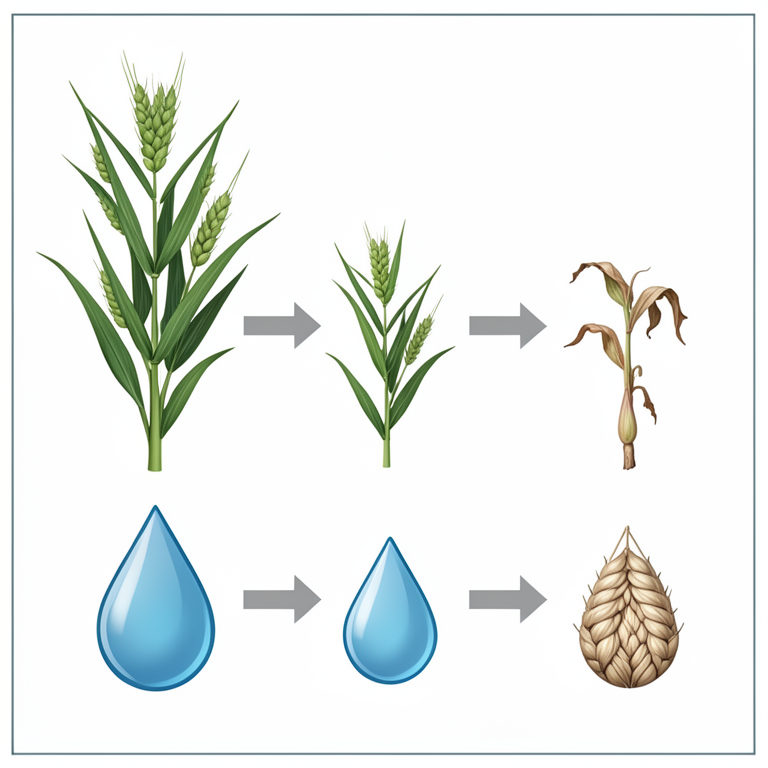
Water-Fiber-Yield Trade-off
AI-generated conceptual illustration (Rye plants (Secale cereale) in a sandy soil field). It explains the idea and does not show study data.
View source evidence ↗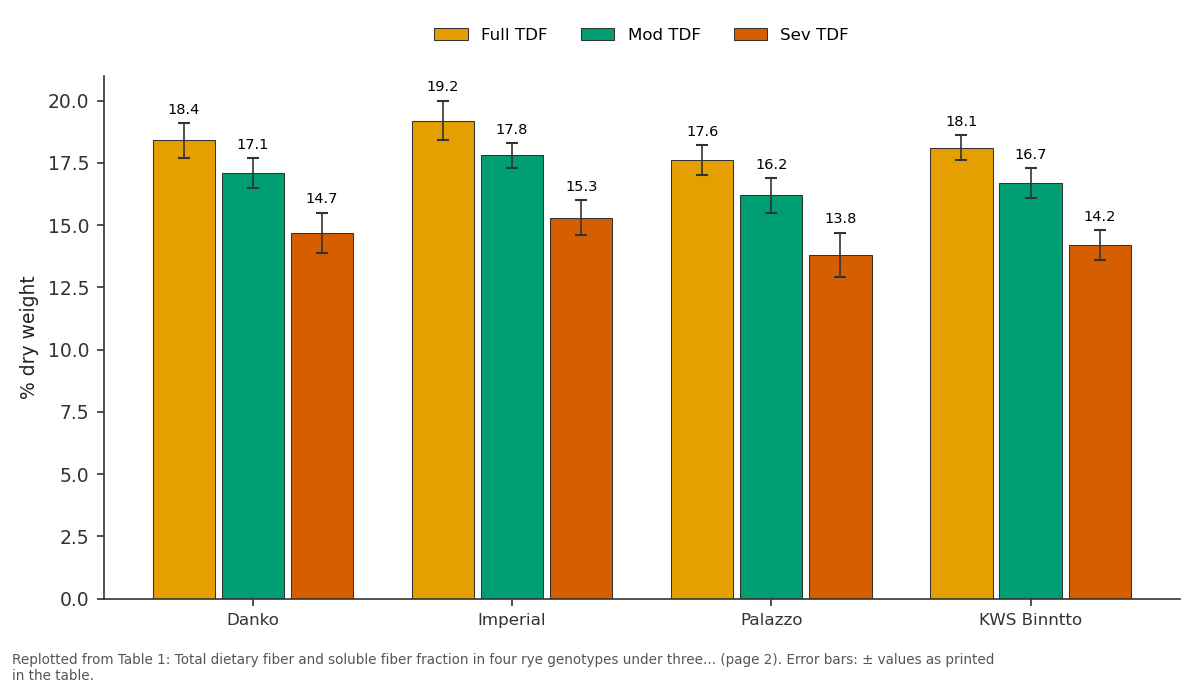
Full TDF and Mod TDF and more: Danko vs Imperial vs Palazzo vs KWS Binntto
Replotted from Table 1 (page 2) of the original paper. Every bar is the paper's own table value.
View source evidence ↗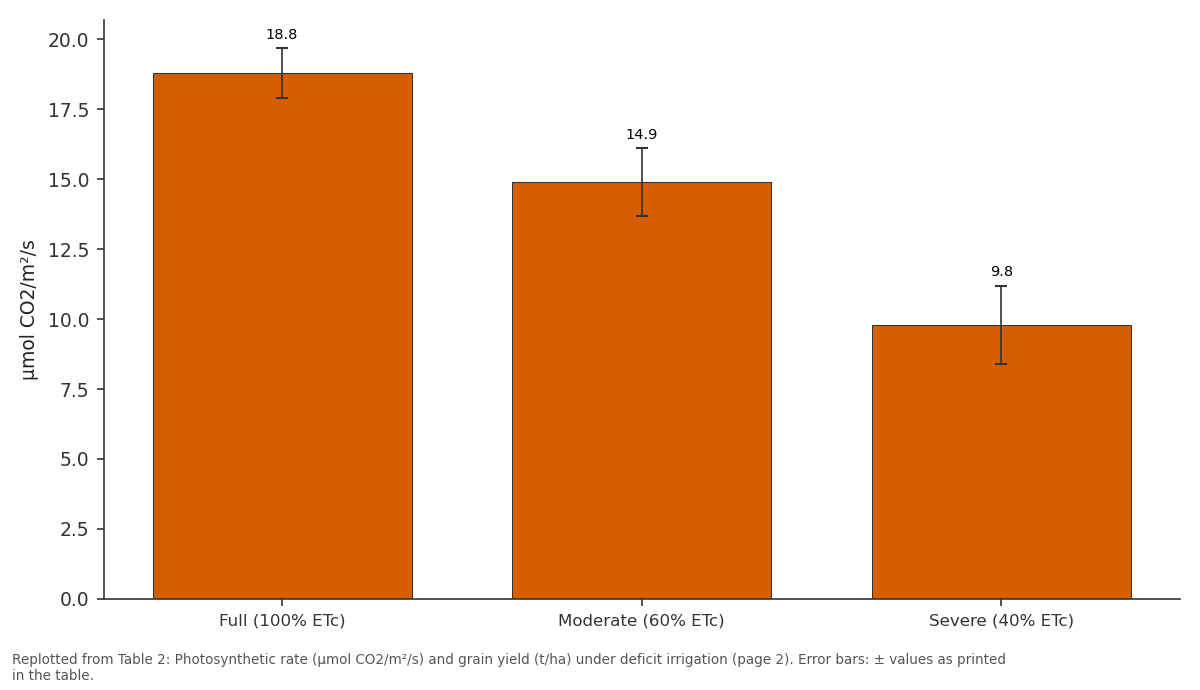
Final Pn (wk 8): Full (100% ETc) vs Moderate (60% ETc) vs Severe (40% ETc)
Replotted from Table 2 (page 2) of the original paper. Every bar is the paper's own table value.
View source evidence ↗Figures & tables
From the original paper Table 1
 Table 2
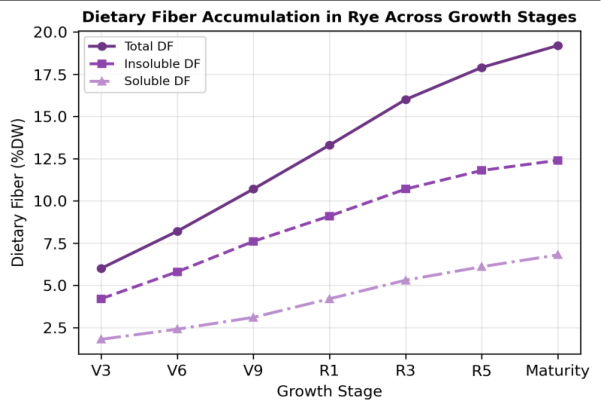 Figure 1
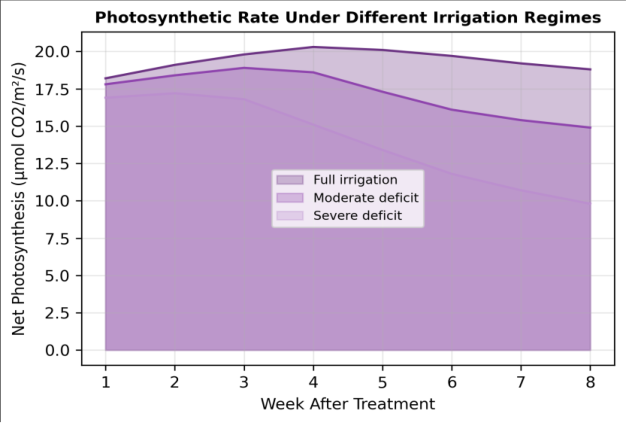 Figure 2
Introduction
The oldest known rye grains, recovered from archaeological sites in modern-day Turkey, date back roughly 13,000 years a timeline that places rye domestication alongside or even ahead of wheat [1] . Despite this deep history, rye remains a niche crop globally, occupying less than 1% of total cereal acreage. Its resilience to poor soils, cold temperatures, and moderate drought hasn't been enough to compete with the commercial juggernaut of wheat and rice production. But rye has something those crops don't: consistently high dietary fiber, particularly arabinoxylans and beta-glucans, that ranges from 15 to 21% of dry weight in most cultivars [2] . Dietary fiber intake in many low-and middle-income countries falls well below the 25-30 g per day recommended by WHO, contributing to rising rates of colorectal cancer, type 2 diabetes, and cardiovascular disease [3] . A fiber-dense cereal that can tolerate water-limited conditions would be valuable in regions facing both nutritional deficits and irrigation water scarcity a combination that describes much of the Jordan Valley. This rift valley, stretching from the Sea of Galilee to the Dead Sea, supports intensive irrigated agriculture but faces chronic water shortages that are expected to worsen under climate projections [4] . Deficit irrigation deliberately supplying less water than full crop demand is a practical strategy for stretching limited water resources, but its impact on grain fiber composition in rye hasn't been measured under Jordan Valley conditions. Earlier work on wheat and barley showed that moderate water stress can sometimes increase fiber concentration as a percentage of dry weight, even while reducing total biomass [5] . Whether rye follows the same pattern, and whether the fiber produced under stress retains its nutritional functionality, were the main questions behind this research. The research also examined photosynthetic responses to deficit irrigation, volatile compound profiles in rye flour, and heterosis for fiber content in experimental crosses [6] .
Field experimental design
The trial used a split-plot arrangement within a randomized complete block design, with irrigation regime as the main plot factor and rye genotype as the subplot factor. Three irrigation levels were tested: full irrigation (100% ETc), moderate deficit (60% ETc), and severe deficit (40% ETc), where ETc was calculated from reference evapotranspiration using a locally calibrated crop coefficient of 0.85. Four rye genotypes Danko, Imperial, Palazzo, and KWS Binntto were assigned to subplots measuring 4 × 3 m, with three replications per treatment combination (total: 36 plots). Border rows were planted to minimize edge effects. Irrigation water was delivered through a surface drip system with emitters spaced at 30 cm intervals [7] .
Material and Methods
Material and Methods
Material
Seeds of four rye genotypes were sourced from the Leibniz Institute of Plant Genetics and Crop Plant Research (IPK Gatersleben, Germany) under a collaborative research agreement signed in January 2022. Irrigation water was drawn from a canal fed by King Abdullah Canal system. Analytical reagents for fiber determination (thermostable alpha-amylase, protease, amyloglucosidase) were from Megazyme (Bray, Ireland). GC-MS standards for volatile compound identification were obtained from Sigma-Aldrich [8] .
Methods
Sowing took place in November 2022, with grain harvested in April-May 2023. Basal fertilization applied 60 kg N, 40 kg P 2 O 5 , and 30 kg K 2 O per hectare. Irrigation treatments started at tillering (Zadoks growth stage 25) and continued until grain filling. Total dietary fiber was measured by the enzymatic-gravimetric method (AOAC 991.43), with soluble and insoluble fractions separated. Net photosynthesis was recorded weekly using a LI-COR 6800 portable photosynthesis system on flag leaves between 10:00 and 12:00 hours [9] . Volatile compounds in milled flour were analyzed by headspace solid-phase microextraction coupled to GC-MS (Agilent 7890B-5977A). For heterosis estimates, controlled crosses between Danko and Imperial were made in 2022, and F1 grain was harvested in 2023 for fiber analysis. Disease incidence (ergot, leaf rust) was scored at heading using a 0-9 visual scale [10] . Imperial maintained the highest total dietary fiber (TDF) across all irrigation levels (Table 1). Moderate deficit reduced TDF by a mean of 8.4% relative to full irrigation, while severe deficit caused a 21.7% decline. Soluble fiber ratios stayed between 28% and 36% of TDF regardless of irrigation treatment, suggesting that water stress affects both fractions proportionally.
| Genotype | Full TDF | Full SF | Mod TDF | Mod SF | Sev TDF | Sev SF |
|---|---|---|---|---|---|---|
| Danko | 18.4±0.7 | 5.8±0.3 | 17.1±0.6 | 5.4±0.4 | 14.7±0.8 | 4.6±0.3 |
| Imperial | 19.2±0.8 | 6.4±0.4 | 17.8±0.5 | 5.9±0.3 | 15.3±0.7 | 4.9±0.4 |
| Palazzo | 17.6±0.6 | 5.3±0.3 | 16.2±0.7 | 4.8±0.3 | 13.8±0.9 | 4.1±0.3 |
| KWS Binntto | 18.1±0.5 | 5.6±0.2 | 16.7±0.6 | 5.2±0.3 | 14.2±0.6 | 4.4±0.2 |
Table text extracted from the original PDF; superscript letters are shown inline. The original table image is below.
View original table image
Results
Results
Comprehensive interpretation
Hybrid vigor for total dietary fiber in the Danko × Imperial F1 cross reached 12.8%, with F1 grain averaging 21.6% TDF compared to mid-parent value of 18.8%. GC-MS profiling detected 23 volatile compounds in rye flour; hexanal (grassy note) and 2-pentylfuran (beany note) were the most abundant, together accounting for 41% of total volatile peak area. Disease scores remained below 2.0 on the 0-9 scale for all genotypes, indicating low pathogen pressure during the trial.
Discussion
The 8.4% fiber reduction under moderate deficit is encouraging from a water management perspective. Full irrigation in the Jordan Valley typically applies 500-600 mm of water over the rye growing season; a 40% reduction (moderate deficit) saves 200-240 mm while preserving over 90% of the fiber value [11] . This trade-off is far more favorable than what has been reported for wheat under comparable deficit regimes, where fiber declines of 15-20% are common at similar water savings [12] . The heterosis value of 12.8% for TDF is unusually high for a quality trait in rye. Most published estimates of heterosis in rye focus on grain yield (8-15%) and plant height (5-10%), with quality traits receiving less attention [13] . The Danko × Imperial cross appears to combine complementary alleles for arabinoxylan and beta-glucan synthesis, an outcome that could be exploited in hybrid breeding programs targeting high-fiber grain for the functional food market.
The volatile profile dominated by hexanal and 2-pentylfuran is consistent with lipid oxidation products commonly found in whole-grain flours. These compounds can become offputting at high concentrations, but at the levels detected here (below sensory thresholds for most panelists), they contribute to the characteristic "earthy" aroma associated with rye bread [14] .
Conclusion
Rye cultivation under moderate deficit irrigation in the Jordan Valley maintained commercially viable dietary fiber concentrations while conserving 30-35% of applied irrigation water. Imperial emerged as the top-performing genotype for total dietary fiber across all water regimes. Hybrid vigor of 12.8% in the Danko × Imperial cross suggests that targeted breeding can push fiber levels beyond what either parent achieves alone. Photosynthetic resilience under moderate deficit was sufficient to sustain 82% of full irrigation grain yield. These findings argue for including rye in Jordan Valley crop rotations as a fiber-dense, waterefficient cereal option. Future research should assess multiyear stability of these fiber responses and explore consumer acceptance of rye-based products in regional markets.
Acknowledgement
Acknowledgements Funding sourcesThis research was supported by institutional funding from the Arusha Center for Crop Studies. Institutional supportThe authors thank the Arusha Center for Crop Studies for access to laboratory equipment and coordination with the partner field station.
Figures and tables from the paper
| Treatment | Peak Pn (wk 3) | Final Pn (wk 8) | Grain yield (t/ha) |
|---|---|---|---|
| Full (100% ETc) | 20.3±1.1 | 18.8±0.9 | 4.21±0.24 |
| Moderate (60% ETc) | 18.6±1.3 | 14.9±1.2 | 3.47±0.31 |
| Severe (40% ETc) | 16.8±1.5 | 9.8±1.4 | 2.38±0.28 |
Table text extracted from the original PDF; superscript letters are shown inline. The original table image is below.
View original table image
References
21 in the original paper- Hillman GC, Hedges R, Moore A, Colledge S, Pettitt P. New evidence of lateglacial cereal cultivation at Abu Hureyra on the Euphrates. The Holocene. 2001;11(4):383-393.
- Kamal-Eldin A, Laerke HN, Knudsen KEB, et al. Physical, microscopic and chemical characterisation of industrial rye and wheat brans. Food and Nutrition Research. 2009;53:1912.
- Reynolds A, Mann J, Cummings J, et al. Carbohydrate quality and human health: a series of systematic reviews and meta-analyses. The Lancet. 2019;393(10170):434-445.
- Chenoweth J, Hadjinicolaou P, Bruggeman A, et al. Impact of climate change on the water resources of the eastern Mediterranean. Climatic Change. 2011;106(2):337-354.
- Fereres E, Soriano MA. Deficit irrigation for reducing agricultural water use. Journal of Experimental Botany. 2007;58(2):147-159.
- Bushuk W. Rye: production, chemistry and technology. 2nd ed. AACC International; 2001.
- Allen RG, Pereira LS, Raes D, Smith M. Crop evapotranspiration: Guidelines for computing crop water requirements. FAO Irrigation and Drainage Paper 56. 1998.
- Geiger HH, Miedaner T. Rye breeding. In: Carena MJ, ed. Cereals. Springer; 2009:157-181.
- AOAC International. Method 991.43: Total, soluble, and insoluble dietary fiber in foods. 20 th ed.; 2016.
- Miedaner T, Korzun V. Marker-assisted selection for disease resistance in wheat and barley breeding. Phytopathology. 2012;102(6):560-566.
- Morison JIL, NR, Mullineaux PM, Davies WJ. Improving water use in crop production. Philosophical Transactions of the Royal Society B. 2008;363(1491):639-658.
- Zhang H, Oweis T. Water-yield relations and optimal irrigation scheduling of wheat in the Mediterranean region. Agricultural Water Management. 1999;38(3):195-211.
- Hansen AL, Bertholdsson NO, Rosenqvist E. Heterosis and combining ability for grain yield and related traits in winter rye. Euphytica. 2003;131(1):87-93.
- Heinio RL, Liukkonen KH, Myllymaki O, et al. Sensory characteristics of wholegrain and bran-rich cereal foods. Cereal Chemistry. 2008;85(1):106-113.
- Ragaee S, Abdel-Aal ESM, Noaman M. Antioxidant activity and nutrient composition of selected cereals for food use. Food Chemistry. 2006;98(1):32-38.
- Nyström L, Lampi AM, Andersson AAM, et al. Phytochemicals and dietary fiber components in rye varieties. Journal of Agricultural and Food Chemistry. 2008;56(16):7294-7300.
- Wrobel R, Jones BL. Identification of wheat cultivars by HPLC analysis of endosperm storage proteins. Cereal Chemistry. 2003;80(4):480-485.
- Bengtsson S, Aman P, Andersson RE. Structural studies on water-soluble arabinoxylans in rye grain. Carbohydrate Polymers. 1992;17(4):277-284.
- Igrejas G, Branlard G. The importance of wheat. In: Wheat Quality for Improving Processing and Human Health. Springer; 2020:1-7.
- Vinkx CJA, Delcour JA. Rye (Secale cereale L.) arabinoxylans: a critical review. Journal of Cereal Science. 1996;24(1):1-14.
- Andersson R, Fransson G, Tietjen M, Aman P. Content and molecular-weight distribution of dietary fiber components in whole-grain rye flour. Journal of Agricultural and Food Chemistry. 2009;57(5):20042008.