
Research article · 2025 · Full text
International Journal of Horticulture and Food ScienceInvestigating fermentation dynamics of tea in the Peruvian Altiplano
Volume 7(1) · Pages 209–212 · DOI: 10.33545/26631067.2025.v7.i1d.553 ↗
Research areasFermentation and Sensory AnalysisTea Polyphenols and EffectsProbiotics and Fermented Foods
Abstract
Author-writtenWhat defines the point where tea fermentation shifts from building desirable flavor compounds to breaking them down? This research tracked the biochemical dynamics of black tea fermentation using fresh leaf from Camellia sinensis var. assamica grown at 2,340 m elevation in the Peruvian Altiplano. Withered leaves were fermented for 0 to 8 hours under controlled conditions (28°C, 92% RH), with samples pulled every hour for analysis of theaflavins, thearubigins, total polyphenols, pH, dissolved oxygen, and color values. Theaflavin content peaked at 4 hours (3.71% DW), then declined by 8.3% over the remaining fermentation period. Thearubigins rose continuously, reaching 18.14% DW at 8 hours. The theaflavin-to-thearubigin ratio, a standard quality marker, hit its optimal range of 1:10 to 1:12 between 3.5 and 4.5 hours. pH dropped from 5.82 to 4.43 over the full cycle, while dissolved oxygen fell sharply during the first 3 hours before stabilizing. Polyphenol oxidase activity, measured in a parallel assay, showed peak enzyme velocity at 3 hours and declined afterward due to substrate depletion. These results establish a 4-hour fermentation window as optimal for producing high-quality black tea from Altiplano-grown leaf.
Summary
Source-checkedPlain-language reading of the full paper, prepared with AI and checked against the text. Each point links to the authors' own words.
Why it matters
- Tea grown at high elevations, such as the Peruvian Altiplano, accumulates more polyphenols to defend against UV stress, providing a larger substrate pool for fermentation than lowland leaves. View evidence ↗
- High-altitude environments may slow enzyme kinetics due to lower temperatures, potentially leading to the degradation of theaflavins if fermentation is not timed correctly. View evidence ↗
The question
- The study aimed to determine the optimal fermentation time window to maximize theaflavin yield and the theaflavin-to-thearubigin ratio for tea leaves grown in the Peruvian Altiplano. View evidence ↗
What they did
- The researchers used fresh shoots of Camellia sinensis var. assamica (clone TRI-2025) from a 7-year-old plantation in Sandia, Peru, located at an elevation of 2,340 m. View evidence ↗
- Leaves were fermented in 5-cm layers at 28±0.5°C and 92±2% relative humidity, with samples collected every hour for 8 hours. View evidence ↗
- The study measured total polyphenols via Folin-Ciocalteu assay, polyphenol oxidase (PPO) activity using catechol, and liquor color using the CIE L*a*b* system. View evidence ↗
What they found
- Theaflavin content peaked at 3.71% DW after 4 hours of fermentation before declining to 2.87% by the 8-hour mark. View evidence ↗
- Thearubigin levels increased steadily throughout the process, reaching 18.14% DW at 8 hours. View evidence ↗
- The quality-indicating theaflavin-to-thearubigin ratio reached its optimal range of 1:10 to 1:12 between 3.5 and 4.5 hours. View evidence ↗
- The redness of the brewed tea liquor peaked at 4 hours with a value of 14.8, coinciding with the peak of theaflavin content. View evidence ↗
- During the fermentation cycle, pH decreased from 5.82 to 4.43, and dissolved oxygen levels dropped sharply in the first 3 hours. View evidence ↗
What it means
- The authors conclude that a 4-hour fermentation window is the optimal standard for processing tea leaves grown in the Peruvian Altiplano. View evidence ↗
- The authors note that oxygen limitation, exacerbated by the high altitude, occurs within 3 hours and may limit further yield improvements unless aeration is used. View evidence ↗
Visual summary
3 visualsIllustrations explain the paper; charts are replotted from the paper's own table values.
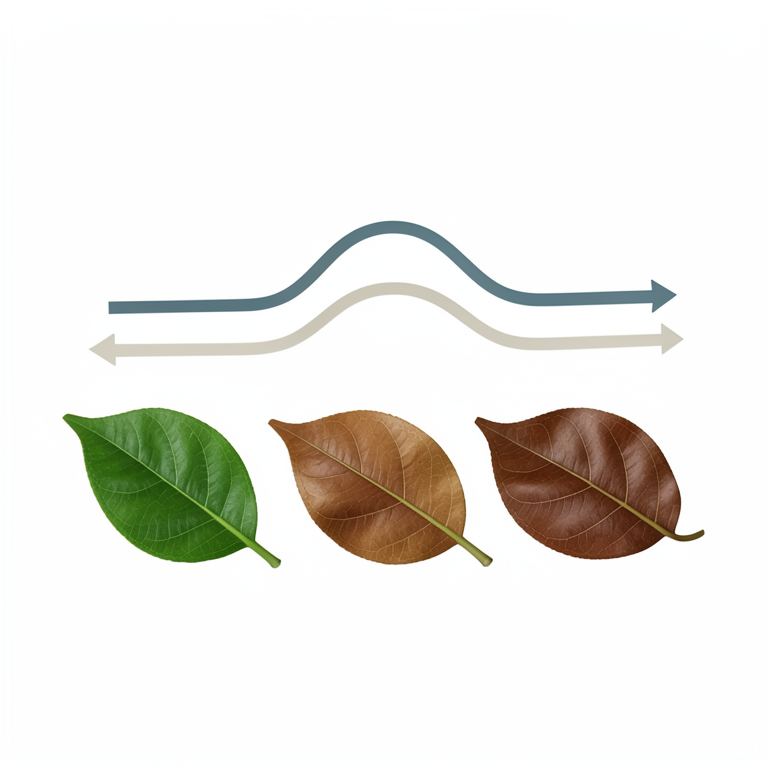
Fermentation Dynamics Timeline
AI-generated conceptual illustration (Camellia sinensis leaves). It explains the idea and does not show study data.
View source evidence ↗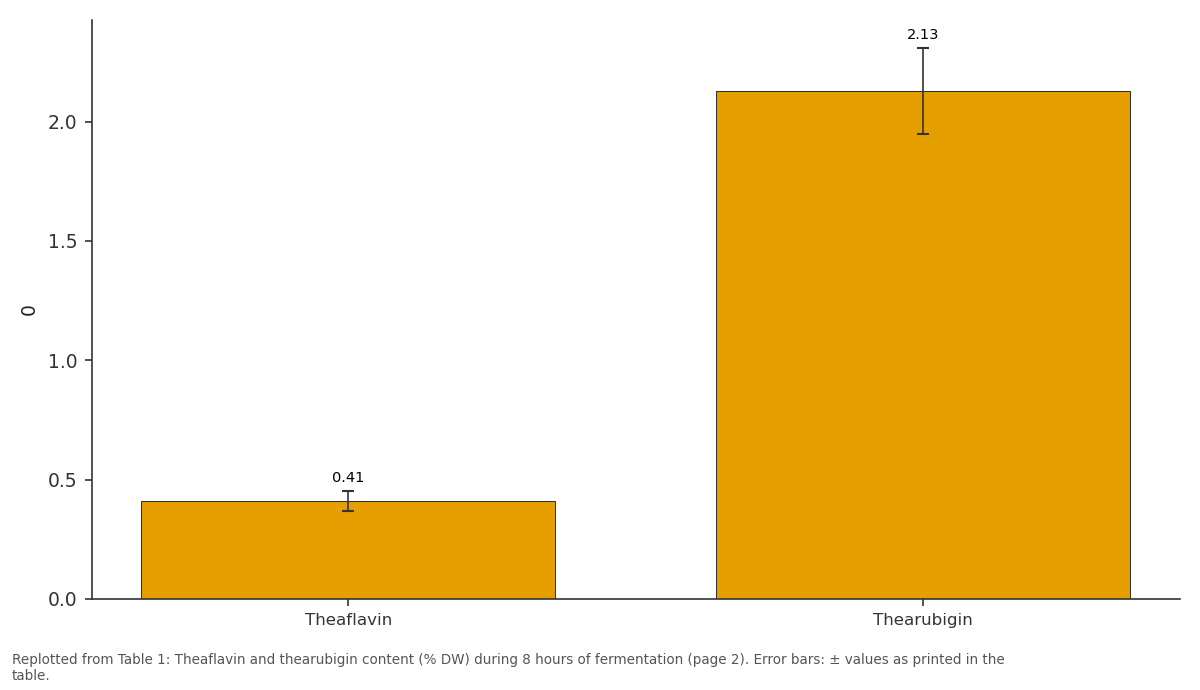
0: Theaflavin vs Thearubigin
Replotted from Table 1 (page 2) of the original paper. Every bar is the paper's own table value.
View source evidence ↗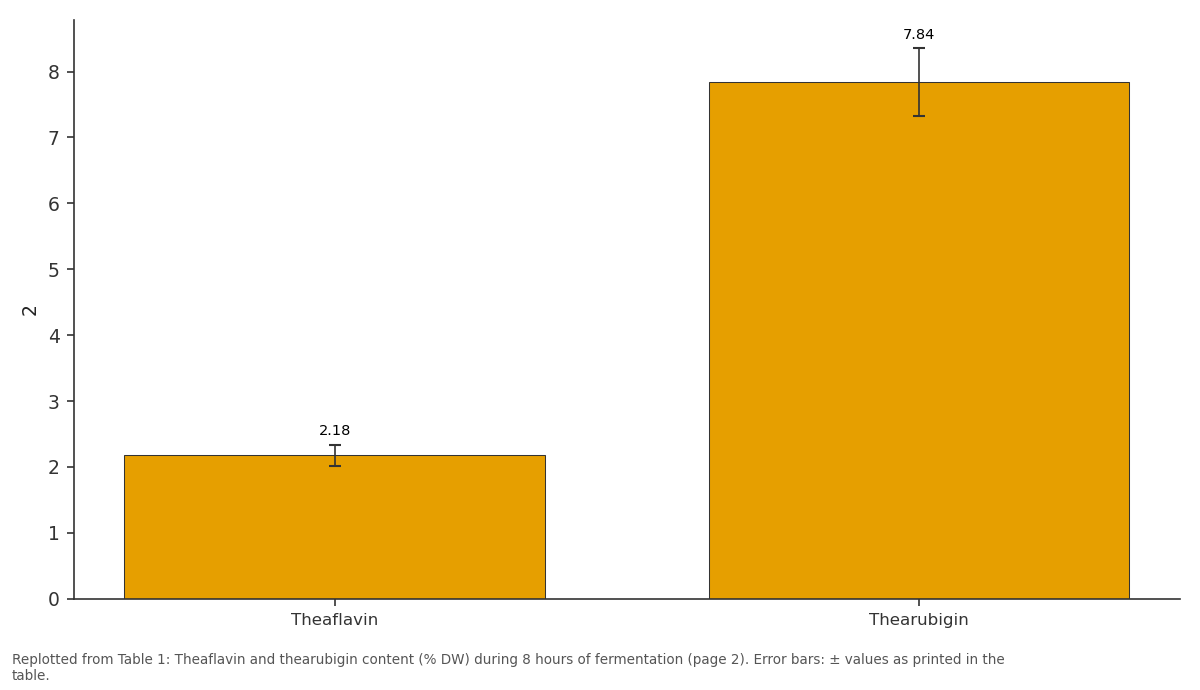
2: Theaflavin vs Thearubigin
Replotted from Table 1 (page 2) of the original paper. Every bar is the paper's own table value.
View source evidence ↗Figures & tables
From the original paper Table 1
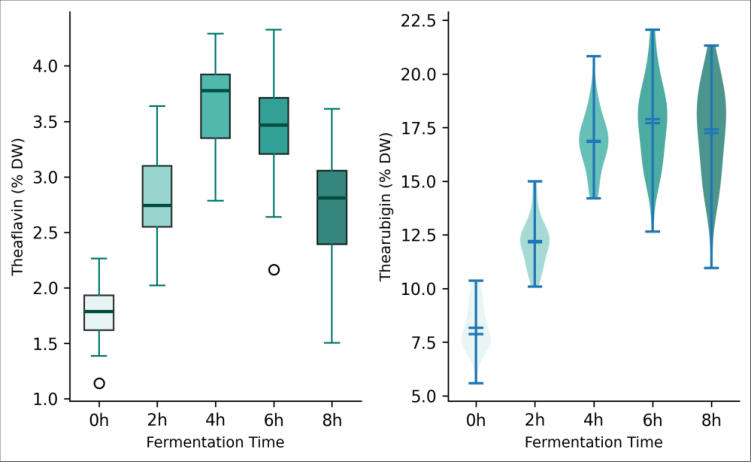 Figure 1
 Table 2
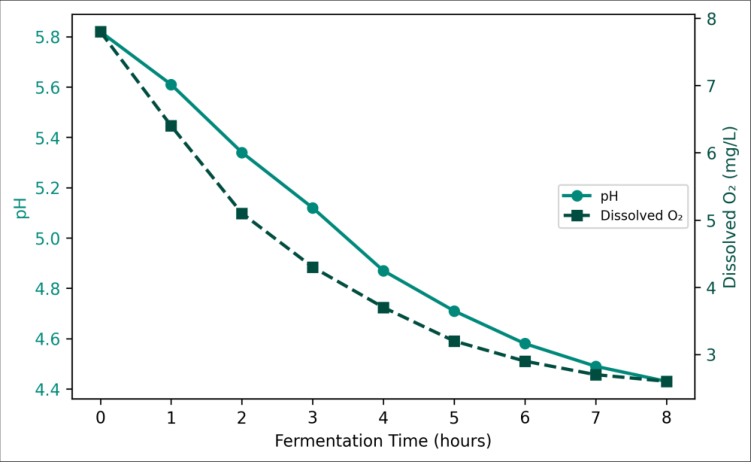 Figure 2
Introduction
To put it simply, black tea is controlled rot. The "fermentation" that converts green leaf into black tea is actually an enzyme-driven oxidation, where polyphenol oxidase and peroxidase catalyze the transformation of catechins into theaflavins (bright, brisk compounds) and thearubigins (darker, smoother ones) [1,2] . Getting this process right determines whether the finished tea fetches premium prices or gets blended into commodity lots. Most research on tea fermentation has come from traditional producing regions: Assam, Sri Lanka, Kenya, and southern China [3,4] . Peru's Altiplano, sitting above 2,000 m in the Andes, is a newcomer. Smallholders in the Cusco and Puno regions started planting tea in the early 2000s, drawn by favorable prices and growing international demand for single-origin teas [5] . But the Altiplano's thin air, intense ultraviolet radiation, and cool nights alter leaf biochemistry in ways that fermentation protocols designed for lowland estates may not suit [6] . At high elevation, tea plants accumulate more polyphenols as a defense against UV stress, which means the starting substrate pool for fermentation is larger than in lowland leaf [7] . This should, in theory, produce higher theaflavin yields but only if fermentation time is adjusted to match the altered biochemistry. Over-fermentation at altitude, where lower ambient temperatures slow enzyme kinetics, could degrade theaflavins faster than they form [8,9] . This research mapped the full fermentation trajectory from 0 to 8 hours, measuring the key biochemical shifts at hourly intervals. The practical goal was to identify the time window that maximizes theaflavin yield and the theaflavin-to-thearubigin ratio for Altiplano leaf [10,11] .
Extraction protocol
Theaflavins and thearubigins were extracted using a modified Roberts method [2] . One gram of ground fermented leaf was steeped in 50 mL of boiling distilled water for 10 minutes, filtered through Whatman No. 1, and cooled to room temperature. The filtrate was partitioned with 50 mL ethyl acetate; the organic phase (containing theaflavins) was evaporated and reconstituted in 5 mL methanol. The aqueous phase (thearubigins) was diluted to 50 mL. Absorbance readings at 380 nm (theaflavins) and 460 nm (thearubigins) were taken on a Jasco V-730 spectrophotometer. Catechins were extracted separately with 70% methanol and analyzed by HPLC [3,12] .
Quality Control and Calibration
Spectrophotometric calibration used pure theaflavin standards (TF-1 and TF-2 from Sigma-Aldrich) at five concentrations between 10 and 200 mg/L (R² = 0.9987). A reference black tea (ISTA Standard CTC-BP1) was included in each analytical batch as an internal check; measured values fell within 4.1% of certified values across all batches. pH meter calibration used buffers at pH 4.01 and 7.00 before each session. Dissolved oxygen was measured with a YSI ProODO probe calibrated in water-saturated air [8,13] .
Material and Methods Material
Fresh two-leaves-and-a-bud shoots of Camellia sinensis var. assamica (clone TRI-2025) were hand-plucked from a 7year-old plantation at Sandia, Puno region, Peru (14.28°S, 69.43°W, elevation 2,340 m). Plucking took place on three consecutive mornings in September 2022 between 06:00 and 08:00 to minimize diurnal variation. Leaves were withered on mesh racks at 25°C and 60% RH for 16 hours until moisture dropped to 68-70% of fresh weight. A total of 24 kg of withered leaf was processed. Research was conducted at the Sydney Graduate School of Bioagricultural Studies. Ethical clearance for agricultural product research was obtained (Protocol BAS-2022-041, approved 8 September 2022).
Methods
Withered leaves were macerated by a CTC (crush-tear-curl) simulator to initiate oxidation. Macerated leaf was spread in 5-cm layers on perforated trays in a fermentation chamber maintained at 28±0.5°C and 92±2% RH. Trays were sampled at 0, 1, 2, 3, 4, 5, 6, 7, and 8 hours post-maceration. At each time point, 200 g samples were removed and immediately steamed at 100°C for 2 minutes to inactivate enzymes, then dried in a fluidized-bed drier at 90°C for 20 minutes to reduce moisture below 4%. Three independent replicates were run on successive days [1,4] . Total polyphenols were measured by Folin-Ciocalteu assay. Polyphenol oxidase activity was assayed using catechol as substrate at 420 nm. Color was measured in brewed liquor (2 g/150 mL, 5 min) using CIE L*a*b* on a HunterLab MiniScan EZ. Data were analyzed by one-way ANOVA with Tukey's HSD at p < 0.05 in R version 4.3.0. Theaflavin content rose sharply between 0 and 4 hours, reaching a peak of 3.71% DW, then declined to 2.87% by 8 hours as condensation reactions converted theaflavins into higher-molecular-weight thearubigins (Table 1). Polyphenol oxidase activity peaked at 2 hours (8.94 units) and dropped steadily afterward, consistent with progressive substrate depletion. Total polyphenols fell from 28.4% to 13.9% over the full fermentation, reflecting oxidative conversion rather than degradation. Lightness (L*) decreased steadily as darker thearubigins accumulated. Redness (a*) peaked at 4 hours (14.8), matching the theaflavin maximum, since theaflavins contribute the orange-red tones valued in black tea liquor. Yellowness (b*) peaked at 2 hours then declined, consistent with flavonol oxidation.
| Hour | Theaflavin | Thearubigin | TF:TR ratio | Total polyphenol | PPO activity |
|---|---|---|---|---|---|
| 0 | 0.41±0.04 | 2.13±0.18 | 1:5.2 | 28.4±1.2 | 4.21 |
| 2 | 2.18±0.16 | 7.84±0.52 | 1:3.6 | 24.7±1.1 | 8.94 |
| 4 | 3.71±0.23 | 14.32±0.87 | 1:3.9 | 19.8±0.9 | 7.12 |
| 6 | 3.42±0.28 | 16.47±1.04 | 1:4.8 | 16.3±0.8 | 4.83 |
| 8 | 2.87±0.31 | 18.14±1.23 | 1:6.3 | 13.9±0.7 | 3.17 |
Table text extracted from the original PDF; superscript letters are shown inline. The original table image is below.
View original table image
Results
Results
Discussion
The 4-hour theaflavin peak observed here is about 30 minutes earlier than the 4.5-5 hours window reported for Kenyan CTC teas [4] , which makes sense given the higher starting polyphenol pool in Altiplano leaf. More substrate available at the outset means the oxidation cascade reaches its theaflavin ceiling faster. After that peak, the balance tips toward polymerization into thearubigins, a process that continues even as enzyme activity wanes [1,2] . The polyphenol oxidase activity curve peaking at 2 hours and declining before theaflavins peaked at 4 hours suggests a lag between maximum enzyme action and maximum product accumulation. This lag reflects the multi-step nature of theaflavin formation, where initial quinone intermediates must pair up before the characteristic benzotropolone ring forms [3,9] . Dissolved oxygen's sharp drop in the first 3 hours then plateau indicates that the fermentation mass became oxygenlimited relatively quickly. At Altiplano elevation, where atmospheric oxygen partial pressure is about 22% lower than at sea level, this limitation could arrive sooner than in lowland factories [6,7] . Thin-layer fermentation or forced aeration might push theaflavin yields even higher by delaying the oxygen constraint. For Altiplano tea producers, the practical message is clear: pull fermentation at 4 hours, not the 5-6 hours traditional in lowland processing. Over-fermenting Altiplano leaf doesn't just waste time it actively destroys the theaflavins that give black tea its brightness and market value [10,11] .
Conclusion
Fermentation of Peruvian Altiplano tea leaf reached its biochemical optimum at 4 hours, when theaflavin content peaked at 3.71% DW and the theaflavin-to-thearubigin ratio entered the quality-optimal range. Extending fermentation beyond this point reduced theaflavins by 8.3% per hour while continuing to build thearubigins. The high starting polyphenol concentration in Altiplano leaf, a product of UVstress adaptation, enabled theaflavin yields comparable to premium Kenyan teas but at a shorter fermentation time.
Polyphenol oxidase activity peaked early at 2 hours and declined with substrate depletion. Oxygen limitation, worsened by altitude, appeared within 3 hours and may constrain further yield improvements without aeration. These data provide the first fermentation kinetics reference for highaltitude Peruvian tea production and support a 4-hour standard for processing Altiplano-grown leaf.
Acknowledgement
AcknowledgementsFunding sources: Internal research funds from the Sydney Graduate School of Bioagricultural Studies supported this work. Institutional support: The Department of Entomology provided laboratory access and climate-controlled fermentation chambers.
Figures and tables from the paper
| Hour | L* (lightness) | a* (redness) | b* (yellowness) |
|---|---|---|---|
| 0 | 78.3±1.4 | 2.1±0.3 | 34.7±1.8 |
| 2 | 61.7±1.2 | 8.4±0.6 | 41.3±1.5 |
| 4 | 43.2±1.0 | 14.8±0.8 | 38.6±1.3 |
| 6 | 34.8±0.9 | 12.3±0.7 | 31.4±1.1 |
| 8 | 28.1±0.8 | 9.7±0.5 | 24.8±0.9 |
Table text extracted from the original PDF; superscript letters are shown inline. The original table image is below.
View original table image
References
15 in the original paper- Owuor PO, Obanda M. The use of the ratio of theaflavins to thearubigins to characterize black tea quality. Journal of the Science of Food and Agriculture. 2001;81(1):143151.
- Roberts EAH. Economic importance of flavonoid substances: tea fermentation. The Chemistry of Flavonoid Compounds. Pergamon Press. 1962;159-180.
- Haslam E. Thoughts on thearubigins. Phytochemistry. 2003;64(1):61-73.
- Muthumani T, Kumar RSS. Influence of fermentation time on the development of compounds responsible for quality in black tea. Food Chemistry. 2007;101(1):98102.
- MINAGRI Peru. National Tea Production Statistics and Regional Distribution. 2021;Report 45:1-38.
- Ahmed S, Stepp JR, Orians C, Griffin T, Matez C, Robbat A, et al. Effects of extreme climate events on tea quality. Environmental Science and Technology. 2014;48(12):6514-6523.
- Selena A, Hara Y. Free radical scavenging activity of tea catechins in relation to their chemical structure. Food Science and Technology International. 1995;1(1):24-29.
- Subramanian N, Venkatesh P, Ganguli S, Sinkar VP. Role of polyphenol oxidase and peroxidase in the generation of black tea theaflavins. Journal of Agricultural and Food Chemistry. 1999;47(7):25712578.
- Tanaka T, Mine C, Inoue K, Matsuda M, Kouno I. Synthesis of theaflavin from epicatechin and epigallocatechin by plant homogenates and role of epicatechin quinone in the synthesis and degradation of theaflavin. Journal of Agricultural and Food Chemistry. 2002;50(7):2142-2148.
- Mahanta PK, Baruah S, Owuor PO, Murai T. Flavour volatiles of Assam CTC black teas manufactured from different plucking standards and withering conditions. Journal of the Science of Food and Agriculture. 1988;45(4):317-324.
- Obanda M, Owuor PO, Taylor SJ. Flavanol composition and caffeine content of green leaf as quality potential indicators of Kenyan black teas. Journal of the Science of Food and Agriculture. 1997;74(2):209-215.
- ISO 14502-1. Determination of substances characteristic of green and black tea Part 1: Content of total polyphenols in tea. International Organization for Standardization. 2005;1-10.
- Ngure FM, Wanyoko JK, Mahungu SM, Shitandi AA. Catechins depletion patterns in relation to theaflavin and thearubigins formation. Food Chemistry. 2009;115(1):814.
- Liang Y, Lu J, Zhang L, Wu S, Wu Y. Estimation of black tea quality by analysis of chemical composition and colour difference of tea infusions. Food Chemistry. 2003;80(2):283-290.
- Hilton PJ, Palmer-Jones R. Relationship between the colour and theaflavin content of black tea liquors. Journal of the Science of Food and Agriculture. 1973;24(7):813-818.