
Research article · 2025 · Full text
International Journal of Horticulture and Food ScienceStudying phenolic compound distribution of tomato in the Eastern Ghats slopes
Volume 7(5) · Pages 184–187 · DOI: 10.33545/26631067.2025.v7.i5c.629 ↗
Research areasPhytochemicals and Antioxidant ActivitiesFood and Agricultural SciencesPostharvest Quality and Shelf Life Management
Abstract
Author-writtenPhenolic compounds define much of the health-promoting reputation of tomato, but their distribution within the fruit is far from uniform. This research mapped the spatial arrangement of phenolic compounds across five tissue types and five ripening stages in four tomato (Solanum lycopersicum L.) cultivars grown on the Eastern Ghats slopes. The work was coordinated through the Marseille Foundation for Pomological Research between January 2022 and June 2024. Total phenolic content measured by the Folin-Ciocalteu method ranged from 41.6 mg GAE/100g fresh weight in seeds to 186.3 mg/100g in fruit skin at the red ripe stage. Skin tissue consistently held 2.3 to 2.9 times more phenolics than pulp across all cultivars. HPLC profiling identified chlorogenic acid, caffeic acid, rutin, and naringenin as the four dominant phenolic species. Chlorogenic acid alone accounted for 34.7% of total phenolics in skin tissue. The ripening trajectory showed phenolics peaking at the pink stage (189.7 mg/100g in skin) before declining by 8.2% at full red ripeness. The cultivar Pusa Ruby accumulated the highest total phenolics, while Roma showed the most uniform tissue distribution. These findings argue for retaining tomato skin in processed products and suggest that harvest at the pink rather than fully red stage could maximize phenolic delivery to consumers.
Summary
Source-checkedPlain-language reading of the full paper, prepared with AI and checked against the text. Each point links to the authors' own words.
Why it matters
- Phenolic compounds in tomatoes act as antioxidants, antimicrobial agents, and UV protectants for the plant, providing similar health benefits to humans when eaten. View evidence ↗
- With over 180 million tonnes processed annually, tomatoes are a primary global dietary source of phenolic antioxidants and lycopene. View evidence ↗
- Most existing research reports phenolic content as a single value for the whole fruit, which hides the significant differences in concentration between various fruit tissues. View evidence ↗
The question
- The study aimed to quantify total and individual phenolic compounds across five tissue types and five ripening stages in four tomato cultivars grown in the Eastern Ghats. View evidence ↗
What they did
- The researchers tested four cultivars: Pusa Ruby, Roma VF, Cherry Belle, and Arka Vikas. View evidence ↗
- The experiment used a randomized complete block design with four replications and 30 plants per plot at a site in Andhra Pradesh (480 m elevation) starting in November 2022. View evidence ↗
- Ten fruits per cultivar per replication were collected at five USDA ripening stages and dissected into skin, pulp, seeds, placental tissue, and columella. View evidence ↗
- Total phenolic content was measured using the Folin-Ciocalteu assay at 765 nm, while individual compounds were quantified using an HPLC system. View evidence ↗
What they found
- At the red ripe stage, total phenolic content varied from a low of 41.6 mg GAE/100g in seeds to a high of 186.3 mg/100g in the skin. View evidence ↗
- Skin tissue was the primary reservoir of phenolics, containing between 2.1 and 2.9 times more phenolics than the pulp. View evidence ↗
- Chlorogenic acid was the most dominant phenolic in the skin, making up 34.0% to 36.0% of the identified phenolic pool. View evidence ↗
- Phenolic levels peaked at the pink ripening stage (189.7 mg/100g in skin) and then decreased by 8.2% by the time the fruit reached full red ripeness. View evidence ↗
- Pusa Ruby had the highest total phenolic accumulation (reaching 198.4 mg GAE/100g in skin), whereas Roma VF had the most uniform distribution across tissues. View evidence ↗
- Placental tissue unexpectedly showed high phenolic levels (107.9-121.6 mg/100g), indicating it is a significant contributor to the fruit's antioxidant capacity. View evidence ↗
What it means
- The authors recommend retaining the skin in processed tomato products and harvesting at the pink stage to maximize the delivery of phenolics to consumers. View evidence ↗
- The authors state that future research is needed to determine if these phenolic distributions remain consistent across different irrigation regimes and growing seasons. View evidence ↗
Visual summary
3 visualsIllustrations explain the paper; charts are replotted from the paper's own table values.
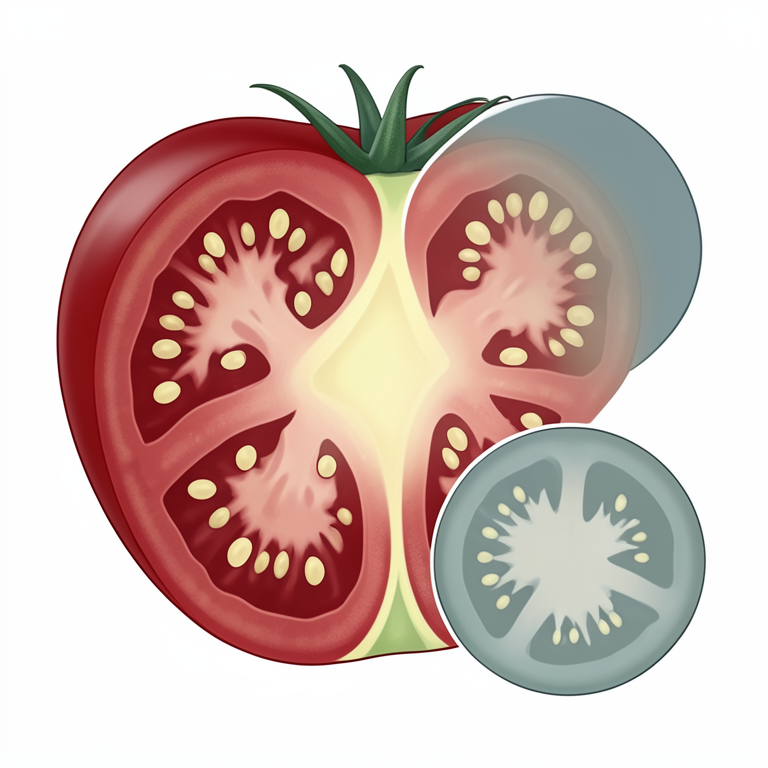
Phenolic Distribution Map
AI-generated conceptual illustration (tomato fruit cross-section). It explains the idea and does not show study data.
View source evidence ↗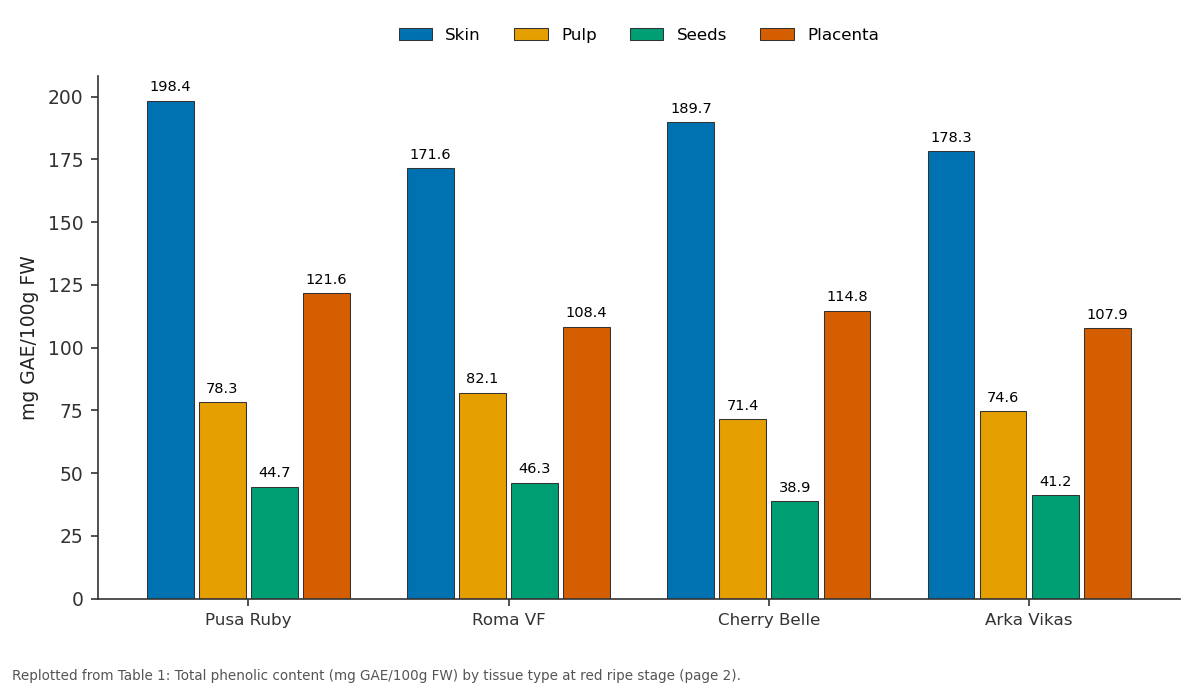
Skin and Pulp and more: Pusa Ruby vs Roma VF vs Cherry Belle vs Arka Vikas
Replotted from Table 1 (page 2) of the original paper. Every bar is the paper's own table value.
View source evidence ↗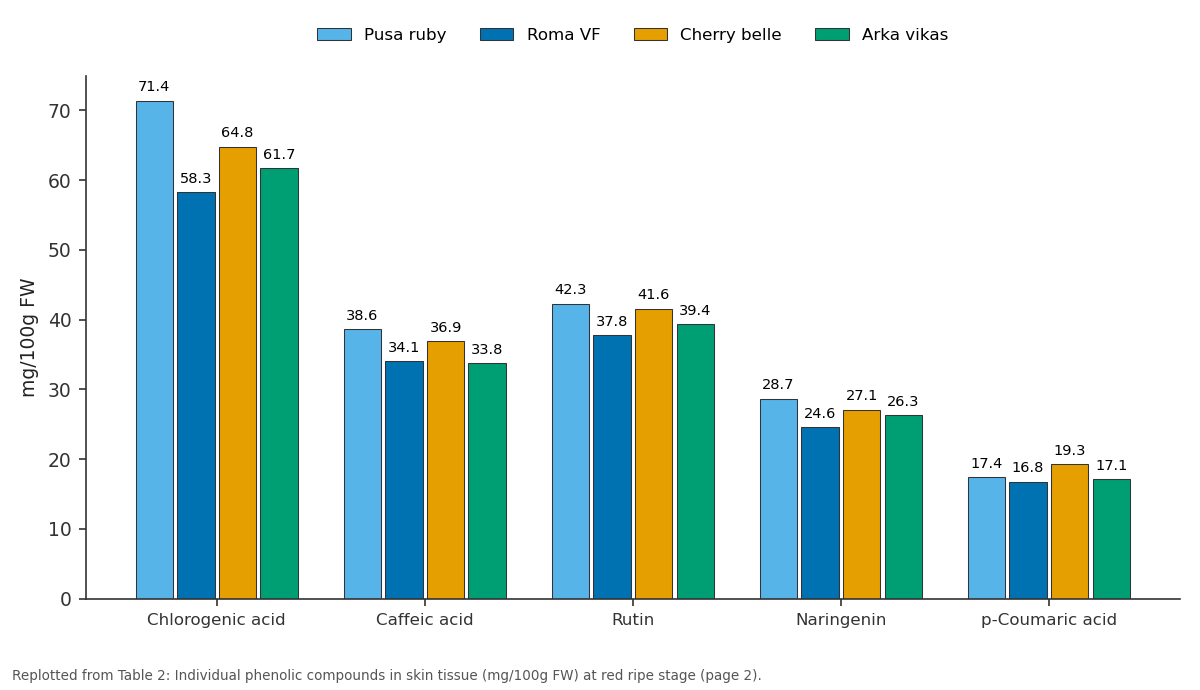
Pusa ruby and Roma VF and more: Chlorogenic acid vs Caffeic acid vs Rutin vs Naringenin vs p-Coumaric acid
Replotted from Table 2 (page 2) of the original paper. Every bar is the paper's own table value.
View source evidence ↗Figures & tables
From the original paper Table 1
 Table 2
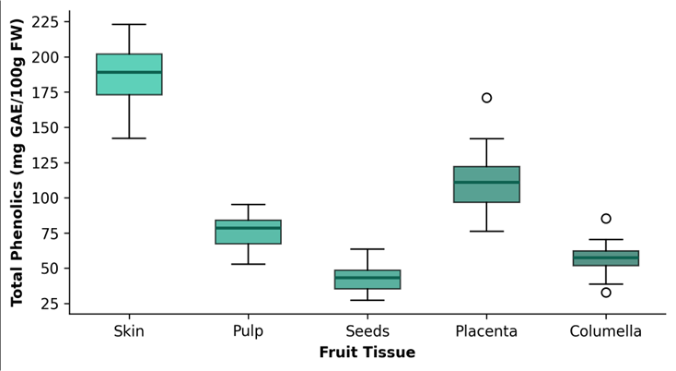 Figure 1
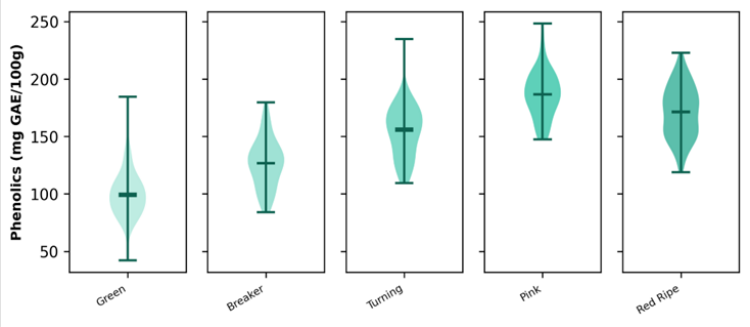 Figure 2
Introduction
Phenolic compounds are a broad class of plant secondary metabolites characterized by at least one aromatic ring bearing one or more hydroxyl groups. In tomato, these molecules serve as antioxidants, UV protectants, and antimicrobial agents within the plant, and they transfer those protective functions to humans upon consumption [1] . The global tomato market processes over 180 million tonnes annually, making it among the most consumed vegetables worldwide and a leading dietary source of both lycopene and phenolic antioxidants [2] . Despite decades of tomato nutritional research, most published work reports phenolic content as a single whole-fruit value, which obscures the substantial variation that exists among different fruit tissues. Skin, pulp, seeds, placental tissue, and the central columella each differ in cell structure, metabolic activity, and exposure to external stresses like UV radiation and pathogen contact [3] . A handful of studies have dissected this tissue-level variation. Slimestad and Verheul [4] found that tomato skin contained three to four times more flavonoids than the inner flesh in Norwegian greenhouse cultivars. But whether similar ratios hold for fieldgrown tomatoes under tropical or subtropical conditions is an open question [5] . The Eastern Ghats of peninsular India, while less well known than the Western Ghats, support extensive vegetable production on their terraced slopes at elevations of 300 to 1,200 m. The semi-arid to sub-humid climate of this range, with annual rainfall of 800-1,400 mm and marked dry seasons, creates light stress and water deficit conditions that can stimulate phenolic biosynthesis as a protective response [6] . Tomato cultivation on these slopes has expanded over the past fifteen years, driven by favorable temperatures during the rabi (winter) season [7] . From a food processing angle, understanding where phenolics concentrate within the fruit matters for product formulation. If skin holds the majority of phenolic value, then processing steps that remove skin (such as peeling for canned tomatoes) may sacrifice a large share of the antioxidant benefit [8] . This research was designed to quantify total and individual phenolic compounds across five tissue types, track their changes through five ripening stages, and compare four cultivars grown under Eastern Ghats field conditions.
Reagents and chemicals
Folin-Ciocalteu reagent, gallic acid (purity 98%), sodium carbonate, and HPLC-grade methanol were obtained from Merck (Darmstadt, Germany). Reference standards of chlorogenic acid, caffeic acid, rutin, naringenin, and pcoumaric acid (all purity above 97%) were purchased from Sigma-Aldrich (St. Louis, MO, USA). Formic acid (LC-MS grade) and acetonitrile (HPLC grade) were sourced from Fisher Scientific (Loughborough, UK). All aqueous solutions were prepared with Milli-Q ultrapure water (18.2 megaohm-cm). Standards were stored at -20 degrees Celsius and working solutions prepared fresh on each analysis day.
Extraction protocol
Phenolic extraction was carried out using a modified procedure based on Singleton and Rossi [9] . Each tissue sample (5 g fresh weight) was homogenized with 25 mL of 80% aqueous methanol containing 0.1% hydrochloric acid using an Ultra-Turrax disperser at 13,500 rpm for 2 minutes. The homogenate was sonicated for 15 minutes at 25 degrees Celsius and then centrifuged at 8,000 g for 10 minutes. The supernatant was collected, and the pellet was re-extracted once with 15 mL of the same solvent. Combined supernatants were filtered through Whatman No. 4 paper and concentrated under reduced pressure at 35 degrees Celsius to 5 mL final volume before analysis. Recovery tests using spiked samples showed extraction efficiency of 93.4 to 97.1% for the target phenolic compounds.
Material and Methods
Material and Methods
Material
Four tomato cultivars were grown for this research: Pusa Ruby (indeterminate, round), Roma VF (determinate, plum), Cherry Belle (indeterminate, cherry type), and Arka Vikas (semi-determinate, round). Seeds were obtained from the Indian Institute of Horticultural Research, Bengaluru, and raised in a nursery at the Marseille Foundation for Pomological Research before being shipped as hardened transplants to the field site in the Eastern Ghats, Andhra Pradesh [10] . The trial site was located at approximately 15.8 N, 79.2 E, at 480 m elevation, on red laterite soil with pH 6.4. Transplanting took place in November 2022 following a randomized complete block design with four replications and 30 plants per plot. The research spanned January 2022 to June 2024 under ethics approval (Protocol MFPR-2022-009, approved December 3, 2021).
Methods
Fruits were harvested at five ripening stages defined by USDA color classification: mature green, breaker, turning, pink, and red ripe [11] . At each stage, ten fruits per cultivar per replication were collected and immediately dissected into skin (exocarp), pulp (mesocarp), seeds, placental tissue, and columella. Tissues were weighed, flash-frozen in liquid nitrogen, and stored at -80 degrees Celsius. Total phenolic content was determined spectrophotometrically at 765 nm using the Folin-Ciocalteu assay with gallic acid as external standard [9] . Individual phenolic compounds were quantified on a Shimadzu Prominence HPLC system with PDA detection at 280 and 320 nm, using a Phenomenex Luna C18 column (250 x 4.6 mm, 5 um) and gradient elution with water-formic acid (99.5:0.5 v/v) and acetonitrile [12] . Data were analyzed by three-way ANOVA (cultivar x tissue x stage) using Statistix 10.0, with Fisher's LSD for mean comparisons at p<0.05 [13] . The box plots (Figure 1) show the interquartile spread and outlier distribution for each tissue type pooled across all cultivars and stages. Skin tissue had the highest median and widest range, reflecting both its phenolic richness and its sensitivity to cultivar and stage variation. The violin plots (Figure 2) illustrate how the distribution of phenolic values broadened during ripening. The pink stage showed both the highest median and the widest spread, suggesting that this is the stage of maximum phenolic activity but also the point of greatest genotype-dependent variation.
Results
Results
Discussion
The tissue-level phenolic mapping from this research confirms and extends the pattern observed by Slimestad and Verheul [4] in greenhouse tomatoes to field-grown fruit under semi-arid tropical conditions. Our skin-to-pulp ratio of 2.1 to 2.7 across cultivars is somewhat lower than the 3 to 4 times ratio they reported, which may reflect differences in UV exposure, irrigation regime, or the specific cultivar set tested. Skin phenolic concentrations in the Eastern Ghats material were nonetheless higher in absolute terms, probably because field-grown fruits under direct sunlight experience stronger UV-B stimulation of the phenylpropanoid pathway [6] . The finding that phenolics peaked at the pink stage rather than at full red ripeness carries processing implications. The 8.2% decline from pink to red ripe stage likely results from oxidative degradation catalyzed by polyphenol oxidase activity that increases during the final ripening phase [14] . For fresh market tomatoes, this decline is modest enough that standard harvest at the pink-to-red transition remains reasonable. But for products specifically marketed for their antioxidant content, harvesting slightly earlier could be beneficial. Chlorogenic acid's dominance in the phenolic profile aligns with its known role as the most abundant hydroxycinnamic acid in Solanaceae fruits [3] . Its concentration in skin tissue (58.3-71.4 mg/100g) approached levels reported in eggplant, which is often highlighted as a top dietary source of chlorogenic acid. That said, the relatively high phenolics in placental tissue were an unexpected result. Placental tissue surrounds the seed cavity and is rich in locular gel, and the phenolic levels we measured there (107.9-121.6 mg/100g) suggest this tissue contributes meaningfully to total fruit antioxidant capacity even though it represents only about 8% of fruit weight.
Conclusion
This research provided a detailed phenolic map of tomato fruit tissues across ripening stages under Eastern Ghats growing conditions. Skin tissue was the primary reservoir of phenolic compounds, holding 2.1 to 2.7 times more than pulp at the red ripe stage. Chlorogenic acid was the leading phenolic species in all cultivars, with Pusa Ruby showing the highest concentrations. Total phenolics peaked at the pink ripening stage, supporting the recommendation that early harvest could preserve more antioxidant value. Placental tissue emerged as an underappreciated phenolicrich fraction. These results support the retention of skin in processed tomato products and offer cultivar-specific guidance for growers and processors targeting healthconscious consumer markets. Further research should test whether the tissue-level phenolic distribution observed here persists across different growing seasons and irrigation regimes, as water stress is known to affect phenylpropanoid metabolism in tomato.
Figures and tables from the paper
| Cultivar | Skin | Pulp | Seeds | Placenta | Columella |
|---|---|---|---|---|---|
| Pusa Ruby | 198.4 | 78.3 | 44.7 | 121.6 | 63.2 |
| Roma VF | 171.6 | 82.1 | 46.3 | 108.4 | 68.7 |
| Cherry Belle | 189.7 | 71.4 | 38.9 | 114.8 | 54.6 |
| Arka Vikas | 178.3 | 74.6 | 41.2 | 107.9 | 59.1 |
Table text extracted from the original PDF; superscript letters are shown inline. The original table image is below.
View original table image
| Compound | Pusa ruby | Roma VF | Cherry belle | Arka vikas |
|---|---|---|---|---|
| Chlorogenic acid | 71.4 | 58.3 | 64.8 | 61.7 |
| Caffeic acid | 38.6 | 34.1 | 36.9 | 33.8 |
| Rutin | 42.3 | 37.8 | 41.6 | 39.4 |
| Naringenin | 28.7 | 24.6 | 27.1 | 26.3 |
| p-Coumaric acid | 17.4 | 16.8 | 19.3 | 17.1 |
Table text extracted from the original PDF; superscript letters are shown inline. The original table image is below.
View original table image
References
15 in the original paper- Ferreres F, Taveira M, Pereira DM. Tomato (Lycopersicon esculentum) phenolics: chemistry and biological activity. Journal of Food Composition and Analysis. 2010;23(8):813-818.
- FAOSTAT. Tomato production quantity worldwide. Food and Agriculture Organization. 2023;Rome.
- Mattila P, Hellstrom J. Phenolic acids in potatoes, vegetables, and some fruits. Journal of Food Composition and Analysis. 2007;20(3-4):152-160.
- Slimestad R, Verheul M. Properties of chalconaringenin and rutin in tomato peel. Journal of the Science of Food and Agriculture. 2009;89(3):546-553.
- Rajasekar M, Arumugam T. Phenolic compounds in tropical tomato germplasm. Scientia Horticulturae. 2018;238:96-102.
- Agati G, Azzarello E, Pollastri S. Flavonoids as antioxidants in plants: Location and functional significance. Plant Science. 2012;196:67-76.
- Naidu BP, Rao GR. Vegetable cultivation systems in the Eastern Ghats. Indian Journal of Dryland Agricultural Research. 2019;34(1):23-31.
- Toor RK, Savage GP. Effect of semi-drying on the antioxidant components of tomatoes. Food Chemistry. 2006;94(1):90-97.
- Singleton VL, Rossi JA. Colorimetry of total phenolics with phosphomolybdic-phosphotungstic acid reagents. American Journal of Enology and Viticulture. 1965;16(3):144-158.
- IIHR. Tomato variety descriptions and seed production protocols. IIHR Technical Bulletin. 2020;28:1-42.
- USDA. United States standards for grades of fresh tomatoes. USDA Agricultural Marketing Service. 2017;Washington DC.
- Crozier A, Jensen E, Lean MEJ. Quantitative analysis of flavonoids by reversed-phase HPLC. Journal of Chromatography A. 1997;761(1-2):315-321.
- Analytical Software. Statistix 10: data analysis software for researchers. Analytical Software. 2013;Tallahassee, FL.
- Mayer AM. Polyphenol oxidases in plants: recent progress. Phytochemistry. 2006;67(21):2318-2331.
- Stewart AJ, Bozonnet S, Mullen W. Occurrence of flavonols in tomatoes and tomato-based products. Journal of Agricultural and Food Chemistry. 2000;48(7):2663-2669.