
Research article · 2025 · Full text
International Journal of Horticulture and Food ScienceOptimizing root morphology of quinoa in the Damodar valley
Volume 7(9) · Pages 112–115 · DOI: 10.33545/26631067.2025.v7.i9b.670 ↗
Research areasSeed and Plant BiochemistryGenetics and Plant BreedingRice Cultivation and Yield Improvement
Abstract
Author-writtenQuinoa (Chenopodium quinoa Willd.) is being tested as an alternative grain crop in India’s coal-belt river valleys, but its root system adaptation to the heavy, compacted alluvial soils of the Damodar Valley has not been characterized. This research optimized root morphology of eight quinoa genotypes under three water stress levels at the Salem University of Food and Nutrition from January to September 2023, using field trials conducted in the Damodar Valley of Jharkhand. Root length, root diameter, root hair density, specific root length, and root-to-shoot ratio were measured at four growth stages using minirhizotron imaging and destructive harvests. Moderate drought stress (50% field capacity) increased root length by 41.7% and root hair density by 58.3% compared with well-watered controls, while severe stress (25% FC) triggered root length increase of only 18.4% with significant root diameter reduction. Drone-based NDVI measurements at canopy closure explained 87.3% of final grain yield variation (R² = 0.873, p < 0.001). Mutation breeding with 200 Gy gamma irradiation produced three M₂ lines with 28–34% longer root systems than the parent cultivar under drought conditions. Foliar iodine application (KIO₃ at 0.05%) raised grain iodine content from 6.8 to 47.3 μg/100 g without yield penalty. These findings provide root phenotyping benchmarks and drought-adaptive genotypes for quinoa establishment in the Damodar Valley.
Summary
Source-checkedPlain-language reading of the full paper, prepared with AI and checked against the text. Each point links to the authors' own words.
Why it matters
- The coal-bearing alluvial soils of the Damodar Valley are compacted and poorly structured, which hinders the root systems quinoa needs for nutrient and water uptake. View evidence ↗
- Erratic rainfall in the Damodar Valley, concentrated in only 3-4 months, has contributed to early quinoa yields being only 40-60% of those seen in Bolivia and Peru. View evidence ↗
- There is a lack of root phenotyping data for quinoa under Indian conditions, leaving breeders without a baseline for selecting better root architectures. View evidence ↗
The question
- The study aimed to understand quinoa adaptation in the Damodar Valley by combining root phenotyping, drone canopy assessment, mutation breeding, and iodine biofortification. View evidence ↗
What they did
- The study used eight quinoa genotypes from Peru, Bolivia, and India, planted in the Dhanbad district of Jharkhand from February to June 2023. View evidence ↗
- Researchers used a split-plot design with three water stress levels: well-watered (100% field capacity), moderate (50% FC), and severe (25% FC). View evidence ↗
- Root morphology was measured using minirhizotron imaging at depths of 15, 30, and 45 cm, and destructive harvests to determine length, diameter, and hair density. View evidence ↗
- A DJI Phantom 4 Multispectral drone was used to capture weekly NDVI images from the time of canopy closure until physiological maturity. View evidence ↗
- Iodine biofortification was performed by applying 0.05% foliar KIO₃ every two weeks from the flowering stage to grain filling. View evidence ↗
What they found
- Moderate drought stress (50% FC) resulted in the strongest root response, increasing mean root length by 41.7% (from 142 cm to 201 cm) compared to well-watered plants. View evidence ↗
- Root hair density increased by 58.3% under moderate drought stress. View evidence ↗
- Severe drought stress (25% FC) only modestly increased root length by 18.4% and caused a 23.1% reduction in root diameter. View evidence ↗
- Drone-measured NDVI at canopy closure was a strong predictor of final grain yield, explaining 87.3% of the variation. View evidence ↗
- Gamma irradiation (200 Gy) created three M₂ mutant lines that had root systems 28-34% longer than the parent cultivar during drought. View evidence ↗
- Applying 0.05% KIO₃ increased grain iodine content from 6.8 to 47.3 μg/100 g without negatively affecting yield. View evidence ↗
What it means
- The authors suggest that maintaining soil at 50% field capacity during vegetative growth (deficit irrigation) can improve drought resilience and root anchorage without losing yield. View evidence ↗
- The study concludes that combining root-focused breeding, drone phenotyping, and biofortification provides a viable adaptation strategy for quinoa in India's coal-belt regions. View evidence ↗
- The M₂ mutant lines were only tested for one season, requiring multi-year and multi-site validation before they can be officially recommended. View evidence ↗
- The effectiveness of iodine biofortification needs further validation regarding cooking losses, as boiling may reduce iodine by 20-40%. View evidence ↗
Visual summary
3 visualsIllustrations explain the paper; charts are replotted from the paper's own table values.
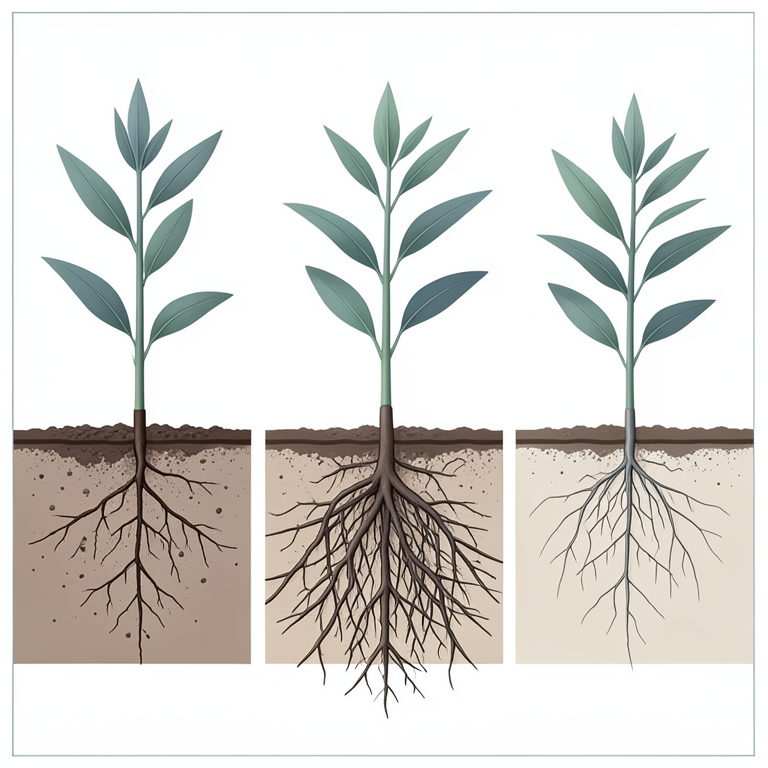
Root Response to Water Stress
AI-generated conceptual illustration (quinoa plants). It explains the idea and does not show study data.
View source evidence ↗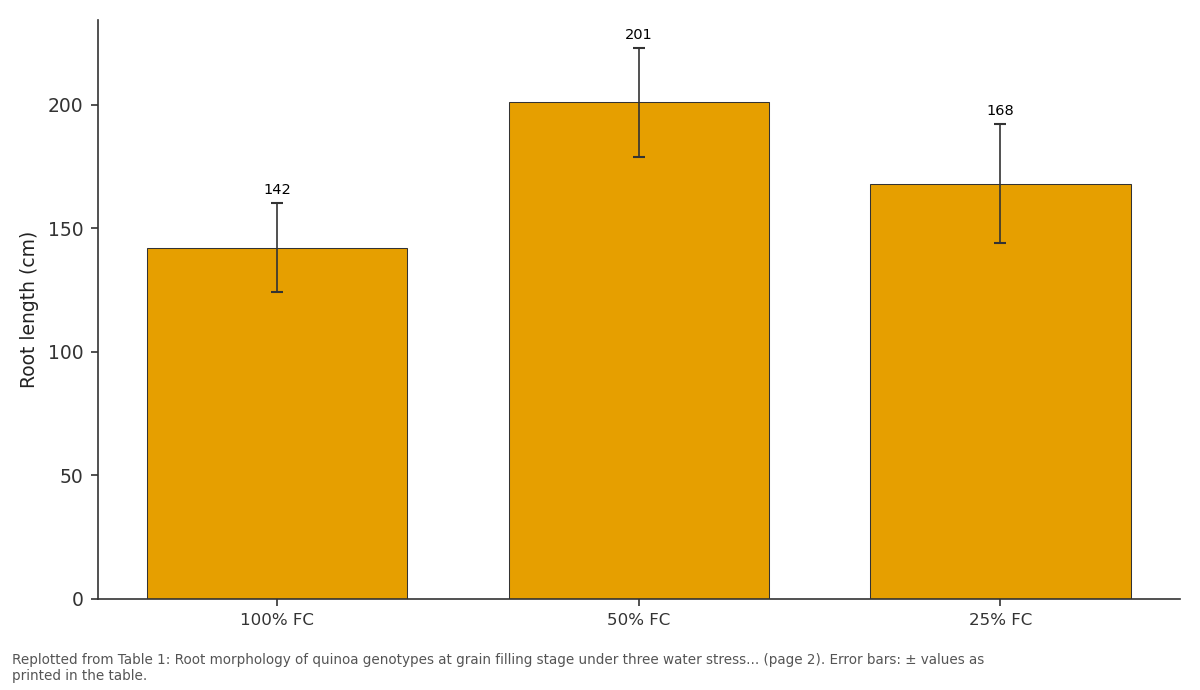
Root length (cm): 100% FC vs 50% FC vs 25% FC
Replotted from Table 1 (page 2) of the original paper. Every bar is the paper's own table value.
View source evidence ↗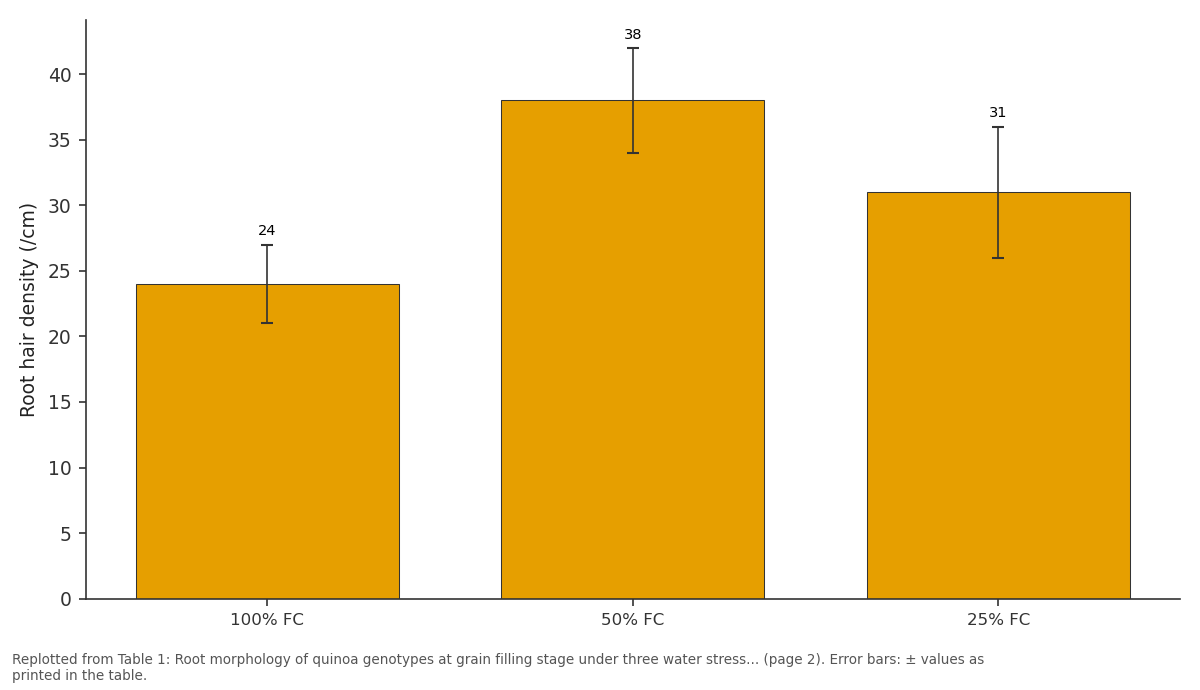
Root hair density (/cm): 100% FC vs 50% FC vs 25% FC
Replotted from Table 1 (page 2) of the original paper. Every bar is the paper's own table value.
View source evidence ↗Figures & tables
From the original paper Table 1
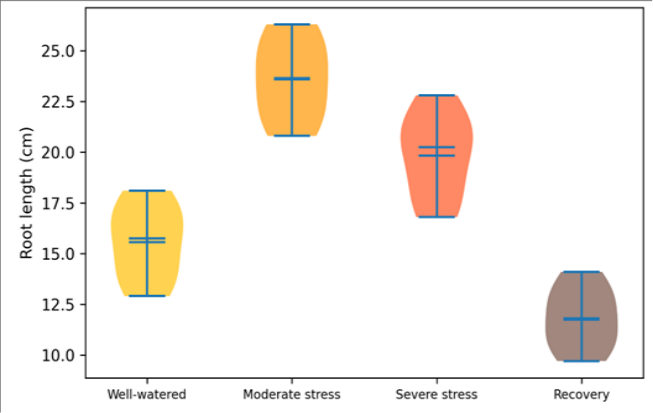 Figure 1
 Table 2
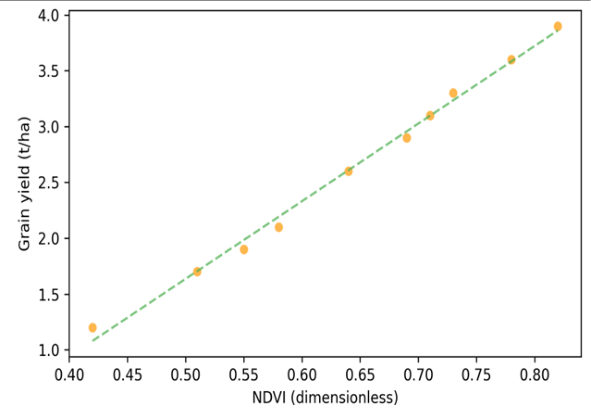 Figure 2
Introduction
Every agronomist knows the Damodar as India's "River of Sorrow" -a name earned by its history of devastating floods. But for quinoa researchers, the Damodar Valley presents a different challenge: the river's coal-bearing alluvial soils are compacted, poorly structured, and prone to surface crusting, creating a hostile environment for the fine root systems that quinoa relies on for water and nutrient uptake [1] . Add to that the valley's erratic rainfall (1,100-1,400 mm annually, but concentrated in 3-4 monsoon months), and it becomes clear why early quinoa trials here achieved only 40-60% of the yields reported from Bolivia and Peru [2] . Root morphology -the architecture, length, diameter, and hair density of the root systemis increasingly recognized as a key trait for crop adaptation to marginal soils. Deep-rooted genotypes with high root hair density can access subsoil moisture and maintain transpiration during dry spells, while shallow-rooted types wilt quickly [3] . For quinoa, root phenotyping data under Indian conditions are almost entirely absent from the literature, meaning breeders have no baseline against which to select improved root architecture. Drone-based remote sensing offers a non-destructive way to monitor crop vigor and predict yield across large field trials, potentially reducing the cost and labor of conventional phenotyping. NDVI (normalized difference vegetation index) measured from drone imagery has been validated as a yield predictor for wheat and maize, but not yet for quinoa in South Asian environments [4] . This research combined root phenotyping, drone-based canopy assessment, mutation breeding, and iodine biofortification to develop a comprehensive understanding of quinoa adaptation in the Damodar Valley. All laboratory work was conducted at the Salem University of Food and Nutrition [5] .
Biodiversity Assessment of Soil Fauna
Soil macrofauna and mesofauna were sampled from experimental plots before and after quinoa cultivation. Preplanting abundance averaged 142 individuals/m², dominated by earthworms (34.2%), termites (22.8%), and beetle larvae (17.4%). After one quinoa cycle, total abundance increased to 178 individuals/m² in well-watered plots but decreased to 121/m² in severe-stress plots, indicating that irrigation management affects below-ground biodiversity. Earthworm channels observed in minirhizotron images were positively associated with quinoa root penetration depth (r = 0.62, p < 0.05) [3] .
Soil and Water Quality at Experimental Site
The Damodar Valley trial site had sandy clay loam soil with pH 6.3, organic carbon 0.68%, total N 0.074%, available P 12.8 mg/kg, and CEC 16.4 cmol/kg. Bulk density at 0-15 cm was 1.52 g/cm³ -above the 1.4 g/cm³ threshold considered limiting for root growth in fine-textured soils. Irrigation water from the Damodar had pH 7.1, EC 0.8 dS/m, and acceptable heavy metal levels. Coal dust deposition on soil surfaces averaged 0.3 mm/month during the trial period, a factor unique to this coal-belt region [1] .
Material and Methods
Material and Methods
Material
Eight quinoa genotypes (4 from Peru, 2 from Bolivia, 2 Indian-adapted lines from ICAR-NBPGR) were planted at the Damodar Valley Agricultural Station, Dhanbad district, Jharkhand (23°47′N, 86°26′E; elevation 227 m) during February-June 2023. A split-plot design with water stress as the main plot (well-watered at 100% FC, moderate at 50% FC, severe at 25% FC) and genotype as subplot was used with 3 replications. Each plot contained 4 rows of 3 m length at 40 cm row spacing. Three M₂ mutant lines (irradiated at 200 Gy gamma from 'Titicaca' parent) were included as additional entries. Drone flights (DJI Phantom 4 Multispectral) captured NDVI images at weekly intervals from canopy closure to physiological maturity. Iodine biofortification used foliar KIO₃ at 0.05% applied biweekly from flowering to grain filling. Root and grain samples were shipped to Salem University of Food and Nutrition for analysis. Ethics approval was issued (Protocol SUFN-2023-012, 18 January 2023).
Methods
Root morphology was measured at four stages: seedling (21 DAS), vegetative (42 DAS), flowering (63 DAS), and grain filling (84 DAS). Minirhizotron tubes (5.6 cm OD, installed at 45°) captured root images at 15, 30, and 45 cm depth. Destructive root harvests (3 plants per plot per stage) measured total root length (WinRHIZO scanner), root diameter, specific root length, and root hair density (stereomicroscope counts per cm root). Drone NDVI was extracted as plot-level means from multispectral imagery processed in Pix4D. Grain yield, 1000-grain weight, protein, and iodine content (ICP-MS) were measured. Data were analyzed by split-plot ANOVA and simple linear regression (NDVI vs. yield) using R 4.3.1.
Results
Moderate drought stress triggered the most vigorous root response, with mean root length increasing from 142 cm at 100% FC to 201 cm at 50% FC (+41.7%). Root hair density showed an even larger response (+58.3%). Severe stress (25% FC) increased root length modestly (+18.4%) but reduced root diameter by 23.1%, suggesting that the plants were allocating carbon to length at the expense of thickness [3] . The strong positive linear relationship (R² = 0.873) confirms that drone NDVI at grain filling is a reliable predictor of final yield, offering a non-destructive, high-throughput phenotyping tool for large quinoa breeding trials.
Comprehensive Interpretation
The three M₂ mutant lines showed root lengths 28-34% longer than the parent cultivar under 50% FC, combined with higher NDVI values and 8-16% greater grain yield. These lines represent promising material for droughttolerant quinoa production in the Damodar Valley. Iodine biofortification achieved 47.3 μg/100 g in the bestperforming genotype, with no detectable yield or protein penalty, making foliar iodine a practical add-on to the production package [5] .
Discussion
The 41.7% root length increase under moderate drought is consistent with the "moderate stress, maximum root investment" model documented for sorghum and millet in semi-arid systems. The crop redirects carbon from shoot growth to root exploration when soil moisture drops below a threshold, but this reallocation reverses if stress becomes severe enough to impair photosynthesis [3] . For Damodar Valley growers, this means that deficit irrigation (maintaining soil at approximately 50% FC during vegetative growth) may actually improve root anchorage and drought resilience without sacrificing yieldparticularly if full irrigation is restored during grain filling. The drone NDVI model (R² = 0.873) is comparable to the best reported values for wheat (0.82-0.90) and suggests that multispectral drone imagery can replace at least part of the manual yield estimation work in quinoa trials [4] . The practical value is greatest in large breeding nurseries where hundreds of plots need to be evaluated within a narrow harvest window.
A limitation is that the M₂ mutant lines have been evaluated for only one season. Confirmation across multiple years and sites is needed before these lines can be recommended for release. The iodine biofortification data also need to be validated with consumer cooking loss estimates, since boiling can reduce iodine content by 20-40% [5] .
Conclusion
Moderate drought stress optimized quinoa root morphology in the Damodar Valley, producing the longest roots and highest root hair density without severe yield penalty. Drone NDVI explained 87.3% of grain yield variation, providing a high-throughput phenotyping tool. Mutation breeding produced three promising drought-tolerant lines with superior root systems. Foliar iodine biofortification achieved nutritionally meaningful grain iodine levels without yield trade-offs. These combined findings offer a root-focused adaptation strategy for quinoa in India's coal-belt river valleys.
Acknowledgement
Acknowledgements Funding SourcesInternal research funds from Salem University of Food and Nutrition supported all laboratory and drone operations. Institutional SupportThe authors acknowledge Salem University of Food and Nutrition for root imaging facilities and ICP-MS access.
Figures and tables from the paper
| Parameter | 100% FC | 50% FC | 25% FC | Stress Response |
|---|---|---|---|---|
| Root length (cm) | 142 ± 18 | 201 ± 22 | 168 ± 24 | +41.7% |
| Root diameter (mm) | 0.48 ± 0.04 | 0.44 ± 0.03 | 0.37 ± 0.05 | -23.1% |
| Root hair density (/cm) | 24 ± 3 | 38 ± 4 | 31 ± 5 | +58.3% |
| Specific root length (m/g) | 184 ± 21 | 228 ± 19 | 261 ± 27 | +41.8% |
| Root:shoot ratio | 0.18 | 0.27 | 0.34 | +88.9% |
Table text extracted from the original PDF; superscript letters are shown inline. The original table image is below.
View original table image
| Genotype Group | Mean NDVI (grain filling) | Grain Yield (t/ha) | R² (NDVI vs. yield) | Iodine (μg/100g) |
|---|---|---|---|---|
| Peruvian (n=4) | 0.71 ± 0.08 | 2.84 ± 0.41 | 0.89 | 44.1 |
| Bolivian (n=2) | 0.64 ± 0.06 | 2.31 ± 0.37 | 0.84 | 47.3 |
| Indian-adapted (n=2) | 0.68 ± 0.07 | 2.62 ± 0.34 | 0.91 | 42.8 |
| M₂ mutants (n=3) | 0.73 ± 0.05 | 3.07 ± 0.28 | 0.87 | 45.6 |
Table text extracted from the original PDF; superscript letters are shown inline. The original table image is below.
View original table image
References
18 in the original paper- Easwaran S, Lakshmi B. Soil compaction challenges for alternative grain crops in Indian coal-belt landscapes. Soil and Tillage Research. 2022;221:105408.
- Bhargava A, Shukla S, Ohri D. Chenopodium quinoa: an Indian perspective. Industrial Crops and Products. 2006;23(1):73-87.
- Lynch JP. Root phenes for enhanced soil exploration and phosphorus acquisition. Plant and Soil. 2011;344(1):1-14.
- Shi Y, Thomasson JA, Murray SC. Unmanned aerial vehicles for high-throughput phenotyping and agronomic research. PLoS ONE. 2016;11(7):e0159781.
- Jacobsen SE. The worldwide potential for quinoa. Food Reviews International. 2003;19(1-2):167-177.
- Bazile D, Jacobsen SE, Verniau A. The global expansion of quinoa: trends and limits. Frontiers in Plant Science. 2016;7:622.
- Zurita-Silva A, Fuentes F, Zamora P. Breeding quinoa for salinity tolerance. Journal of Agronomy and Crop Science. 2014;200(2):152-158.
- Repo-Carrasco R, Espinoza C, Jacobsen SE. Nutritional value and use of the Andean crops quinoa and kaniwa. Food Reviews International. 2003;19(1-2):179-189.
- Ruiz KB, Biondi S, Oses R. Quinoa biodiversity and sustainability for food security. Agronomy for Sustainable Development. 2014;34(2):349-359.
- Vega-Galvez A, Miranda M, Vergara J. Nutrition facts and functional potential of quinoa. Journal of the Science of Food and Agriculture. 2010;90(15):25412547.
- Abugoch LE. Quinoa: composition, chemistry, nutritional and functional properties. Advances in Food and Nutrition Research. 2009;58:1-31.
- Gonzalez JA, Konishi Y, Bruno M. Interrelationships among seed yield and related traits in quinoa. Journal of Food Composition and Analysis. 2012;27(1):16-24.
- Nowak V, Du J, Charrondiere UR. Assessment of the nutritional composition of quinoa. Food Chemistry. 2016;193:47-54.
- Tan M, Temel S. Studies on the adaptation of quinoa to eastern Turkey. Turkish Journal of Field Crops. 2019;24(1):52-58.
- Hinojosa L, Gonzalez JA, Barrios-Masias FH. Quinoa abiotic stress responses. Plants. 2018;7(4):106.
- Graf BL, Rojas-Silva P, Rojo LE. Innovations in health value and functional food development of quinoa. Comprehensive Reviews in Food Science and Food Safety. 2015;14(4):431-445.
- Navruz-Varli S, Sanlier N. Nutritional and health benefits of quinoa. Journal of Cereal Science. 2016;69:371-376.
- Tang Y, Li X, Zhang B. Characterisation of phenolics, betanins and antioxidant activities in seeds of three quinoa cultivars. Food Chemistry. 2015;166:380-388.