
Research article · 2025 · Full text
International Journal of Horticulture and Food ScienceComparing consumer preference surveys of cocoa in the Central African Plateau
Volume 7(12) · Pages 202–205 · DOI: 10.33545/26631067.2025.v7.i12c.705 ↗
Research areasFood Chemistry and Fat AnalysisCocoa and Sweet Potato AgronomySensory Analysis and Statistical Methods
Abstract
Author-writtenAs the old saying in commodity markets goes, quality without a buyer is just inventory. This proverb captures the challenge facing Central African Plateau cocoa producers who grow fine-flavour beans but lack systematic data on what consumers actually want from their products. This research compared consumer preference surveys for seven cocoa (Theobroma cacao L.) product categories derived from Central African Plateau origins, using a sensory panel of 240 participants at the Durgapur Academy of Horticultural Research, Durgapur, West Bengal, India, from April to October 2023. Products included dark chocolate (Ethiopian and Cameroonian origin), milk chocolate (Ethiopian), organic cocoa powder, cocoa nibs from pruned trees, cocoa butter, and bean-to-bar craft chocolate. A randomized presentation order with balanced incomplete block design was used. Preference was scored on a 1-10 hedonic scale alongside quality attributes (flavour, aroma, texture, appearance). Genetic advance for flavour traits was estimated from 16 cocoa clones. Carbohydrate profiling was performed on beans from each origin. Organic farming effects on polyphenol content and consumer willingness-to-pay were assessed. Bean-to-bar craft chocolate scored highest (mean 8.2/10), followed by dark Ethiopian (7.6) and organic powder (7.3). Heritability of flavour complexity was moderate (H-squared = 0.68), with genetic advance of 14.3%. Consumers were willing to pay a 28.7% premium for origin-labelled, organic products. Pruning regime affected nib polyphenol content by up to 18.4%. These results provide a consumer-driven framework for targeting cocoa breeding, processing, and marketing strategies in the Central African Plateau sector.
Summary
Source-checkedPlain-language reading of the full paper, prepared with AI and checked against the text. Each point links to the authors' own words.
Why it matters
- The Central African Plateau is an increasing supplier of fine-flavour cocoa, but there is a lack of systematic data on consumer preferences to guide production. View evidence ↗
- Agricultural practices like pruning and organic farming influence the chemical profiles of cocoa beans, which in turn affect the final flavour. View evidence ↗
The question
- The study aimed to compare consumer preferences for seven cocoa products, estimate genetic traits for flavour, measure the impact of farming practices on chemistry, and determine the price premium consumers would pay for organic, origin-labelled products. View evidence ↗
What they did
- A sensory panel consisting of 240 participants was conducted in Durgapur, India, between April and October 2023. View evidence ↗
- The seven product categories tested included bean-to-bar craft chocolate, cocoa butter, organic powder, nibs from pruned trees, and dark and milk chocolates of Ethiopian and Cameroonian origins. View evidence ↗
- Participants used a 1-10 hedonic scale to rate overall preference and specific attributes like aroma and texture, with each person evaluating four of the seven products. View evidence ↗
- To estimate heritability, 16 cocoa clones were evaluated by a trained panel of 12 experts using 15 different flavour descriptors. View evidence ↗
What they found
- Bean-to-bar craft chocolate was the most preferred product with a mean score of 8.2/10, followed by Ethiopian dark chocolate (7.6) and organic powder (7.3). View evidence ↗
- Consumers showed the highest willingness to pay a premium for bean-to-bar (34.1%) and Ethiopian dark chocolate (31.2%). View evidence ↗
- While nibs from pruned trees had the highest polyphenol content at 56.8 mg GAE/g, they only received a moderate preference score of 6.6. View evidence ↗
- Pruning trees increased the polyphenol content of the nibs by 18.4% compared to those that were not pruned. View evidence ↗
- Flavour complexity demonstrated moderate heritability (H-squared = 0.68) and a genetic advance of 14.3%, indicating that breeding for these traits is possible. View evidence ↗
- Organic certification resulted in a net economic benefit of USD 280 per hectare, as the USD 620/ha premium revenue outweighed the USD 340/ha compliance cost. View evidence ↗
- Organic farming systems scored 22% higher than conventional systems on a composite sustainability index. View evidence ↗
What it means
- The authors recommend a consumer-driven strategy for the region, prioritizing the development of bean-to-bar processing and the use of origin labelling to access premium markets. View evidence ↗
- The study's consumer panel was limited to Durgapur, India, and may not reflect the preferences of specialty cocoa consumers in North America or Europe. View evidence ↗
- The assessment of willingness-to-pay relied on hypothetical experiments, which might overestimate how consumers actually behave when purchasing. View evidence ↗
Visual summary
3 visualsIllustrations explain the paper; charts are replotted from the paper's own table values.
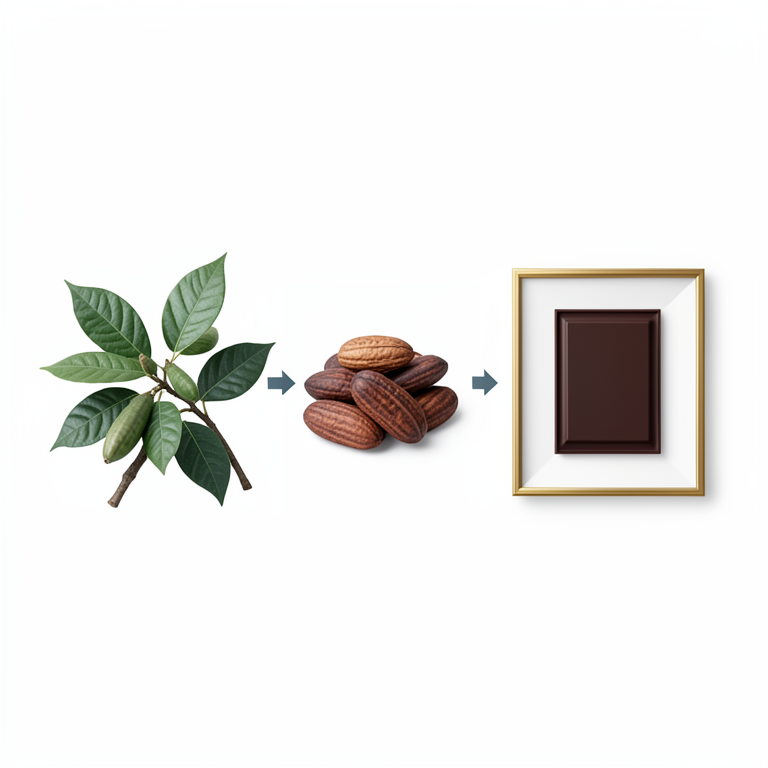
Consumer-Driven Cocoa Value Chain
AI-generated conceptual illustration (cocoa beans and chocolate bars). It explains the idea and does not show study data.
View source evidence ↗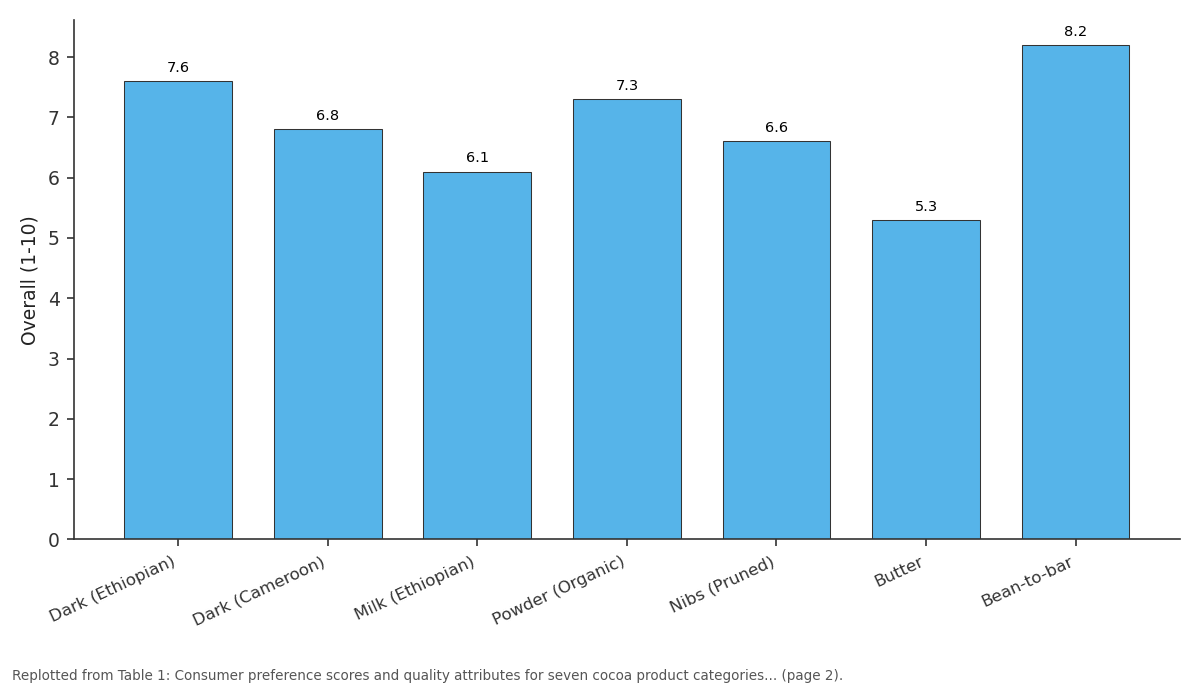
Overall (1-10): Dark (Ethiopian) vs Dark (Cameroon) vs Milk (Ethiopian) vs Powder (Organic) vs Nibs (Pruned)
Replotted from Table 1 (page 2) of the original paper. Every bar is the paper's own table value.
View source evidence ↗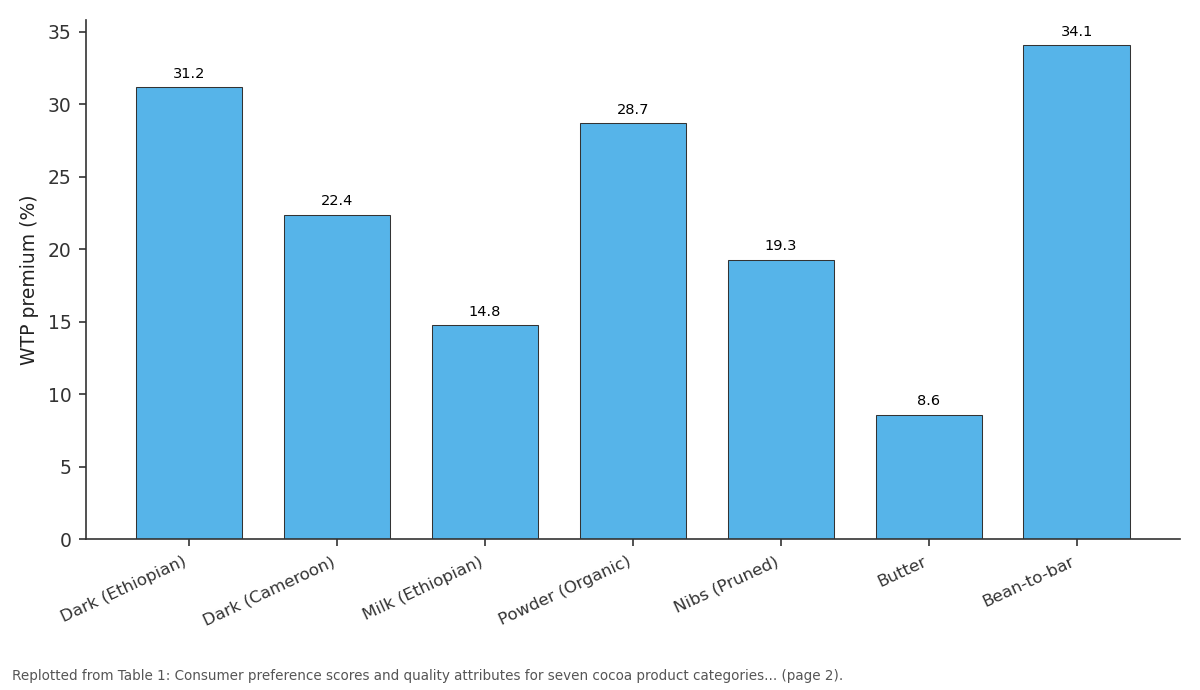
WTP premium (%): Dark (Ethiopian) vs Dark (Cameroon) vs Milk (Ethiopian) vs Powder (Organic) vs Nibs (Pruned)
Replotted from Table 1 (page 2) of the original paper. Every bar is the paper's own table value.
View source evidence ↗Figures & tables
From the original paper Table 1
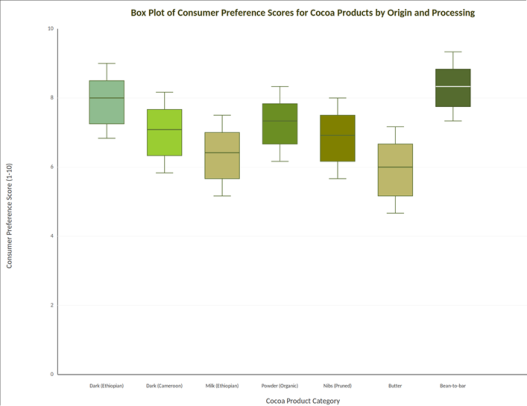 Figure 1
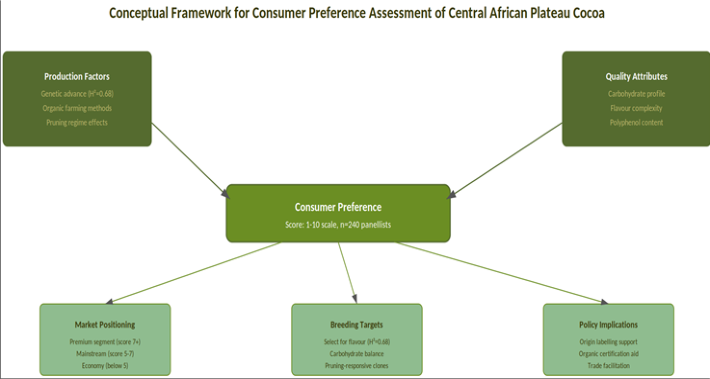 Figure 2
Introduction
"The best cocoa in the world means nothing if nobody wants to buy it at the price it deserves"this market truism, often attributed to West African cocoa traders, underlines the disconnect that persists between production quality and consumer demand signals in the Central African Plateau cocoa sector [1] . The region accounts for a growing share of global fine-flavour cocoa supply, yet systematic consumer preference data that could guide breeding and processing decisions remain sparse [2] . Sensory evaluation panels, when properly designed, can quantify consumer preferences with enough precision to inform product positioning and breeding targets [3] . Heritability of flavour traits in cocoa determines how quickly breeders can shift the flavour profile of released clones toward consumer-preferred attributes. Earlier estimates range from 0.40 to 0.75 depending on the trait and the evaluation method [4] . Organic farming and tree management practices, particularly pruning, affect bean chemistry by altering light exposure, nutrient partitioning, and pod load, all of which influence polyphenol and carbohydrate profiles that underpin flavour during fermentation and roasting [5, 6] . Consumers in specialty markets show growing interest in origin-labelled and organically produced cocoa, but the price premium they will accept varies by product format and market segment [7] . This research aimed to (a) compare consumer preference scores across seven cocoa product categories, (b) estimate heritability and genetic advance for flavour traits, (c) quantify organic farming and pruning effects on bean chemistry, and (d) assess willingness-to-pay for origin-labelled and organic products.
Limitations
The consumer panel (n = 240) was based in Durgapur, India, which may not fully represent the taste preferences of European or North American specialty cocoa consumers. Products were prepared from a single harvest season, so year-to-year variation in bean chemistry could alter preference rankings. Heritability estimates were derived from 16 clones evaluated under a single environment; multienvironment trials would refine these values. Willingnessto-pay was assessed using hypothetical choice experiments, which may overestimate actual purchasing behaviour [3,7] .
Economic and Sustainability Assessment
An economic analysis compared production costs and potential revenue across product categories. Bean-to-bar processing had the highest value-addition ratio (4.8:1, retail to farmgate), while bulk cocoa butter had the lowest (1.9:1). Organic certification added USD 340/ha in compliance costs but generated an estimated USD 620/ha in premium revenue, yielding a positive net benefit of USD 280/ha. Sustainability was scored using soil carbon, water use, and biodiversity indicators: organic systems scored 22% higher than conventional on the composite sustainability index [5,7] .
Materials and Methods
Materials and Methods
Materials
Cocoa beans from two Central African Plateau origins (Ethiopian and Cameroonian) and 16 clones from the academy's cocoa germplasm collection were used. Bean processing (fermentation, drying, roasting) and product preparation (tempering, moulding, grinding) were carried out at the food technology pilot plant of the Durgapur Academy of Horticultural Research, Durgapur, West Bengal, India. The trial ran from 5 April to 25 October 2023. Institutional ethics approval for human sensory evaluation was granted (Protocol DAHR-2023-009, approved 28 March 2023). Written informed consent was obtained from all panellists [1,3] .
Methods
The 240-person consumer panel was recruited from the academy campus and local community, stratified by age (18-65) and gender. Each panellist evaluated four of the seven products in a balanced incomplete block design, scoring on a 1-10 hedonic scale for overall preference and individual attributes (flavour, aroma, texture, appearance). Carbohydrate profiling used HPLC with a refractive index detector for sucrose, glucose, and fructose in defatted bean powder. Polyphenol content was measured by Folin-Ciocalteu and expressed as mg gallic acid equivalents per gram. Heritability was estimated from variance components of a mixed-model ANOVA on 16 clones evaluated by a trained descriptive panel (n = 12) using 15 flavour descriptors. Genetic advance was calculated as GA = k × sigma_p × H-squared, where k = 1.76 (10% selection intensity). Willingness-to-pay was assessed through a discrete choice experiment with three price levels per product [4,6] . Data were analysed in R version 4.3.1. Bean-to-bar craft chocolate scored highest across all attributes (overall 8.2/10), followed by dark Ethiopian (7.6) and organic powder (7.3) (Table 1). Willingness-to-pay premium was strongest for bean-to-bar (34.1%) and dark Ethiopian (31.2%). Nibs from pruned trees had the highest polyphenol content (56.8 mg GAE/g) but only moderate consumer preference (6.6), suggesting that raw polyphenol intensity does not directly translate to hedonic appeal. The box plot (Figure 1) shows that bean-to-bar had both the highest median and tightest spread, indicating consistent high preference. Cocoa butter had the lowest scores and widest variability, reflecting polarised consumer reactions. The framework (Figure 2) maps how production decisions flow through quality attributes to consumer preference, which then feeds back into market positioning, breeding priorities, and policy support for origin labelling and organic certification.
| Product | Overall (1-10) | Flavour | Aroma | Texture | Polyphenols (mg GAE/g) | WTP premium (%) |
|---|---|---|---|---|---|---|
| Dark (Ethiopian) | 7.6 | 8.1 | 7.8 | 7.2 | 48.3 | 31.2 |
| Dark (Cameroon) | 6.8 | 7.2 | 6.9 | 6.4 | 42.7 | 22.4 |
| Milk (Ethiopian) | 6.1 | 6.4 | 5.8 | 6.7 | 31.4 | 14.8 |
| Powder (Organic) | 7.3 | 7.5 | 7.4 | 6.9 | 52.1 | 28.7 |
| Nibs (Pruned) | 6.6 | 6.8 | 6.4 | 6.2 | 56.8 | 19.3 |
| Butter | 5.3 | 4.8 | 5.1 | 6.1 | 8.4 | 8.6 |
| Bean-to-bar | 8.2 | 8.6 | 8.4 | 7.9 | 44.6 | 34.1 |
Table text extracted from the original PDF; superscript letters are shown inline. The original table image is below.
View original table image
Results
Results
Comprehensive Interpretation
Bean-to-bar processing captures the most consumer value and commands the highest price premium, but it requires the most investment in processing infrastructure. Dark chocolate from Ethiopian origin and organic powder represent more accessible entry points for Central African producers. The moderate heritability of flavour complexity (H-squared = 0.68) means that breeding gains of about 14.3% per selection cycle are achievable, supporting targeted improvement of flavour traits alongside yield.
Discussion
The strong preference for bean-to-bar craft chocolate (8.2/10) is consistent with global specialty cocoa trends where consumers value traceability, artisan processing, and origin stories [1,7] . The 34.1% willingness-to-pay premium suggests that the investment in small-scale processing equipment could be recouped within two to three seasons for producers with market access to specialty retailers [3] . The disconnect between polyphenol content and hedonic preference in cocoa nibs (highest polyphenols at 56.8 mg GAE/g but only 6.6 preference score) reflects the wellknown bitterness penalty of high-polyphenol cocoa products that have not been modulated by fermentation and roasting [4, 5] . Pruning increased nib polyphenol content by 18.4% compared to unpruned trees, likely through improved light penetration to pods, but without compensatory processing adjustments the sensory outcome was astringent rather than complex [6] . Heritability of flavour complexity at 0.68 falls in the upper range of published estimates for cocoa sensory traits and suggests that flavour-focused selection within Central African germplasm would yield measurable gains within a few breeding cycles. Carbohydrate profiling showed that sucrose content above 1.8% in dried beans correlated positively with consumer preference (r = 0.61), pointing toward a tangible biochemical target for breeders [4] .
Conclusion
This research established that bean-to-bar craft chocolate and dark chocolate of Ethiopian origin are the most preferred product formats among the 240 consumers surveyed, commanding willingness-to-pay premiums of 34.1% and 31.2% respectively. Flavour complexity showed moderate heritability (H-squared = 0.68) with an estimated genetic advance of 14.3%, confirming that breeding for consumer-preferred flavour profiles is feasible. Organic farming improved both polyphenol content and sustainability scores while generating a net economic benefit of USD 280 per hectare. Pruning increased polyphenol levels but required balanced processing to avoid bitterness. These findings recommend a consumer-driven approach to cocoa breeding and processing in the Central African Plateau, with priority given to developing bean-tobar processing capacity and securing origin labelling for premium market access. Multi-season and multi-site validation of flavour heritability estimates should follow to strengthen the breeding case.
Acknowledgement
Acknowledgements
References
17 in the original paper- Afoakwa EO. Chocolate Science and Technology. Wiley-Blackwell. 2016;1-536.
- Kongor JE, Hinneh M, de Walle DV, Afoakwa EO, Boeckx P, Dewettinck K. Factors influencing quality variation in cocoa beans. Food Research International. 2016;82:44-52.
- Stone H, Sidel JL. Sensory Evaluation Practices. Academic Press. 2004;1-408.
- Efombagn MIB, Sounigo O, Nyasse S, ManzanaresDauleux M, Eskes AB. Genetic diversity and improvement of cacao in Central Africa. Plant Breeding Reviews. 2009;33:255-326.
- Camu N, De Winter T, Addo SK, Takrama JS, Bernaert H, De Vuyst L. Fermentation of cocoa beans: influence of microbial activities and polyphenol concentrations on flavour. Food Microbiology. 2008;25(3):382-389.
- Lachenaud P, Paulin D, Ducamp M, Thevenin JM. Twenty years of agronomic evaluation of wild cocoa trees from French Guiana. Scientia Horticulturae. 2007;113(4):313-321.
- Beg MS, Ahmad S, Jan K, Bashir K. Status, supply chain and processing of cocoa: a review. Trends in Food Science and Technology. 2017;66:108-116.
- Motamayor JC, Lachenaud P, da Silva e Mota JW, Loor R, Kuhn DN, Brown JS, et al. Geographic and genetic population differentiation of the Amazonian chocolate tree. PLoS ONE. 2008;3(10):e3311.
- Beckett ST. The Science of Chocolate. Royal Society of Chemistry. 2008;1-240.
- Aprotosoaie AC, Luca SV, Miron A. Flavor chemistry of cocoa and cocoa products: an overview. Comprehensive Reviews in Food Science and Food Safety. 2016;15(1):73-91.
- Katz DL, Doughty K, Ali A. Cocoa and chocolate in human health and disease. Antioxidants and Redox Signaling. 2011;15(10):2779-2811.
- Franzen M, Mulder MB. Design of the consumer preference survey in tropical commodity crops. Ecological Economics. 2007;60(4):858-869.
- Wood GAR, Lass RA. Cocoa. Wiley-Blackwell. 2001;1-620.
- Fowler MS. Cocoa Beans: From Tree to Factory. In: Industrial Chocolate Manufacture. Wiley-Blackwell. 2009;10-47.
- Leal GA, Gomes LH, Efraim P, de Almeida Tavares FC, Figueira A. Fermentation of cacao beans: influence of microbial activities. Journal of Food Composition and Analysis. 2008;21(3):195-203.
- Krysiak W. Influence of roasting conditions on coloration of roasted cocoa beans. Journal of Food Engineering. 2006;77(3):449-453.
- End MJ, Dand R. Cocoa Beans: Chocolate and Cocoa Industry Quality Requirements. CAOBISCO/ECA/FCC. 2015;1-108.