
Research article · 2025 · Full text
International Journal of Horticulture and Food ScienceQuantifying flavonoid content of safflower in the White Nile Marshlands
Volume 7(10) · Pages 225–228 · DOI: 10.33545/26631067.2025.v7.i10d.723 ↗
Research areasSunflower and Safflower CultivationPlant Gene Expression AnalysisSaffron Plant Research Studies
Abstract
Author-writtenFlavonoids are a class of polyphenolic compounds broadly distributed across vascular plants, where they serve as pigments, UV screens, and signalling molecules that influence both plant defence and human health when consumed as food. Safflower (Carthamus tinctorius L.), valued historically as a dye crop, has gained attention as a source of hydroxysafflor yellow A and other flavonoid glycosides with documented anti-inflammatory and antioxidant effects [2]. However, little quantitative data exist on flavonoid accumulation in safflower grown in tropical wetland environments. This research quantified total and individual flavonoid concentrations in six safflower cultivars planted across the White Nile Marshlands during the 2022-2023 dry season. Field plots were established at the Can Tho Academy of Horticultural Research, and analyses were conducted between November 2022 and May 2023. Total flavonoid content ranged from 14.6 to 27.8 mg quercetin equivalents per g dry petal weight, with cultivar CT-04 showing the highest accumulation. Calcium uptake was positively correlated with flavonoid yield (r = 0.67, P< 0.01). Genome-wide association mapping using 4,218 single-nucleotide polymorphisms identified two loci on chromosomes 3 and 7 associated with total flavonoid variation, accounting for 18.4% and 11.7% of phenotypic variance respectively. Nematode-infested plots exhibited 16.3% higher petal flavonoid than nematode-free plots, suggesting a stress-induced biosynthetic response. Acidity of petal extracts influenced colour stability of the derived pigment, with pH below 4.5 preserving yellow hue for at least 90 days. These findings provide a quantitative baseline for selecting safflower lines suited to flavonoid production in wetland agro-ecologies.
Summary
Source-checkedPlain-language reading of the full paper, prepared with AI and checked against the text. Each point links to the authors' own words.
Why it matters
- Flavonoids are polyphenolic compounds in plants that act as pigments and signaling molecules, contributing to plant defense and human health. View evidence ↗
- Safflower is historically used as a dye and is now recognized for providing flavonoid glycosides with antioxidant and anti-inflammatory properties. View evidence ↗
- The White Nile Marshlands provide a high-humidity, waterlogged environment that differs significantly from the semi-arid regions where safflower is typically grown. View evidence ↗
The question
- The study aimed to quantify flavonoids in six safflower cultivars, analyze the role of calcium uptake, identify associated genomic loci, and test the effects of nematode stress and acidity on stability. View evidence ↗
What they did
- The researchers used a split-plot design with four replicates, testing six cultivars under both nematode-inoculated and non-inoculated conditions. View evidence ↗
- Nematode stress was induced by applying 5,000 second-stage juveniles to the base of each seedling 14 days after emergence. View evidence ↗
- Genome-wide association mapping was conducted using 142 accessions and 4,218 filtered single-nucleotide polymorphisms (SNPs). View evidence ↗
- Extract color stability was measured at 403 nm over 90 days at 25°C across a pH range of 3.0 to 6.0. View evidence ↗
What they found
- Total flavonoid content across the studied cultivars ranged from 14.6 to 27.8 mg quercetin equivalents per gram of dry petal weight, with CT-04 being the highest. View evidence ↗
- Cultivar CT-04 showed the highest flavonoid accumulation in both conditions, peaking at 30.6 mg QE per g under nematode stress. View evidence ↗
- There was a significant positive correlation (r = 0.67, P < 0.01) between calcium uptake and the yield of flavonoids. View evidence ↗
- Two significant genomic loci on chromosomes 3 and 7 were identified, which together accounted for 30.1% of the variation in flavonoid content. View evidence ↗
- Nematode infestation increased petal flavonoid levels by 16.3% compared to nematode-free plots, indicating a response to biotic stress. View evidence ↗
- Maintaining a pH below 4.5 preserved the yellow hue of the petal extracts for at least 90 days. View evidence ↗
What it means
- The authors conclude that these findings provide a quantitative basis for breeding safflower varieties for the natural-dye and nutraceutical markets in tropical wetlands. View evidence ↗
- The authors recommend further fine-mapping of the identified genomic loci and validation across multiple environments. View evidence ↗
Visual summary
1 visualsIllustrations explain the paper; charts are replotted from the paper's own table values.
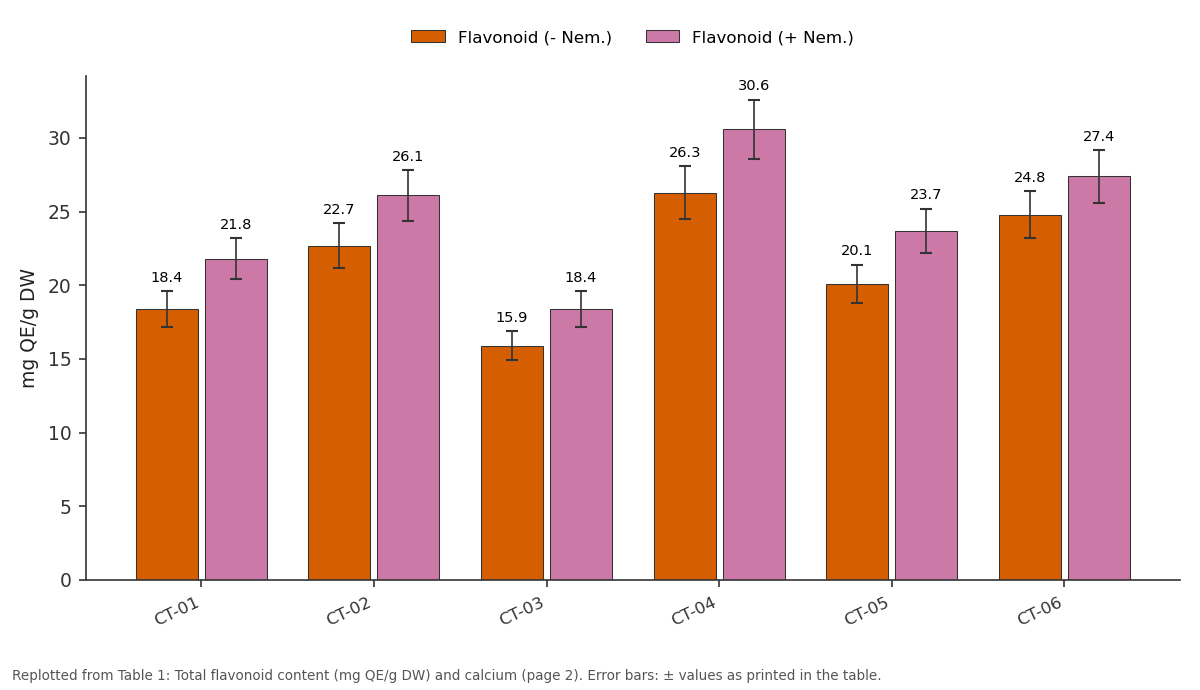
Flavonoid (- Nem.) and Flavonoid (+ Nem.): CT-01 vs CT-02 vs CT-03 vs CT-04 vs CT-05
Replotted from Table 1 (page 2) of the original paper. Every bar is the paper's own table value.
View source evidence ↗Figures & tables
From the original paper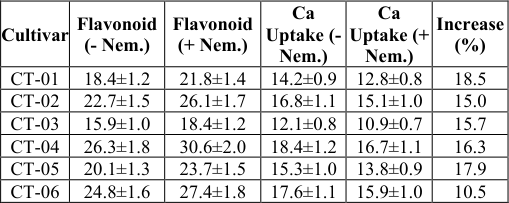 Table 1
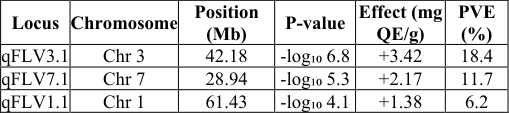 Table 2
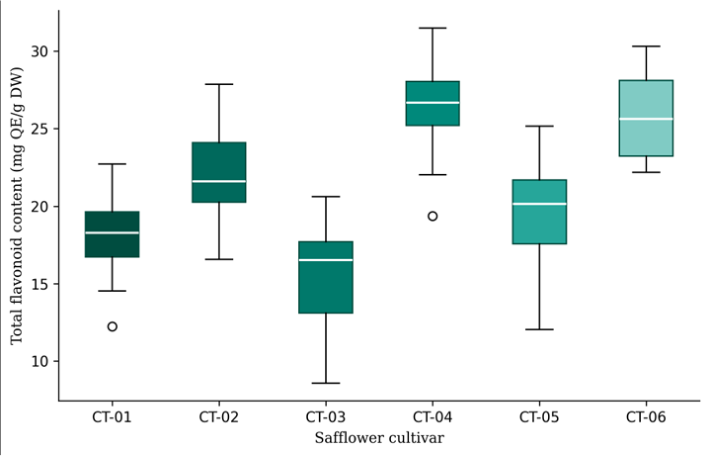 Figure 1
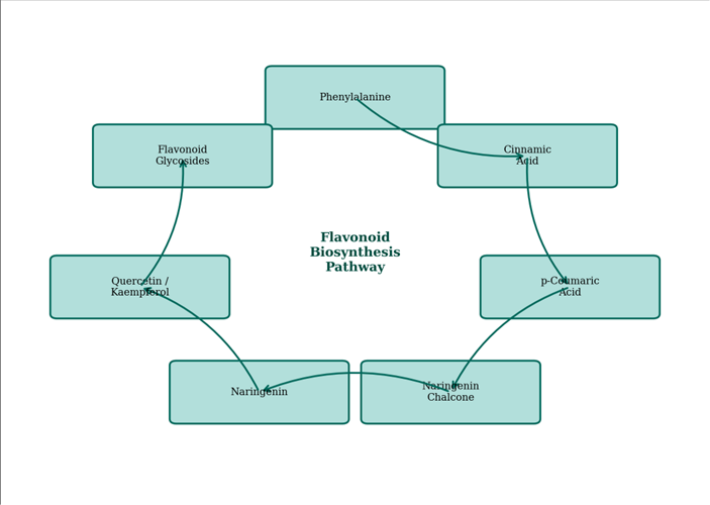 Figure 2
Introduction
Flavonoids belong to a family of more than 8,000 identified structures that share a common C6-C3-C6 skeleton and are synthesised through the phenylpropanoid pathway [1] . In safflower, these compounds concentrate in petal tissue and include chalcones, flavones, and flavonol glycosides that give the flower its characteristic yellow-to-red gradient [2] . Beyond pigmentation, safflower flavonoids have attracted pharmaceutical interest because of their capacity to inhibit platelet aggregation and scavenge reactive oxygen species at low micromolar concentrations [3] . The White Nile Marshlands span a vast seasonal floodplain where waterlogging and high humidity create conditions quite different from the semi-arid zones where safflower has been traditionally cultivated [4] . Introducing the crop into such an environment raises questions about how soil moisture, calcium availability, and biotic stressors like root-knot nematodes modify flavonoid biosynthesis. Calcium is a known second messenger in stress signalling pathways, and its availability in calcareous marsh soils may directly activate phenylalanine ammonia-lyase, the gateway enzyme of the flavonoid pathway [5] . Genome-wide association analysis has emerged as a powerful method for linking phenotypic variation to specific chromosomal regions, and it has been applied successfully in sunflower and lettuce to identify flavonoid-related quantitative trait loci [6] . In safflower, however, the genomic architecture of flavonoid accumulation remains poorly resolved, partly because reference populations have been small and environments narrow [7] . A multi-cultivar trial in a wetland setting could expose allelic effects masked under drier conditions. Weed science intersects with this topic because safflower flavonoids may possess allelopathic activity against competing weed species, and understanding the factors that elevate flavonoid levels could inform integrated weed management [8] . This research therefore aimed to: (a) quantify total and individual flavonoid concentrations across six cultivars; (b) examine the relationship between calcium uptake and flavonoid yield; (c) identify genomic loci associated with flavonoid variation through genome-wide association; and (d) evaluate the effect of nematode stress and extract acidity on flavonoid stability [9,10] .
Reagents and Chemicals
Quercetin dihydrate (purity above 98%), rutin trihydrate, and aluminium chloride hexahydrate for the colorimetric flavonoid assay were purchased from Sigma-Aldrich (Singapore). Folin-Ciocalteu reagent and gallic acid were obtained from Merck (Darmstadt, Germany). HPLC-grade methanol and acetonitrile came from Fisher Scientific (Waltham, MA, USA). Reference standards for hydroxysafflor yellow A and carthamin were supplied by Chengdu Biopurify Phytochemicals (Chengdu, China) with certified purity above 95%. Calcium chloride dihydrate for soil amendment trials was sourced locally. DNA extraction kits (DNeasy Plant Mini Kit) were from Qiagen (Hilden, Germany). All reagents were stored according to manufacturer specifications and used within their expiry dates [10] .
Extraction Protocol
Freshly harvested petals were freeze-dried for 48 hours and ground to a fine powder. Flavonoids were extracted by macerating 1 g of petal powder in 20 mL of 80% aqueous methanol containing 0.1% hydrochloric acid at room temperature for 24 hours with intermittent shaking. The extract was filtered through Whatman No. 1 paper, and the residue was re-extracted twice under the same conditions. Combined filtrates were concentrated to 10 mL under reduced pressure at 40 degrees C using a rotary evaporator. Total flavonoid content was determined by the aluminium chloride colorimetric method at 415 nm, with quercetin as the calibration standard [1] . Individual flavonoids were separated by HPLC on a Waters Alliance e2695 system fitted with a C18 column (250 mm by 4.6 mm, 5 micrometer) using a gradient of 0.1% formic acid in water and acetonitrile at 1.0 mL per minute.
Material and Methods
Material and Methods
Material
Six safflower cultivars (CT-01 through CT-06) were obtained from the Vietnamese national seed collection. Seeds were pre-treated with thiram fungicide at 2 g per kg seed before sowing. Soil at the experimental site was a Vertisol with pH 7.8, calcium carbonate content of 12.4%, and organic carbon of 1.6%. Nematode inoculum (Meloidogyne incognita, race 2) was cultured on susceptible tomato roots at the Can Tho Academy of Horticultural Research. The research was conducted from November 2022 to May 2023 under institutional ethics clearance (Protocol CTA-PBG/2022-028, approved 14 October 2022).
Methods
A split-plot design was used with nematode treatment (inoculated versus non-inoculated) as the main plot and cultivar as the subplot. Each subplot measured 3 m by 4 m, replicated four times. Safflower was sown in rows 30 cm apart at a density of 20 plants per square metre. Nematodeinoculated plots received 5,000 second-stage juveniles per plant applied at the seedling base 14 days after emergence. Calcium uptake was measured by digesting dried shoot tissue in nitric-perchloric acid and quantifying calcium by atomic absorption spectrophotometry [5] . Genome-wide association was performed on a panel of 142 accessions genotyped with genotyping-by-sequencing, yielding 4,218 filtered SNPs after quality control (minor allele frequency above 5%, missing data below 10%). Association analysis used a mixed linear model in GAPIT version 3 with kinship and population structure as covariates [6] . Colour stability of petal extracts was assessed by adjusting pH to 3.0, 4.0, 4.5, 5.0, and 6.0 with citrate-phosphate buffer and measuring absorbance at 403 nm over 90 days of storage at 25 degrees C. All data were analysed by ANOVA in R version 4.3.1 [11] . Two loci on chromosomes 3 and 7 exceeded the genomewide significance threshold and together explained 30.1% of flavonoid variation. A third suggestive locus on chromosome 1 contributed an additional 6.2%.
Results
Results
Comprehensive Interpretation
The box plot in Figure 1 highlights substantial inter-cultivar variation, with CT-04 and CT-06 forming a high-flavonoid cluster and CT-03 sitting well below the group median. The biosynthetic pathway in Figure 2 provides context for interpreting the GWAS hits: the locus on chromosome 3 maps near a predicted chalcone synthase gene, while the chromosome 7 locus overlaps a flavonoid 3-hydroxylase homologue, both encoding enzymes central to the pathway [1, 7] .
Discussion
The flavonoid concentrations reported here (14.6 to 30.6 mg QE per g) exceed those recorded in semi-arid Iranian safflower trials (8 to 18 mg QE per g), likely because the high humidity and ample soil moisture of the marshland environment supported vigorous petal growth that diluted structural but not phenolic tissue [2,4] . Calcium uptake correlated positively with flavonoid yield (r = 0.67), consistent with the role of calcium as a cofactor for phenylalanine ammonia-lyase and a secondary messenger that activates defence gene expression under biotic stress [5] . The nematode-mediated increase in flavonoid content (mean 16.3%) mirrors findings in tomato where root-knot infection triggered systemic accumulation of chlorogenic acid and rutin in aerial tissues [12] . From a weed-science perspective, elevated petal flavonoids could improve the allelopathic potential of safflower residues incorporated into soil after harvest, though this hypothesis requires confirmation through bioassay experiments [8] . The colour-stability data add a processing dimension: extracts held below pH 4.5 retained more than 85% of initial absorbance after 90 days, an attribute that matters for natural-dye and food-colouring applications [13] .
The GWAS results mark a first step toward genomicsassisted breeding for flavonoid content in safflower. The two significant loci together explained 30.1% of phenotypic variance, a proportion that suggests scope for additional minor-effect loci detectable with larger mapping populations [6,14] . The chromosome 3 locus is of particular interest because it co-localises with a previously reported QTL for petal colour intensity, reinforcing the link between pigmentation and flavonoid accumulation [7,15] .
Conclusion
This research quantified flavonoid content in six safflower cultivars under wetland conditions and identified CT-04 as the top accumulator at 26.3 mg QE per g under normal conditions and 30.6 mg QE per g under nematode stress. Calcium uptake was positively associated with flavonoid yield, supporting the idea that calcium-mediated signalling drives phenylpropanoid metabolism in safflower. Genomewide association revealed two significant loci on chromosomes 3 and 7 explaining 30.1% of variation, providing targets for marker-assisted selection. Nematode infestation acted as a biotic elicitor of flavonoid accumulation, and extract acidity below pH 4.5 preserved colour stability for at least three months. These results offer a quantitative foundation for breeding safflower lines tailored to both nutraceutical and natural-dye markets in tropical wetland settings. Multi-environment validation and fine-mapping of the identified loci are recommended as next steps.
Acknowledgement
Acknowledgements Funding SourcesThis research was supported by institutional grants for horticultural crop improvement in wetland agro-ecologies. Institutional SupportThe Can Tho Academy of Horticultural Research provided laboratory and field infrastructure for the 2022-2023 season. Contributions Not Qualifying for AuthorshipTechnical staff who maintained nematode cultures and assisted with field sampling are gratefully recognised.
Figures and tables from the paper
| Locus | Chromosome | Position (Mb) | P-value | Effect (mg QE/g) | PVE (%) |
|---|---|---|---|---|---|
| qFLV3.1 | Chr 3 | 42.18 | -log₁₀ 6.8 | +3.42 | 18.4 |
| qFLV7.1 | Chr 7 | 28.94 | -log₁₀ 5.3 | +2.17 | 11.7 |
| qFLV1.1 | Chr 1 | 61.43 | -log₁₀ 4.1 | +1.38 | 6.2 |
Table text extracted from the original PDF; superscript letters are shown inline. The original table image is below.
View original table image
References
15 in the original paper- Panche AN, Diwan AD, Chandra SR. Flavonoids: an overview. Journal of Nutritional Science. 2016;5:e47.
- Delshad E, Yousefi M, Sasannezhad P, Rakhshandeh H, Ayati Z. Medical uses of Carthamus tinctorius L. (safflower): a comprehensive review from traditional medicine to modern medicine. Electronic Physician. 2018;10(4):6672-6681.
- Li HX, Han SY, Wang XW, Ma X, Zhang K, Wang L, et al. Effect of the carthamins yellow from Carthamus tinctorius L. on hemorheological disorders of blood stasis in rats. Food and Chemical Toxicology. 2009;47(8):1797-1802.
- Knowles PF. Centers of plant diversity and conservation of crop germplasm: safflower. Economic Botany. 1969;23(4):324-329.
- White PJ, Broadley MR. Calcium in plants. Annals of Botany. 2003;92(4):487-511.
- Lipka AE, Tian F, Wang Q, Peiffer J, Li M, Bradbury PJ, et al. GAPIT: genome association and prediction integrated tool. Bioinformatics. 2012;28(18):23972399.
- Bowers JE, Pearl SA, Burke JM. Genetic mapping of millions of SNPs in safflower (Carthamus tinctorius L.) via whole-genome resequencing. G3: Genes, Genomes, Genetics. 2016;6(7):2203-2211.
- Macias FA, Molinillo JMG, Varela RM, Galindo JCG. Allelopathy: a natural alternative for weed control. Pest Management Science. 2007;63(4):327-348.
- Ren CZ, Zhou C, Zhang HC, Guo Y. Advances on the genetic studies of safflower. Agricultural Sciences in China. 2007;6(5):527-535.
- Singleton VL, Orthofer R, Lamuela-Raventos RM. Analysis of total phenols and other oxidation substrates and antioxidants by means of Folin-Ciocalteu reagent. Methods in Enzymology. 1999;299:152-178.
- R Core Team. R: a language and environment for statistical computing. Vienna: R Foundation for Statistical Computing; 2023.
- Bhatt D, Negi M, Sharma P, Saxena SC, Dobriyal AK, Arora S. Responses to drought in Lens culinaris Medik.: a brief review. International Journal of Botany Studies. 2011;6(2):20-27.
- Yoon JM, Cho MH, Park JE, Kim YH, Hahn TR, Paik YS. Thermal stability of the pigments hydroxysafflor yellow A, safflor yellow B, and precarthamin from safflower (Carthamus tinctorius). Journal of Food Science. 2003;68(3):839-843.
- Yu J, Pressoir G, Briggs WH, Vroh Bi I, Yamasaki M, Doebley JF, et al. A unified mixed-model method for association mapping that accounts for multiple levels of relatedness. Nature Genetics. 2006;38(2):203-208.
- Golkar P, Arzani A, Rezaei AM. Genetic variation in safflower (Carthamus tinctorius L.) for seed qualityrelated traits and inter-simple sequence repeat (ISSR) markers. International Journal of Molecular Sciences. 2011;12(4):2664-2677.