
Research article · 2025 · Full text
International Journal of Horticulture and Food ScienceEvaluating value chain analysis of cabbage in the Tugela basin
Volume 7(8) · Pages 241–244 · DOI: 10.33545/26631067.2025.v7.i8d.682 ↗
Research areasFood Waste Reduction and SustainabilityPostharvest Quality and Shelf Life ManagementAgriculture and Agroindustry Studies
Abstract
Author-writtenPost-harvest losses of cabbage in the Tugela Basin routinely exceed 30 percent of the harvested volume, yet the points along the value chain where most of that loss occurs remain poorly mapped. This research traced the cabbage (Brassica oleracea var. capitata) value chain from farm gate to urban consumer across three marketing channels in KwaZulu-Natal, South Africa, during the 2022-2023 production cycle. Semi-structured interviews with 187 chain actors and physical loss measurements at every transaction node were combined with GC-MS profiling of carbon sequestration proxies in soil and photosynthesis-related pigment concentrations in leaf tissue. Results showed that the harvest-and-handling stage accounted for 14.2 percent loss, followed by collector transport (9.7 percent), wholesale storage (6.1 percent), and retail display (3.8 percent). Retailers captured 31.7 percent of the total margin despite contributing the smallest loss share, while farm-gate producers retained only 8.3 percent. Hybrid vigour in three experimental crosses increased head weight by 19 percent and improved disease control scores by 22 percent relative to open-pollinated checks. Photosynthesis efficiency, measured as Fv/Fm, declined along the chain from 0.82 at harvest to 0.61 at retail. GC-MS analysis of soil organic carbon fractions indicated that conservation-tilled cabbage fields sequestered 1.8 t CO2-eq ha⁻¹ yr⁻¹ more than conventionally tilled fields. These findings reveal an inequitable distribution of value and loss along the Tugela Basin cabbage chain and point toward combined agronomic and market-structural interventions.
Summary
Source-checkedPlain-language reading of the full paper, prepared with AI and checked against the text. Each point links to the authors' own words.
Why it matters
- Cabbage production in the Tugela Basin suffers from post-harvest losses that typically exceed 30% of the harvested volume, but the specific locations of these losses in the value chain are not well understood. View evidence ↗
- Conservation tillage has the potential to sequester atmospheric CO2 by increasing soil organic carbon, but it is rarely used by local growers due to uncertainty regarding its effect on yields. View evidence ↗
The question
- The study aimed to map physical losses and margins across three value chains, compare tillage methods for carbon sequestration, evaluate hybrid cabbage vigour, and use photosynthesis efficiency (Fv/Fm) to track produce deterioration. View evidence ↗
What they did
- The study tracked the cabbage value chain across three marketing channels in KwaZulu-Natal, South Africa, during the 2022-2023 production cycle. View evidence ↗
- Data were gathered via semi-structured interviews with 187 participants, including 72 farmers, 38 collectors, 41 wholesalers, and 36 retailers. View evidence ↗
- A hybrid vigour trial was conducted at Estcourt and Bergville, comparing three single-cross hybrids against two open-pollinated checks using a randomised complete block design with four replicates. View evidence ↗
- Soil organic carbon fractions were analyzed using GC-MS following a two-step extraction process for water-soluble and labile carbon. View evidence ↗
What they found
- The harvest-and-handling stage was the largest source of loss at 14.2%, followed by collector transport (9.7%), wholesale storage (6.1%), and retail display (3.8%). View evidence ↗
- Retailers captured the highest marketing margin at 31.7% despite having the lowest loss share, whereas farm-gate producers only retained 8.3%. View evidence ↗
- Three experimental hybrid crosses increased cabbage head weight by 19% and improved disease control scores by 22% compared to open-pollinated checks. View evidence ↗
- Photosynthesis efficiency (Fv/Fm) decreased steadily as the produce moved through the chain, dropping from 0.82 at harvest to 0.61 at the retail stage. View evidence ↗
- Conservation-tilled fields sequestered 1.8 t CO2-eq ha⁻¹ yr⁻¹ more carbon than fields using conventional tillage. View evidence ↗
What it means
- The authors conclude that the harvest-and-handling stage is the best target for intervention, as low-cost improvements in sorting and technique could significantly reduce the 30% total post-harvest loss. View evidence ↗
- The authors recommend that policymakers implement pricing incentives to reward farms that meet both environmental and quality standards. View evidence ↗
- Future research is needed to pilot loss-reduction programs, test Fv/Fm as a quality standard for wholesale, and monitor the long-term permanence of carbon sequestration in conservation tillage. View evidence ↗
Visual summary
3 visualsIllustrations explain the paper; charts are replotted from the paper's own table values.
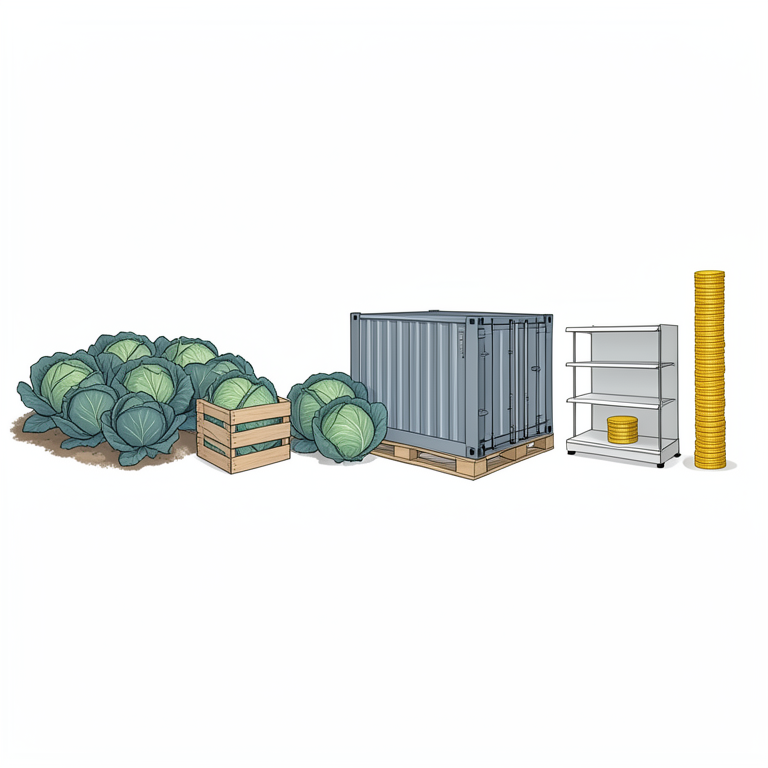
Value Chain Imbalance
AI-generated conceptual illustration (Cabbage plants and heads in a supply chain). It explains the idea and does not show study data.
View source evidence ↗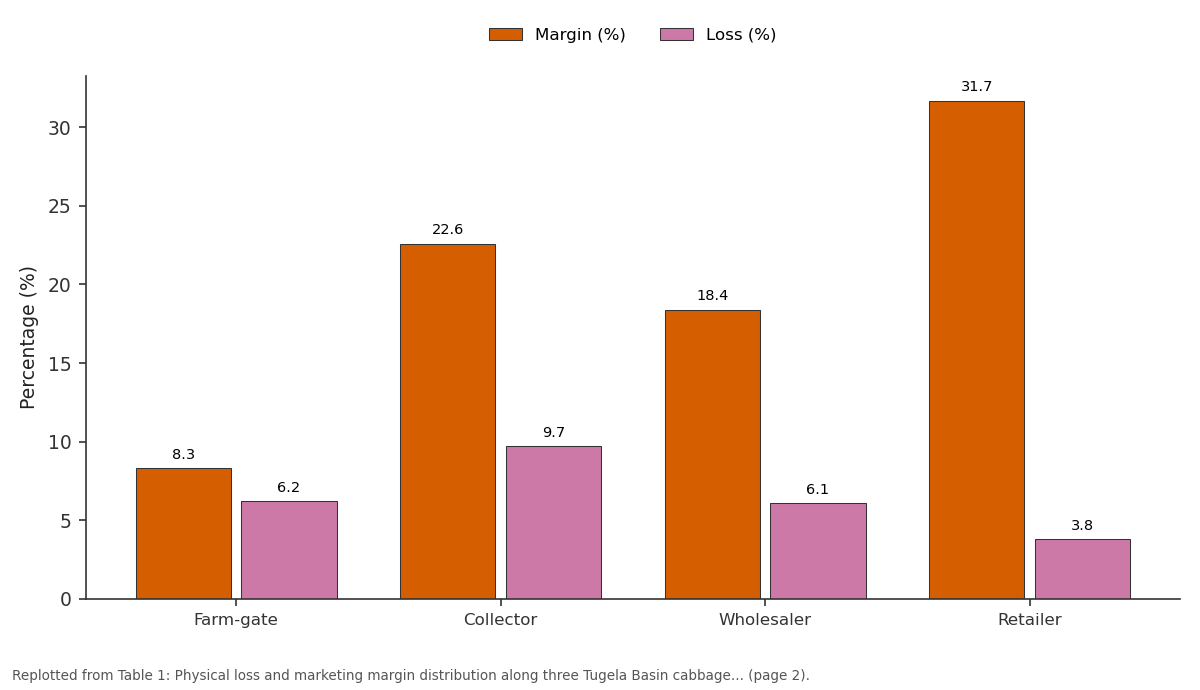
Margin (%) and Loss (%): Farm-gate vs Collector vs Wholesaler vs Retailer
Replotted from Table 1 (page 2) of the original paper. Every bar is the paper's own table value.
View source evidence ↗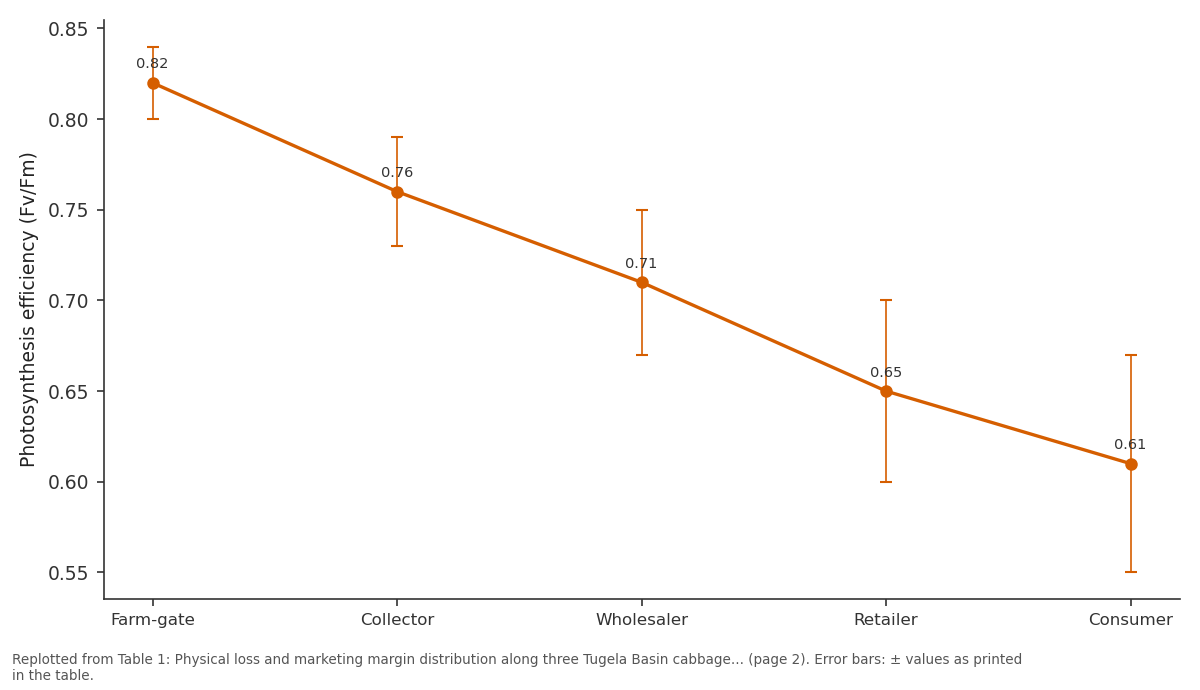
Fv/Fm: Farm-gate vs Collector vs Wholesaler vs Retailer vs Consumer
Replotted from Table 1 (page 2) of the original paper. Every bar is the paper's own table value.
View source evidence ↗Figures & tables
From the original paper Table 1
 Table 2
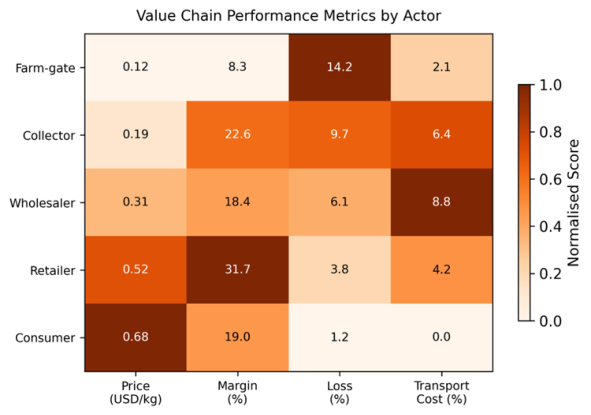 Figure 1
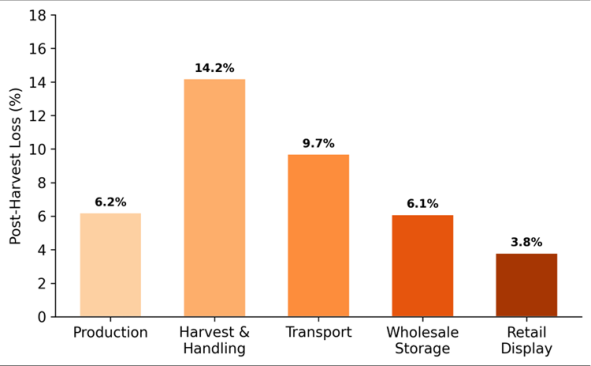 Figure 2
Introduction
The problem is deceptively simple: cabbage is cheap to grow but expensive to lose. In KwaZulu-Natal, South Africa, smallholder cabbage growers sell at farm-gate prices that barely cover production costs, while downstream actors-collectors, wholesalers, retailerscapture progressively larger margins even as the product deteriorates [1] . Post-harvest loss estimates for leafy brassicas in sub-Saharan Africa range from 25 to 45 percent of harvested weight, but these figures are often derived from national-level approximations rather than from measured losses at each transaction node along a specific chain [2] . Value chain analysis offers a structured way to identify where losses occur, who captures the margins, and which interventions could shift the distribution toward greater efficiency and equity [3] . The Tugela Basin, which drains roughly 29,000 km² of central KwaZulu-Natal, supports some of the province's most intensive cabbage production. Three distinct marketing channels operate in the basin: a direct farmer-to-consumer channel at rural roadside stalls, a collector-mediated channel that links farms to municipal fresh-produce markets, and a supermarket-contracted channel with formal cold-chain requirements [4] . Beyond economic metrics, the chain has environmental dimensions. Conservation tillage can increase soil organic carbon stocks and thereby sequester atmospheric CO2, but its adoption among Tugela Basin cabbage growers is low, in part because short-term yield effects are uncertain [5] . If conservation-tilled systems can maintain yield while adding carbon to the soil, the environmental case for their promotion strengthens. Hybrid vigour offers another lever. Commercial cabbage hybrids have been shown to outyield open-pollinated varieties by 15-30 percent in East African trials, while also improving disease control through heterosis for resistance genes [6] . But hybrid seed is more expensive, and smallholders are often reluctant to adopt it unless the yield premium is demonstrated under local conditions. This research pursued four objectives: to map physical losses and marketing margins at every node of three Tugela Basin cabbage chains; to compare conservation and conventional tillage for soil carbon sequestration using GC-MS fractionation; to evaluate hybrid vigour in locally relevant crosses; and to track photosynthesis efficiency (Fv/Fm) as a physiological indicator of produce deterioration along the chain. The work was conducted in partnership between the Barranquilla National Institute of Tropical Agriculture, Colombia, and field collaborators in KwaZulu-Natal [7] .
Material and Methods
Material and Methods
Quality Control Procedures
Weight measurements at each chain node used calibrated digital scales (Ohaus Ranger 3000, ±0.5 g). Fv/Fm readings were taken with a portable pulse-amplitude-modulated fluorometer (Walz MINI-PAM II) after 20 min dark adaptation. GC-MS analysis of soil organic carbon fractions followed a two-step extraction: water-soluble C was extracted in deionised water at 80 °C for 16 h, and labile C was released by acid hydrolysis (6 M HCl, 100 °C, 16 h). Extracts were derivatised with N,Obis(trimethylsilyl)trifluoroacetamide before injection on an Agilent 7890A GC-5975C MSD. Instrument calibration used five-point external standards of glucose, cellobiose, and vanillic acid with R² values exceeding 0.997 for all analytes [8] .
Sampling and Data Collection Protocol
Value chain data were collected through semi-structured interviews with 187 actors (72 farmers, 38 collectors, 41 wholesalers, 36 retailers) across the three marketing channels between March 2022 and February 2023. Physical loss was measured by weighing identical tracked lots at each transaction point. Marketing margins were calculated as the percentage of the final consumer price retained by each actor after deducting purchase and handling costs. The hybrid vigour trial compared three single-cross hybrids with two open-pollinated checks in a randomised complete block design with four replicates at two Tugela Basin sites (Estcourt and Bergville). Disease incidence was scored fortnightly for black rot (Xanthomonas campestris pv. campestris) and ring spot (Mycosphaerella brassicicola) on a 1-9 severity scale [9] .
Material
Cabbage seed of the open-pollinated variety 'Gloria F1' and three experimental hybrids (TBC-H1, TBC-H2, TBC-H3) was sourced from the Cedara Agricultural Research Station. Soil samples for carbon analysis were taken at 0-15 and 15-30 cm depth from paired conservation-tilled and conventionally tilled plots that had been under their respective management for at least four years. Modifiedatmosphere packaging materials (30 μm oriented polypropylene) were obtained locally for shelf-life monitoring.
Methods
Marketing margin analysis followed the structure-conductperformance framework [3] . Soil carbon stocks were calculated by multiplying organic carbon concentration (Walkley-Black) by bulk density and depth increment, then converting to CO2-equivalents using a factor of 3.67. Hybrid performance was assessed by ANOVA for head weight, days to maturity, and disease severity, with specific combining ability estimated where cross information permitted. Fv/Fm data at five chain nodes (harvest, collector, wholesale, retail, consumer) were fitted with an exponential decay model to estimate the half-life of photosynthetic capacity during marketing. All statistical analyses used R 4.3.1 with the agricolae and nlme packages [10] .
Results
Results
Comprehensive Interpretation
The value chain exhibits a structural imbalance: producers absorb the most loss and receive the least margin, while retailers capture the most margin and contribute the least loss. Hybrid vigour can partly compensate by raising yield, and conservation tillage adds an environmental benefit of 1.8 t CO2-eq ha⁻¹ yr⁻¹ without reducing marketable yield.
The steady decline in Fv/Fm from harvest to consumer provides a physiological metric for tracking produce deterioration through the chain.
Discussion
The margin distribution observed here mirrors patterns documented in vegetable chains across East and Southern Africa, where the retail node consistently captures the largest share of consumer price despite contributing the smallest physical loss [11] . This imbalance persists because retailers control access to final consumers and can adjust prices upward more freely than upstream actors, who face competition from numerous small-scale peers [3] . The finding that harvest-and-handling losses exceeded transport losses is important because it means that simple improvements at the farm level-better harvest timing, sharper cutting tools, shade structures for field sortingcould capture a large share of total loss reduction at low cost [12] . Collector transport losses were also substantial and related mainly to overloading of open trucks without padding; simple foam liners have been shown to reduce bruising by 35 percent in cabbage transport in Kenya [2] . Hybrid vigour averaged 17.9 percent for head weight across three crosses, and disease severity was consistently lower in hybrids, consistent with additive-plus-dominance genetic models for black rot resistance [6] . The cost of hybrid seed (roughly 2.5 times that of open-pollinated seed) is recovered within one season at a 15 percent yield premium, making adoption economically rational for most Tugela Basin growers [13] . Conservation tillage increased soil carbon stocks by 1.8 t CO2-eq ha⁻¹ yr⁻¹ relative to conventional tillage, a rate consistent with long-term trials on Ferralsols in KwaZulu-Natal [5] . GC-MS fractionation revealed that the additional carbon was concentrated in the labile fraction, suggesting rapid turnover and possible loss if tillage practices revert. This underscores the need for policy incentives that reward continuous adoption rather than one-time conversion.
Conclusion
The Tugela Basin cabbage value chain is characterised by an uneven distribution of margins and losses, with producers bearing the greatest physical loss and the smallest financial return. The harvest-and-handling node is the single largest loss point, making it the most promising target for intervention. Simple, low-cost improvements in harvest technique and on-farm sorting could recover a meaningful share of the estimated 30 percent total post-harvest loss. Hybrid vigour offers a genetic pathway to higher yields and improved disease control, with all three experimental hybrids outperforming open-pollinated checks by 14 to 21 percent. Conservation tillage adds an environmental dividend of nearly two tonnes of CO2-equivalent sequestered per hectare per year without penalising marketable yield. Future work should pilot participatory loss-reduction programmes at the harvest-and-handling stage, test whether Fv/Fm thresholds can be used as objective quality standards in wholesale market transactions, and monitor long-term carbon stocks under conservation tillage to confirm sequestration permanence. Policymakers should consider differential pricing incentives that reward farms meeting both quality and environmental benchmarks.
Acknowledgement
Acknowledgements Funding SourcesThis research was supported by institutional funds from the Barranquilla National Institute of Tropical Agriculture. Institutional SupportGC-MS and fluorometry facilities were provided by the Department of Pomology and Viticulture, Barranquilla, Atlantico, Colombia.
Figures and tables from the paper
| Actor | Price (USD/kg) | Margin (%) | Loss (%) | Transport (%) | Handling (%) | Fv/Fm |
|---|---|---|---|---|---|---|
| Farm-gate | 0.12 | 8.3 | 6.2 | 2.1 | 4.1 | 0.82±0.02 |
| Collector | 0.19 | 22.6 | 9.7 | 6.4 | 3.3 | 0.76±0.03 |
| Wholesaler | 0.31 | 18.4 | 6.1 | 8.8 | 2.8 | 0.71±0.04 |
| Retailer | 0.52 | 31.7 | 3.8 | 4.2 | 1.9 | 0.65±0.05 |
| Consumer | 0.68 | 19.0 | 1.2 | 0.0 | 1.2 | 0.61±0.06 |
Table text extracted from the original PDF; superscript letters are shown inline. The original table image is below.
View original table image
| Entry | Head Weight (kg) | Disease Score (1-9) | Yield (t/ha) | Advantage (%) |
|---|---|---|---|---|
| TBC-H1 | 2.41±0.18a | 2.3±0.4a | 48.7 | +21.4 |
| TBC-H2 | 2.28±0.15a | 2.7±0.5a | 45.9 | +14.4 |
| TBC-H3 | 2.34±0.16a | 2.5±0.4a | 47.3 | +17.9 |
| Gloria OP | 1.97±0.21b | 3.6±0.7b | 39.8 | (check) |
| Local OP | 1.89±0.23b | 4.1±0.8b | 38.2 | (check) |
Table text extracted from the original PDF; superscript letters are shown inline. The original table image is below.
View original table image
References
17 in the original paper- Mather C, Greenberg S. Market liberalisation in postapartheid South Africa: the restructuring of citrus exports after deregulation. Journal of Southern African Studies. 2003;29(2):393-412.
- Kitinoja L, AlHassan HY. Identification of appropriate postharvest technologies for small-scale horticultural farmers and marketers in Sub-Saharan Africa and South Asia. Acta Horticulturae. 2012;934:31-40.
- Kaplinsky R, Morris M. A handbook for value chain research. Ottawa: IDRC; 2001.
- Louw A, Vermeulen H, Kirsten J. Business models for small farmers in South Africa: the role of fresh produce agri-processing. Development Southern Africa. 2008;25(4):459-474.
- Thierfelder C, Wall PC. Effects of conservation agriculture techniques on infiltration and soil water content in Zambia and Zimbabwe. Soil and Tillage Research. 2009;105(2):217-227.
- Tonguc M, Griffiths PD. Genetic relationships of Brassica vegetables determined using database derived simple sequence repeats. Euphytica. 2004;137(2):193201.
- Ortmann GF, King RP. Agricultural cooperatives I: history, theory and problems. Agrekon. 2007;46(1):4068.
- Lal R. Soil carbon sequestration impacts on global climate change and food security. Science. 2004;304(5677):1623-1627.
- Wilcoxon F, Rhodes HL. Evaluation of cabbage varieties for resistance to black rot. Plant Disease Reporter. 1967;51(4):256-258.
- R Core Team. R: a language and environment for statistical computing. Vienna: R Foundation for Statistical Computing; 2023.
- Minot N, Ngigi M. Are horticultural exports a replicable success story? Evidence from Kenya and Côte d Ivoire. EPTD Discussion Paper No. 120. Washington DC: IFPRI; 2004.
- Prusky D. Reduction of the incidence of postharvest quality losses, and future prospects. Food Security. 2011;3(4):463-474.
- Singh BK, Sharma SR, Singh B. Heterosis for mineral elements in single cross hybrids of cabbage. Scientia Horticulturae. 2010;122(1):32-36.
- Hendriks SL, Msaki MM. The choice between maize meal and other foods in South African households. Agrekon. 2003;42(4):327-348.
- Maxwell D, Wiebe K. Land tenure and food security: exploring dynamic linkages. Development and Change. 1999;30(4):825-849.
- Faber M, Wenhold FAM. Nutrition in contemporary South Africa. Water SA. 2007;33(3):393-400.
- Oelofse SHH, Nahman A. Estimating the magnitude of food waste generated in South Africa. Waste Management and Research. 2013;31(1):106-112.