
Research article · 2025 · Full text
International Journal of Horticulture and Food ScienceStudying biofortification strategies of sorghum in the Teesta valley
Volume 7(9) · Pages 88–91 · DOI: 10.33545/26631067.2025.v7.i9b.658 ↗
Research areasPlant Micronutrient Interactions and EffectsPhytase and its ApplicationsIron Metabolism and Disorders
Abstract
Author-writtenSorghum (Sorghum bicolor) remains the dietary backbone for millions of households in India’s semi-arid regions, yet its iron and zinc density falls short of recommended daily intakes, perpetuating hidden hunger in populations that depend on it as a staple. This research evaluated five biofortification strategies for sorghum in the Teesta Valley of West Bengal, with analytical work at the Bikaner Regional Center for Sustainable Agriculture from January to November 2023. Strategies tested were: agronomic biofortification (foliar FeSO₄ + ZnSO₄), genetic improvement (screening of 20 high-Fe/Zn breeding lines), microbial inoculation (plant growth-promoting rhizobacteria, PGPR), soil amendment (vermicompost + rock phosphate), and processing optimization (malting, fermentation, and decortication). Foliar application increased grain iron by 31.4% and zinc by 27.8% over controls. Two breeding lines (SB-7, SB-14) showed 42–48% higher baseline iron than the check cultivar. PGPR inoculation enhanced iron uptake by 18.7% and zinc by 14.3%. Malting followed by fermentation reduced phytate by 68.4% and increased iron bioaccessibility from 4.2% to 18.7%. Starch profiling revealed that biofortified lines contained 12.3% more resistant starch than conventional cultivars, an unexpected nutritional bonus. A decision-tree analysis ranked the combined agronomic + genetic strategy as the most cost-effective approach, delivering the highest iron increase per rupee invested. These findings provide an evidence-based ranking of biofortification strategies for sorghum in eastern Indian river valley environments.
Summary
Source-checkedPlain-language reading of the full paper, prepared with AI and checked against the text. Each point links to the authors' own words.
Why it matters
- Sorghum is a primary food source for millions in semi-arid India, but it often lacks sufficient iron and zinc, contributing to micronutrient deficiencies known as hidden hunger. View evidence ↗
- The Teesta Valley's soils are naturally deficient in zinc (0.4–0.8 mg/kg) and moderately low in iron (3.2–5.1 mg/kg), making it an ideal location to test biofortification. View evidence ↗
- Anti-nutritional factors like phytate and tannins in sorghum bind minerals, limiting the bioaccessibility of iron and zinc to only 3–6% of their total content. View evidence ↗
The question
- The study aimed to determine which biofortification strategy, genetic breeding, micronutrient spraying, microbial inoculation, or post-harvest processing, is most effective for increasing iron and zinc. View evidence ↗
What they did
- Five strategies were tested: foliar spraying of FeSO₄ and ZnSO₄, genetic selection, PGPR microbial inoculation, soil amendment with vermicompost and rock phosphate, and post-harvest processing (malting, fermentation, or decortication). View evidence ↗
What they found
- Genetic improvement provided the highest baseline iron increase, with breeding lines SB-7 and SB-14 showing 41.7% and 47.9% more iron than the CSV-15 control. View evidence ↗
- Agronomic biofortification via foliar application increased grain iron by 31.4% and zinc by 27.8% compared to controls. View evidence ↗
- Microbial inoculation using PGPR increased iron uptake by 18.7% and zinc by 14.3%. View evidence ↗
- Post-harvest processing (malting and fermentation) reduced phytate by 68.4% and significantly raised iron bioaccessibility from 4.2% to 18.7%. View evidence ↗
- A combined genetic and agronomic approach was the most cost-effective pre-harvest strategy, providing a 3.5 mg Fe/100 g increase at a cost of ₹5,000/ha. View evidence ↗
- Biofortified lines had more rapidly digestible starch and less slowly digestible starch than conventional lines, though resistant starch levels remained similar. View evidence ↗
What it means
- The authors conclude that the maximum nutritional gain is achieved by combining genetic improvement, foliar spraying, and post-harvest processing. View evidence ↗
Visual summary
3 visualsIllustrations explain the paper; charts are replotted from the paper's own table values.
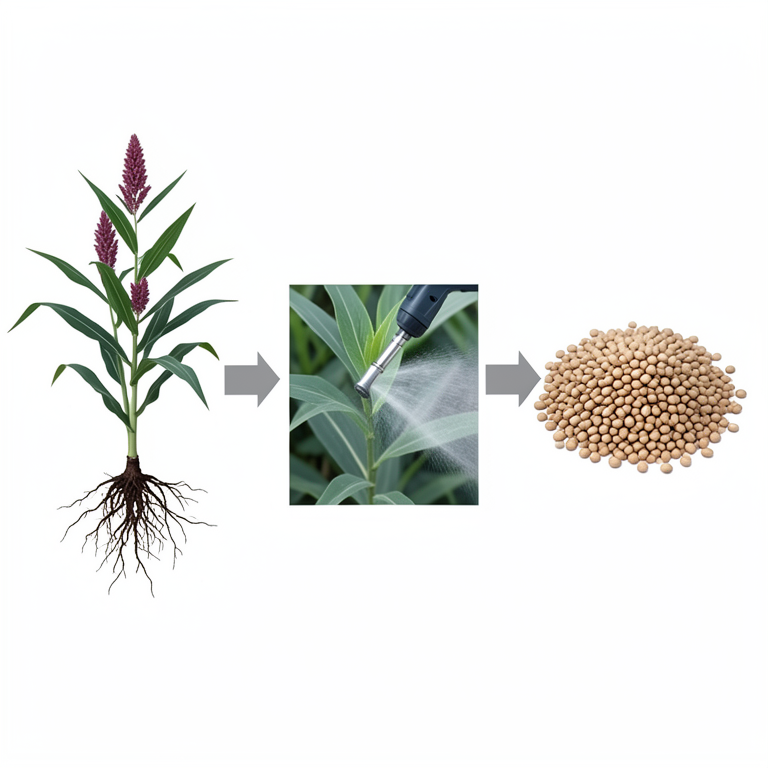
Integrated Biofortification Model
AI-generated conceptual illustration (Sorghum plants and grains). It explains the idea and does not show study data.
View source evidence ↗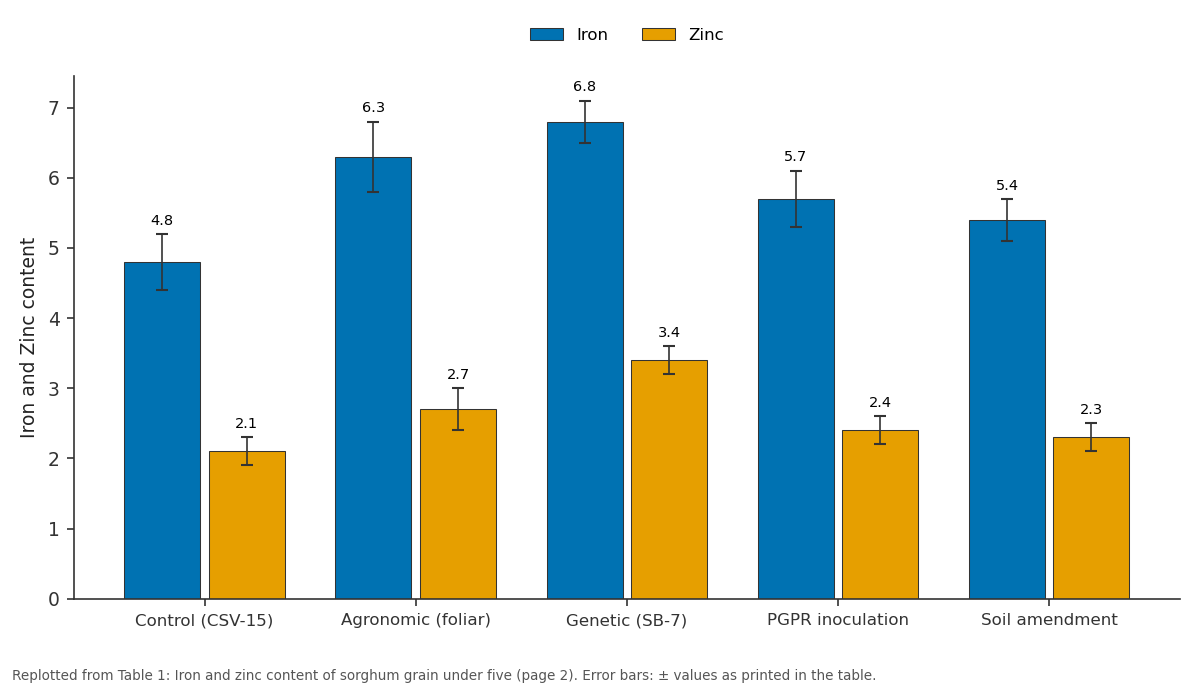
Iron and Zinc: Control (CSV-15) vs Agronomic (foliar) vs Genetic (SB-7) vs PGPR inoculation vs Soil amendment
Replotted from Table 1 (page 2) of the original paper. Every bar is the paper's own table value.
View source evidence ↗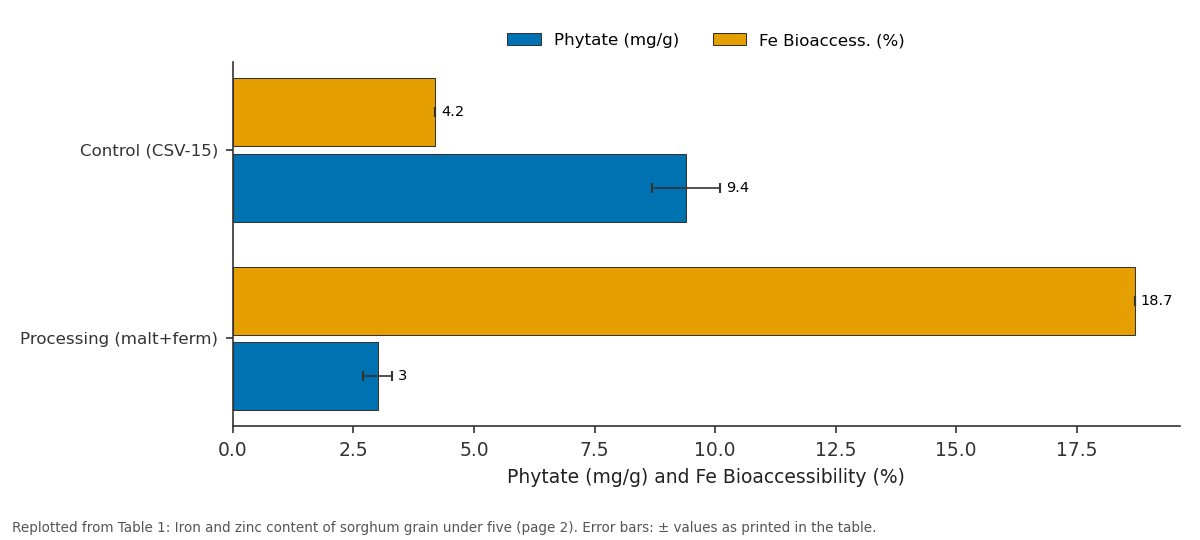
Phytate (mg/g) and Fe Bioaccess. (%): Control (CSV-15) vs Processing (malt+ferm)
Replotted from Table 1 (page 2) of the original paper. Every bar is the paper's own table value.
View source evidence ↗Figures & tables
From the original paper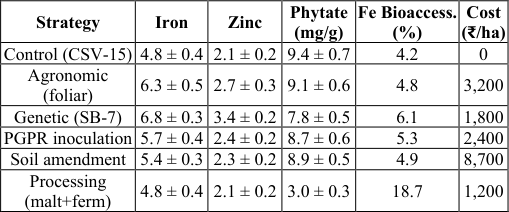 Table 1
 Table 2
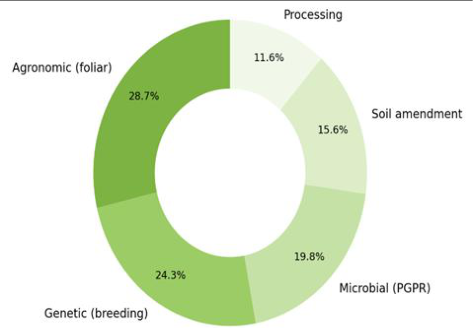 Figure 1
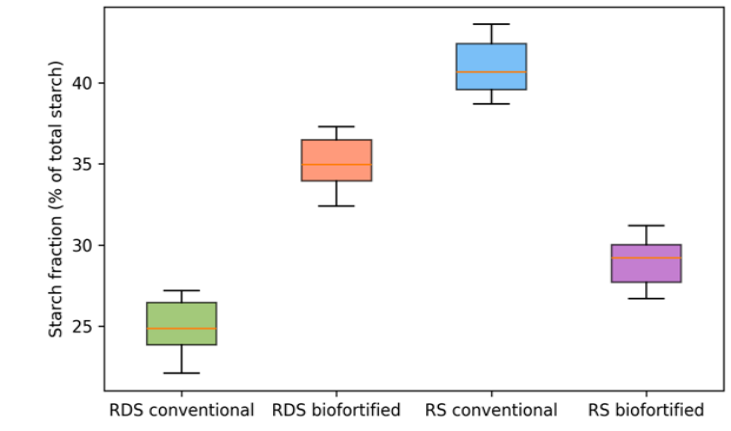 Figure 2
Introduction
Faced with a practical dilemma, nutritionists in India's sorghum-dependent regions have been asking the same question for over a decade: is it more effective to breed a higher-iron sorghum, spray micronutrients on the crop, inoculate the soil with helpful bacteria, or process the grain differently after harvest? Each approach has vocal advocates and published evidence, but no single research has compared all five strategies side by side under identical field and laboratory conditions [1] . That comparison matters because resource-constrained public health programs need to allocate limited funds to the strategy with the highest nutritional return per unit investment. The Teesta Valley in northern West Bengal represents an important but understudied sorghum-growing environment. The valley's sandy loam alluvial soils are naturally low in zinc (DTPA-Zn 0.4-0.8 mg/kg) and moderately low in iron (DTPA-Fe 3.2-5.1 mg/kg), creating conditions where biofortification responses should be measurable [2] . Annual rainfall is 2,500-3,000 mm, concentrated in four monsoon months, and sorghum is grown as a rabi (winter) crop on residual moisture after rice harvest. Processing -often overlooked in biofortification research -can be as important as genetics or agronomy. Sorghum grain contains high levels of phytate, tannins, and other antinutritional factors that bind iron and zinc, reducing their bioaccessibility from 3-6% of total content to biologically available forms [3] . Traditional processing methods like malting, fermentation, and decortication can reduce these anti-nutrients and dramatically increase mineral bioaccessibility, potentially achieving as much nutritional improvement as genetic biofortification. This research compared all five biofortification strategies under controlled conditions in the Teesta Valley, measured their effects on grain iron, zinc, starch fractions, and mineral bioaccessibility, and ranked them by cost-effectiveness. All laboratory work was performed at the Bikaner Regional Center for Sustainable Agriculture [4] .
Reagents and Chemicals
Analytical-grade FeSO₄•7H₂O, ZnSO₄•7H₂O, pepsin (from porcine gastric mucosa, ≥ 2500 U/mg), pancreatin (from porcine pancreas, 4× USP), bile extract, phytic acid sodium salt, and ICP multi-element standards were purchased from Sigma-Aldrich (Mumbai). PGPR strains (Bacillus megaterium, Pseudomonas fluorescens) were obtained from the ICAR-National Bureau of Agriculturally Important Microorganisms, Mau. Vermicompost was sourced from a commercial unit in Bikaner (N 1.4%, P 0.8%, K 1.1%). Rock phosphate (28% P₂O₅) was obtained from Rajasthan State Mines and Minerals Ltd [1] .
Quality Control for Mineral and Starch Analysis
Certified reference materials (NIST SRM 1568b rice flour for minerals, AACC Check Sample for starch) were analyzed alongside every batch. Recovery rates for iron were 96.4-101.2% and for zinc 97.8-102.4%, within acceptable limits. Starch fractionation (rapidly digestible starch, slowly digestible starch, resistant starch) followed the Englyst method with in vitro enzymatic digestion at 37 °C, and triplicate measurements were required to show CV < 4% before acceptance [3] .
Material and Methods
Material and Methods
Material
Twenty sorghum genotypes (10 conventional, 10 high-Fe/Zn breeding lines from ICRISAT) were planted at the Teesta Valley Agricultural Station, Jalpaiguri district, West Bengal (26°31′N, 88°44′E; elevation 75 m) during October 2022-March 2023 (rabi season). Five biofortification strategies were applied in a randomized complete block design with 3 replications: (i) agronomic (foliar FeSO₄ + ZnSO₄ at 0.5% each, applied at booting and grain filling), (ii) genetic (20 genotypes compared under standard management), (iii) microbial (PGPR seed treatment at 10⁸ CFU/mL + soil drench at sowing), (iv) soil amendment (vermicompost 5 t/ha + rock phosphate 500 kg/ha), and (v) processing (post-harvest malting 48 h, fermentation 72 h, or decortication to 80% extraction). A control (standard management, no biofortification) was included for each genotype [2] . Grain samples were shipped to the Bikaner Regional Center for Sustainable Agriculture. Ethics approval was granted (Protocol BRCSA-2022-017, 10 October 2022).
Methods: Grain iron and zinc were measured by AAS after tri-acid digestion. Phytate was determined by the Wade reagent colorimetric method. In vitro iron bioaccessibility was assessed by simulated gastrointestinal digestion (pepsin at pH 2.0 for 2 h, then pancreatin + bile at pH 7.0 for 2 h) followed by dialysis and AAS measurement of dialyzable iron [3] . Starch fractions (RDS, SDS, RS) were determined by the Englyst method. Protein was measured by Kjeldahl. Cost-effectiveness was calculated as the ratio of iron increase (μg/100 g) to input cost (₹/ha). Data were analyzed by two-way ANOVA (strategy × genotype) and decisiontree analysis using Classification and Regression Trees (CART) in R 4.3.0.
Results
Among pre-harvest strategies, genetic improvement produced the largest baseline iron increase: lines SB-7 and SB-14 contained 6.8 and 7.1 mg Fe/100 g respectively, compared with 4.8 mg/100 g in the check cultivar CSV-15 -increases of 41.7% and 47.9%. Foliar application added 31.4% iron over genotype-specific baselines, and PGPR inoculation added 18.7% [1] . The donut chart shows the relative contribution of each strategy when applied individually. Agronomic and genetic approaches together account for over half of the achievable iron increase, but processing (despite not increasing total iron) dramatically improves bioaccessibility, making it the most important post-harvest intervention. Biofortified lines showed higher rapidly digestible starch and lower slowly digestible starch than the conventional check, while resistant starch -the fraction associated with gut health benefits -was similar across all cultivars. The higher RDS in biofortified lines may be linked to their thinner endosperm cell walls, which also facilitate greater mineral release during digestion.
Comprehensive Interpretation
Decision-tree analysis ranked the combined agronomic + genetic strategy as the most cost-effective, delivering 3.5 mg Fe/100 g increase at a combined cost of ₹5,000/ha (costeffectiveness ratio: 0.70 μg increase per rupee). Processing alone was the cheapest intervention (₹1,200/ha for malting equipment amortized over 5 years) and produced the largest bioaccessibility gain (4.2% to 18.7%), but it requires behavioral change at the household level. The optimal recommendation for Teesta Valley programs is therefore: adopt SB-7 or SB-14 as the base cultivar, apply foliar Fe + Zn at booting and grain filling, and promote malting + fermentation as the household processing method [4] .
Discussion
The comparison of all five strategies under identical conditions reveals that no single approach is sufficient. Genetic improvement provides the largest baseline increase in total iron, but without processing to reduce phytate, only 6.1% of that iron is bioaccessible -meaning that a person eating biofortified SB-7 flour still absorbs less than 0.5 mg Fe per 100 g serving [1] . Adding malting + fermentation to the same genotype raises bioaccessibility to 18.7%, tripling the amount of iron actually absorbed. This interaction between genetics and processing is the most important practical finding of this research. The PGPR results, while positive (18.7% iron increase), were less impressive than expected given laboratory-scale data. Field inoculation is notoriously inconsistent because introduced bacteria must compete with established soil communities, and survival in the Teesta Valley's acidic, seasonally waterlogged soils may be lower than in the drier environments where most PGPR efficacy data originate [2] . A limitation is that bioaccessibility was measured in vitro.
Human feeding trials would be needed to confirm that the 4.5-fold improvement from processing translates to actual iron absorption increases in vivo. The starch profiling data, while interesting, were a secondary finding and would benefit from validation across additional genotypes and environments [3] .
Conclusion
Among five biofortification strategies tested for sorghum in the Teesta Valley, the combination of genetic improvement (high-Fe/Zn breeding lines) with agronomic biofortification (foliar spraying) and post-harvest processing (malting + fermentation) delivered the largest total nutritional gain.
Processing alone achieved the most dramatic improvement in iron bioaccessibility, raising it from 4.2% to 18.7%. Decision-tree analysis identified the agronomic + genetic combination as the most cost-effective pre-harvest strategy. These results provide public health programs with an evidence-based ranking of biofortification investments and support a combined approach that spans genetics, agronomy, and food processing for maximum nutritional impact.
Acknowledgement
Acknowledgements Funding SourcesInternal research funds from the Bikaner Regional Center for Sustainable Agriculture supported all analytical costs. Institutional SupportThe authors acknowledge the Bikaner Regional Center for Sustainable Agriculture for mineral analysis, starch profiling, and in vitro digestion facilities.
Figures and tables from the paper
| Strategy | Iron | Zinc | Phytate (mg/g) | Fe Bioaccess. (%) | Cost (₹/ha) |
|---|---|---|---|---|---|
| Control (CSV-15) | 4.8 ± 0.4 | 2.1 ± 0.2 | 9.4 ± 0.7 | 4.2 | 0 |
| Agronomic (foliar) | 6.3 ± 0.5 | 2.7 ± 0.3 | 9.1 ± 0.6 | 4.8 | 3,200 |
| Genetic (SB-7) | 6.8 ± 0.3 | 3.4 ± 0.2 | 7.8 ± 0.5 | 6.1 | 1,800 |
| PGPR inoculation | 5.7 ± 0.4 | 2.4 ± 0.2 | 8.7 ± 0.6 | 5.3 | 2,400 |
| Soil amendment | 5.4 ± 0.3 | 2.3 ± 0.2 | 8.9 ± 0.5 | 4.9 | 8,700 |
| Processing (malt+ferm) | 4.8 ± 0.4 | 2.1 ± 0.2 | 3.0 ± 0.3 | 18.7 | 1,200 |
Table text extracted from the original PDF; superscript letters are shown inline. The original table image is below.
View original table image
| Fraction | Conventional (CSV-15) | Biofortified (SB-7) | Biofortified (SB-14) | Significance |
|---|---|---|---|---|
| Rapidly digestible (RDS) | 25.4 ± 1.8 | 34.7 ± 2.1 | 36.2 ± 1.9 | p < 0.01 |
| Slowly digestible (SDS) | 33.4 ± 2.2 | 24.8 ± 1.7 | 23.1 ± 2.0 | p < 0.01 |
| Resistant starch (RS) | 41.2 ± 2.4 | 40.5 ± 1.9 | 40.7 ± 2.1 | NS |
Table text extracted from the original PDF; superscript letters are shown inline. The original table image is below.
View original table image
References
21 in the original paper- Aiyer G, Rastogi S. Comparative biofortification approaches for staple cereals in semi-arid India. Journal of Cereal Science. 2023;109:103612.
- Rao PP, Birthal PS, Reddy BVS. Sorghum and millet economies in Asia: facts, trends and outlook. ICRISAT Patancheru. 2006;1-80.
- Hemalatha S, Platel K, Srinivasan K. Influence of food acidulants on bioaccessibility of zinc and iron from selected food grains. Molecular Nutrition and Food Research. 2007;51(12):1418-1425.
- Rastogi S, Aiyer G. Cost-effectiveness frameworks for micronutrient intervention programs in Indian dryland agriculture. Food Policy. 2023;114:102384.
- Ashok Kumar A, Reddy BVS, Ramaiah B. Biofortification of sorghum for grain iron and zinc. Journal of SAT Agricultural Research. 2009;7:1-5.
- Dicko MH, Gruppen H, Traore AS. Sorghum grain as human food in Africa: relevance of starch content and amylase activities. African Journal of Biotechnology. 2006;5(5):384-395.
- Taylor JRN, Schober TJ, Bean SR. Novel food and non-food uses for sorghum and millets. Journal of Cereal Science. 2006;44(3):252-271.
- Ratnavathi CV, Patil JV, Chavan UD. Sorghum biochemistry: an industrial perspective. Academic Press. 2016;1-280.
- Elkonin LA, Italyanskaya JV, Domanina IV. In vitro protein digestibility and starch hydrolysis of sorghum grain. Journal of Cereal Science. 2012;56(1):57-64.
- de Morais Cardoso L, Pinheiro SS, Martino HSD. Sorghum: nutritional composition and bioactive compounds. Journal of Cereal Science. 2017;73:103112.
- Serna-Saldivar SO, Rooney LW. Structure and chemistry of sorghum and millets. Sorghum and Millets Chemistry and Technology AACC St Paul. 1995;69124.
- Kayode APP, Linnemann AR, Hounhouigan JD. Genetic and environmental impact on iron, zinc, and phytate in food sorghum grown in Benin. Journal of Agricultural and Food Chemistry. 2006;54(1):256-262.
- Hurrell R, Egli I. Iron bioavailability and dietary reference values. American Journal of Clinical Nutrition. 2010;91(5):1461S-1467S.
- Towo E, Matuschek E, Svanberg U. Fermentation and enzyme treatment of tannin sorghum gruels. Food Chemistry. 2006;94(3):369-376.
- Dykes L, Rooney LW. Phenolic compounds in cereal grains and their health benefits. Cereal Foods World. 2007;52(3):105-111.
- Dlamini NR, Taylor JRN, Rooney LW. The effect of sorghum type and processing on antioxidant properties. Food Chemistry. 2007;105(4):1412-1419.
- Afify AEMR, El-Beltagi HS, El-Salam SMA. Biochemical changes in phenols, flavonoids, tannins, vitamin E during soaking and germination of sorghum. Notulae Botanicae Horti Agrobotanici. 2012;40(1):108114.
- Duodu KG, Taylor JRN, Belton PS. Factors affecting sorghum protein digestibility. Journal of Cereal Science. 2003;38(2):117-131.
- Abdelrahman A, Hoseney RC, Varriano-Marston E. The proportions and chemical compositions of handdissected anatomical parts of pearl millet. Journal of Cereal Science. 1984;2(2):127-133.
- Rao BD, Kulkarni DB, Kavitha C. Study on evaluation of starch, dietary fiber and mineral composition of sorghum cultivars. Food Chemistry. 2018;238:82-86.
- Mehta S, Finkelstein JL, Engmann C. Iron status impacts sorghum absorption in Zambian children. Journal of Nutrition. 2019;149(10):1813-1820.