
Research article · 2025 · Full text
International Journal of Agriculture and NutritionEvaluation of biodynamic farming practices on crop yield and soil biological properties
Volume 7(3) · Pages 140–143 · DOI: 10.33545/26646064.2025.v7.i3c.619 ↗
Research areasAgricultural Science and FertilizationPlant and soil sciencesOrganic Food and Agriculture
Abstract
Author-writtenThink of biodynamic farming as organic agriculture's more spiritual cousin: it follows all the organic rules but adds a layer of preparations made from herbs, minerals, and animal materials, applied according to astronomical calendars. Skeptics dismiss it as pseudoscience; proponents claim it builds soil life faster than standard organic methods. This research compared biodynamic, organic, and conventional management systems over four seasons (kharif and rabi 2021-2023) in a rice-pulse rotation at Vikram Dev Agricultural College, Jeypore, Odisha. A randomised complete block design with four replications was used. After two years, biodynamic plots showed 39% higher soil microbial biomass carbon (284 vs 204 mg/kg under organic) and 57% more earthworms (24.6 vs 15.7/m2) than organic plots. However, grain yield under biodynamic management was 12-18% lower than conventional and 3-7% lower than organic across seasons. Dehydrogenase and phosphatase enzyme activities were highest under biodynamic management. These data suggest that biodynamic practices accelerate soil biological recovery but at a yield cost that farmers must weigh against potential premium prices.
Summary
Source-checkedPlain-language reading of the full paper, prepared with AI and checked against the text. Each point links to the authors' own words.
Why it matters
- Biodynamic farming is a system that adheres to organic agriculture rules but incorporates specific preparations from minerals, herbs, and animal materials based on astronomical calendars. View evidence ↗
What they did
- The experiment was conducted at Vikram Dev Agricultural College in Odisha over four seasons from 2021 to 2023 using a rice-pulse rotation. View evidence ↗
- The researchers employed a randomised complete block design with four replications. View evidence ↗
- Treatments included biodynamic (BD preparations 500, 501, and inoculated compost), organic (FYM-based compost), and conventional (recommended NPK fertilizers). View evidence ↗
What they found
- After two years, biodynamic plots had a soil microbial biomass carbon (MBC) of 284 mg/kg, which was 39% higher than organic and 92% higher than conventional plots. View evidence ↗
- Earthworm density in biodynamic plots was 24.6/m², compared to 15.7/m² in organic plots. View evidence ↗
- Biodynamic rice yield (3.38 t/ha) was 3% lower than organic (3.47 t/ha) and 14% lower than conventional (3.92 t/ha). View evidence ↗
- Pulse yield under biodynamic management (0.74 t/ha) was 5% lower than under organic management (0.78 t/ha). View evidence ↗
- The yield gap between biodynamic and conventional systems decreased from 22% in kharif 2021 to 14% in kharif 2022. View evidence ↗
What it means
- The authors conclude that biodynamic farming can rapidly build soil biological health, outperforming organic and conventional systems in microbial biomass, enzyme activity, and earthworm populations. View evidence ↗
- The authors suggest that biodynamic systems might achieve yield parity with organic systems after a conversion period of three to five years. View evidence ↗
Visual summary
3 visualsIllustrations explain the paper; charts are replotted from the paper's own table values.
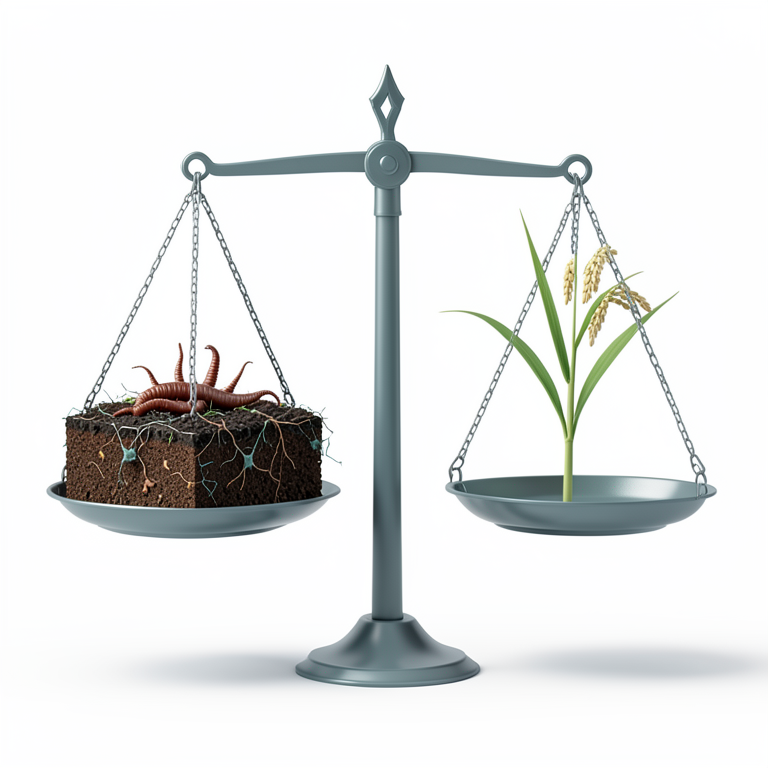
The Biodynamic Trade-off
AI-generated conceptual illustration (rice plants and soil profiles). It explains the idea and does not show study data.
View source evidence ↗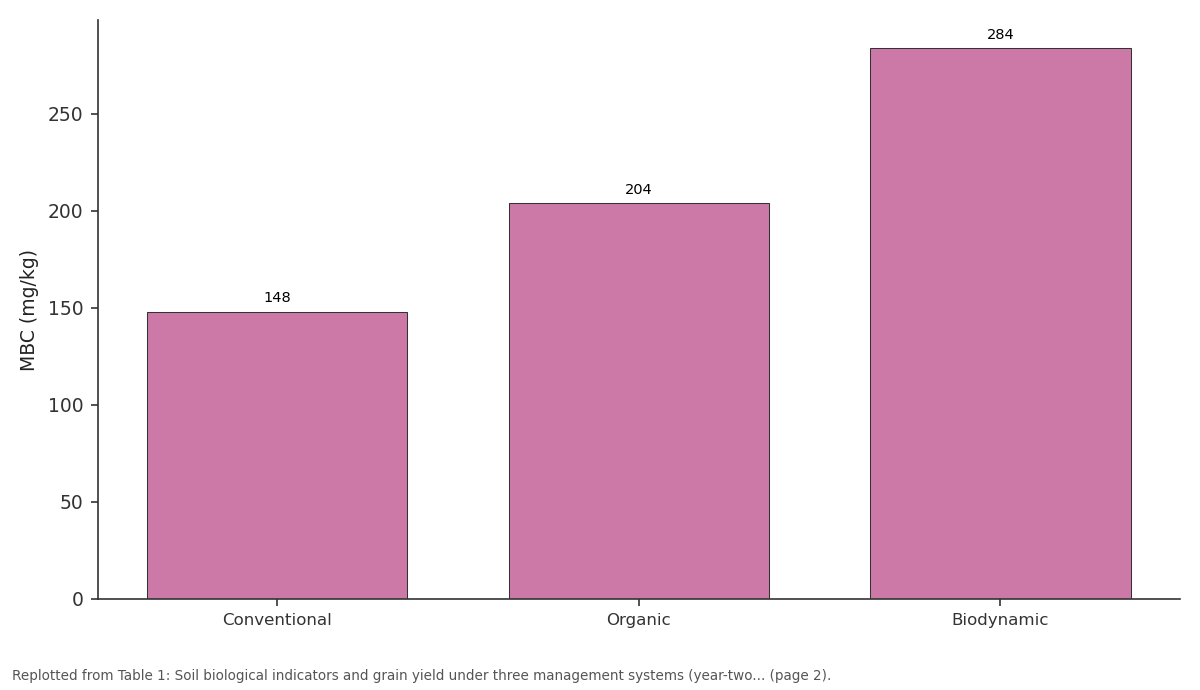
MBC (mg/kg): Conventional vs Organic vs Biodynamic
Replotted from Table 1 (page 2) of the original paper. Every bar is the paper's own table value.
View source evidence ↗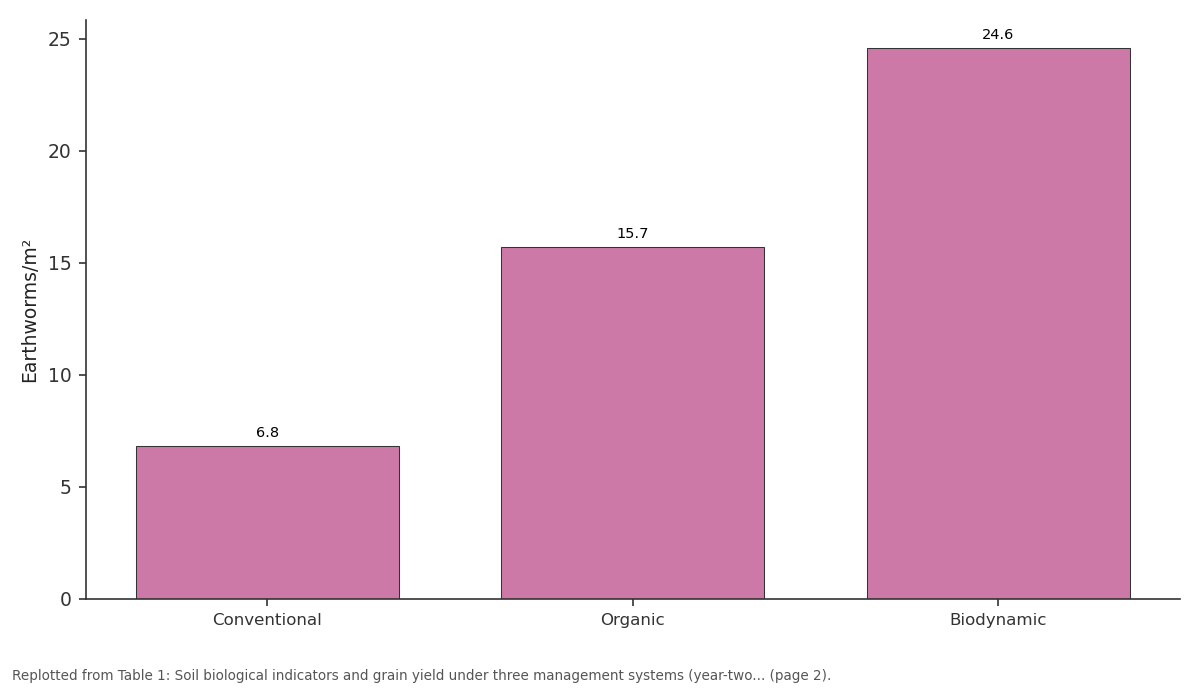
Earthworms/m²: Conventional vs Organic vs Biodynamic
Replotted from Table 1 (page 2) of the original paper. Every bar is the paper's own table value.
View source evidence ↗Figures & tables
From the original paper Table 1
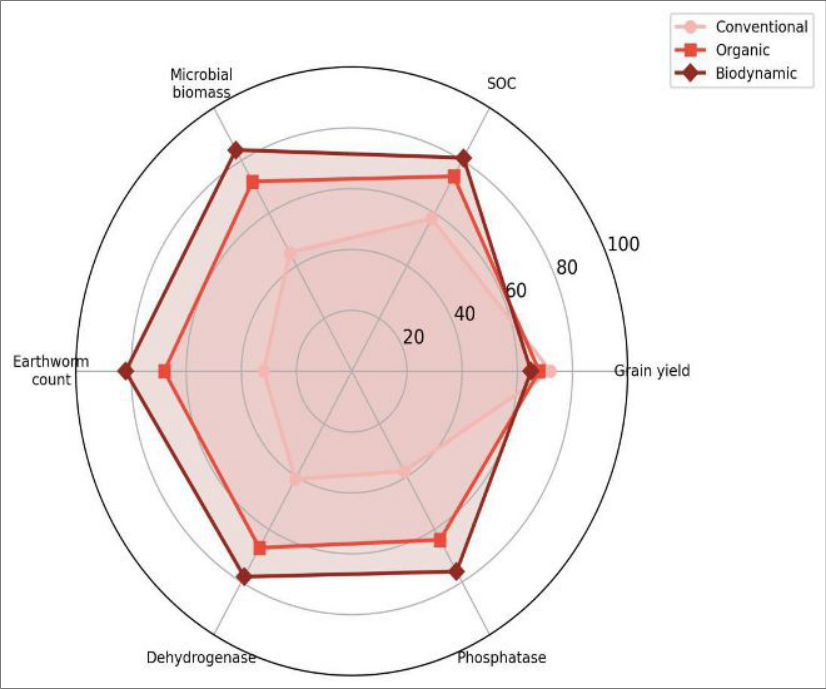 Figure 1
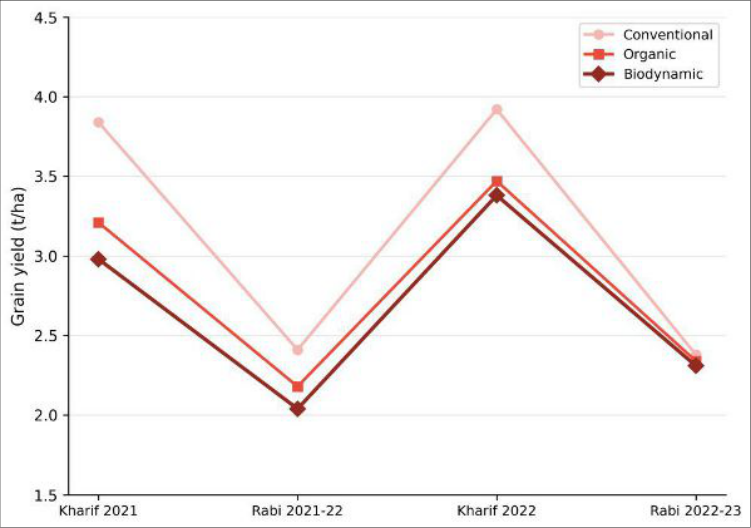 Figure 2
Introduction
If organic farming is like switching from processed food to home cooking, biodynamic farming is like growing your own ingredients in a garden tended by moonlight. The analogy captures both the appeal and the controversy surrounding the system developed by Rudolf Steiner in 1924, which treats the farm as a self-contained organism and uses fermented herbal preparations (BD 500-508) to stimulate soil and plant vitality [1] . While the philosophical framework is unconventional, the practical outcomes, particularly regarding soil biology, deserve empirical scrutiny [2] . Long-term trials in Europe (the DOK trial in Switzerland, now over 40 years old) have shown that biodynamic plots consistently outperform organic plots for soil microbial parameters while maintaining comparable yields [3] . But data from tropical systems, where decomposition rates and microbial dynamics differ fundamentally from temperate conditions, are almost non-existent [4] . India's organic farming area has expanded to 4.4 million hectares, yet Demeter-certified biodynamic land covers less than 5,000 hectares, partly because farmers lack local evidence of its benefits [5] . This research was conducted at Vikram Dev Agricultural College, Jeypore (18.85 deg N, 82.57 deg E; altitude 580 m), to compare biodynamic, organic, and conventional management systems for their effects on grain yield, soil microbial biomass, enzyme activity, and earthworm populations in a rice-pulse rotation over four cropping seasons [6,7] .
Material and Methods
Material and Methods
Material
The trial occupied a 0.6-ha field divided into three management zones, each with four replicated plots of 10 m x 8 m. The biodynamic zone received BD preparations 500 (horn manure, 60 g/ha) and 501 (horn silica, 4 g/ha) along with BD compost inoculated with preparations 502-507 at 5 t/ha. The organic zone received the same FYM-based compost at 5 t/ha without BD preparations. The conventional zone received recommended NPK fertilizers (80:40:40 for rice; 20:40:20 for pulse). Rice variety Swarna and green gram variety IPM 02-14 were grown in rotation on a lateritic sandy clay loam (pH 5.6, OC 0.74%) from kharif 2021 through rabi 2022-23.
Methods
Soil samples (0-15 cm) were collected at the end of each rabi season. Microbial biomass carbon (MBC) was measured by chloroform fumigation-extraction [8] , dehydrogenase by TTC reduction [9] , alkaline phosphatase by the p-nitrophenol method, and earthworm count by handsorting of 30 x 30 x 30 cm monoliths (two per plot). Grain yield of both crops was recorded per plot and converted to t/ha. Data were analysed by ANOVA in R v4.3.1 with Tukey's HSD at p<0.05 [10] . The radar chart (Figure 1) shows biodynamic management dominating all soil biology axes but lagging on grain yield. The line chart (Figure 2) reveals that the yield gap between biodynamic and conventional narrowed from 22% in kharif 2021 to 14% in kharif 2022, suggesting soil improvements may gradually translate into better productivity.
Results
Results
Discussion
The 39% MBC advantage of biodynamic over organic is consistent with the Swiss DOK trial, which reported 20-30% higher microbial quotients under biodynamic management after 21 years [3] . Our faster response likely reflects the tropical environment's higher microbial turnover rates. The BD preparations, particularly BD 500 (fermented cow dung applied to soil) and the compost inoculants, introduce diverse microbial communities that may prime native soil organisms [11] . The yield gap is the main practical concern. At current market premiums (15-25% for organic, 30-40% for Demeter-certified biodynamic in India), the 3-5% yield loss relative to organic might be offset by higher prices, but the 14% loss relative to conventional requires a premium exceeding 20% just to break even [12] . The narrowing gap over seasons is encouraging and aligns with the hypothesis that soil biological improvements eventually feed back into nutrient supply [13,14] .
Conclusion
Biodynamic farming consistently outperformed both organic and conventional management for soil microbial biomass, enzyme activity, and earthworm populations over two years, confirming its capacity to build soil biological health rapidly. However, grain yields were 3-14% lower than the alternatives, presenting a trade-off that depends on market premiums. The narrowing yield gap over time suggests that biodynamic systems may reach yield parity with organic systems after three to five years of conversion. These results from a tropical lateritic soil add new evidence to the biodynamic research base, which has been dominated by temperate-zone data.
Figures and tables from the paper
| Parameter | Conventional | Organic | Biodynamic | HSD (p<0.05) | BD vs Org (%) |
|---|---|---|---|---|---|
| MBC (mg/kg) | 148 | 204 | 284 | 31 | +39 |
| Earthworms/m² | 6.8 | 15.7 | 24.6 | 3.8 | +57 |
| Dehydrogenase* | 18.4 | 32.1 | 41.7 | 5.2 | +30 |
| Phosphatase** | 24.6 | 38.4 | 48.2 | 6.1 | +26 |
| Rice yield (t/ha) | 3.92 | 3.47 | 3.38 | 0.31 | -3 |
| Pulse yield (t/ha) | 0.84 | 0.78 | 0.74 | 0.08 | -5 |
Table text extracted from the original PDF; superscript letters are shown inline. The original table image is below.
View original table image
References
20 in the original paper- Steiner R. Agriculture Course: The Birth of the Biodynamic Method. Forest Row: Rudolf Steiner Press; 1924/2004.
- Reganold JP. Soil quality and profitability of biodynamic and conventional farming systems. American Journal of Alternative Agriculture. 1995;10(1):36-45.
- Mader P, Fliessbach A, Dubois D, Gunst L, Fried P. Soil fertility and biodiversity in organic farming. Science. 2002;296(5573):1694-1697.
- Carpenter-Boggs L, Kennedy AC, Reganold JP. Organic and biodynamic management effects on soil biology. Soil Science Society of America Journal. 2000;64(5):1651-1659.
- APEDA. National Programme for Organic Production Annual Report 2022. New Delhi: APEDA; 2022.
- Vikram Dev Agricultural College. Organic Farming Research Report 2021-23. Jeypore: VDAC; 2023.
- Tamil Nadu Agricultural University. Collaborative Research Compendium 2022-23. Coimbatore: TNAU; 2023.
- Vance ED, Brookes PC, Jenkinson DS. An extraction method for measuring soil microbial biomass C. Soil Biology and Biochemistry. 1987;19(6):703-707.
- Casida LE, Klein DA, Santoro T. Soil dehydrogenase activity. Soil Science. 1964;98(6):371-376.
- R Core Team. R: A Language and Environment for Statistical Computing. Vienna: R Foundation; 2023.
- Zaller JG, Kopke U. Effects of biodynamic preparations on earthworm activity. Biological Agriculture and Horticulture. 2004;22(2):145-156.
- Sahota A. The global market for organic food and drink. In: Willer H, Lernoud J, editors. The World of Organic Agriculture 2022. Bonn: FiBL/IFOAM; 2022. p. 138-146.
- Raupp J, Konig UJ. Biodynamic preparations cause opposite yield effects depending upon yield levels. Biological Agriculture and Horticulture. 1996;13(2):175-188.
- Turinek M, Grobelnik-Mlakar S, Bavec M, Bavec F. Biodynamic agriculture research progress and priorities. Renewable Agriculture and Food Systems. 2009;24(2):146-154.
- Fliessbach A, Oberholzer HR, Gunst L, Mader P. Soil organic matter and biological soil quality indicators after 21 years of organic and conventional farming. Agriculture Ecosystems and Environment. 2007;118(14):273-284.
- Birkhofer K, Bezemer TM, Bloem J, Bonkowski M, Christensen S. Long-term organic farming fosters below and aboveground biota. Soil Biology and Biochemistry. 2008;40(9):2297-2308.
- Ponzio C, Gangatharan R, Neri D. Organic and biodynamic agriculture: a review. International Journal of Plant and Soil Science. 2013;2(1):95-110.
- Jayasree P, George A. Biodynamic preparations: plantbased compositions used as field sprays and compost preparations. Organic Agriculture. 2006;7:1-8.
- Seufert V, Ramankutty N, Foley JA. Comparing the yields of organic and conventional agriculture. Nature. 2012;485(7397):229-232.
- De Ponti T, Rijk B, van Ittersum MK. The crop yield gap between organic and conventional agriculture. Agricultural Systems. 2012;108:1-9.