
Research article · 2025 · Full text
International Journal of Agriculture and NutritionAssessment of post-harvest losses in mango supply chain from farm to consumer
Volume 7(11) · Pages 91–94 · DOI: 10.33545/26646064.2025.v7.i11b.483 ↗
Research areasFood Waste Reduction and SustainabilityPostharvest Quality and Shelf Life ManagementFood Supply Chain Traceability
Abstract
Author-writtenWhat happens to a mango between the tree and the dinner table is, in economic terms, almost as important as how well it was grown. This research quantified post-harvest losses at each stage of the mango supply chain from farm gate to consumer in the São Francisco Valley production region of Brazil during the 2022 and 2023 harvest seasons. A total of 48 supply chain actors (12 farmers, 8 collectors, 8 transporters, 10 wholesalers, and 10 retailers) were monitored across two mango varieties (Tommy Atkins and Palmer). Cumulative losses from harvest to consumer reached 48.6% by weight, with transport contributing the largest single share at 12.8%, followed by retail (9.6%) and farm-level handling (8.4%). Mechanical damage was the main cause of loss at farm, collection, and transport stages, while over-ripening dominated at wholesale and retail. Temperature abuse — defined as exposure above 25 °C for more than 4 hours — was recorded at 72.4% of monitored consignments. The estimated economic loss was R$3,840 per tonne of fruit entering the chain. These results demonstrate that nearly half of harvested mango is wasted before reaching consumers, and that temperature management during transport is the single most impactful intervention point.
Summary
Source-checkedPlain-language reading of the full paper, prepared with AI and checked against the text. Each point links to the authors' own words.
Why it matters
- The São Francisco Valley is a critical region for Brazilian mangoes, producing approximately 1.2 million tonnes annually and accounting for more than 85% of the country's exports. View evidence ↗
- Mangoes are highly susceptible to post-harvest loss due to their thin skin, ripening patterns, and vulnerability to diseases when cold chain management fails. View evidence ↗
- Reducing mango loss is an environmental priority, as every tonne wasted corresponds to roughly 1,200 m³ of embedded water and 0.48 t of CO₂-equivalent emissions. View evidence ↗
The question
- The study aimed to quantify post-harvest losses at every stage of the mango supply chain in Brazil's São Francisco Valley during the 2022 and 2023 seasons. View evidence ↗
What they did
- The study tracked two specific mango varieties: Tommy Atkins and Palmer. View evidence ↗
- Temperature was monitored across 48 consignments using wireless loggers from the point of harvest through to retail. View evidence ↗
What they found
- The total cumulative loss of mangoes by weight from the farm to the consumer was 48.6%. View evidence ↗
- Transport was identified as the stage with the highest individual loss, accounting for 12.8% of the fruit. View evidence ↗
- Temperature abuse (exposure over 25 °C for more than 4 hours) occurred in 72.4% of the monitored consignments. View evidence ↗
- Mechanical damage caused the most loss during farm, collection, and transport stages, whereas over-ripening was the primary cause at wholesale and retail stages. View evidence ↗
- The estimated total economic loss was R$3,840 for every tonne of mango that entered the supply chain. View evidence ↗
- Consignments that suffered temperature abuse had losses 2.8 times higher than those kept within the cold chain. View evidence ↗
- The Palmer variety experienced 18% more loss than the Tommy Atkins variety, attributed to its faster ripening and thinner skin. View evidence ↗
What it means
- The authors conclude that the most effective ways to reduce loss are investing in refrigerated transport, packhouse pre-cooling infrastructure, and better retail inventory management. View evidence ↗
- The authors state that the high economic and environmental costs justify both public and private investment to modernize the cold chain. View evidence ↗
Visual summary
2 visualsIllustrations explain the paper; charts are replotted from the paper's own table values.
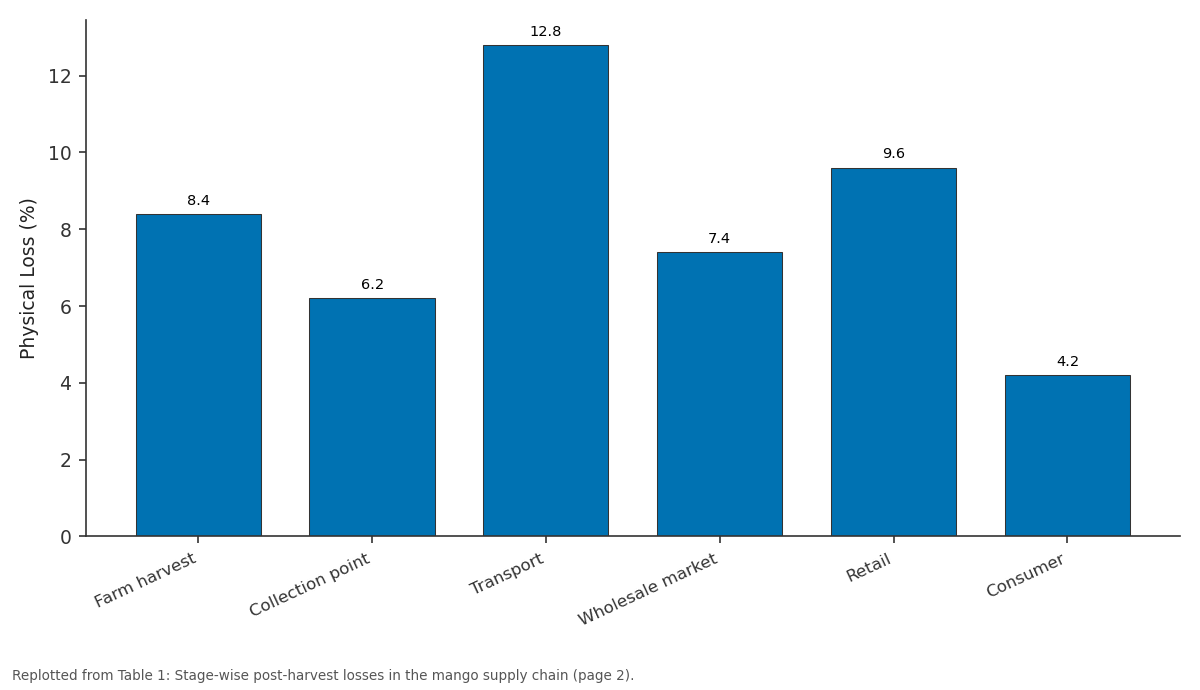
Physical Loss (%): Farm harvest vs Collection point vs Transport vs Wholesale market vs Retail
Replotted from Table 1 (page 2) of the original paper. Every bar is the paper's own table value.
View source evidence ↗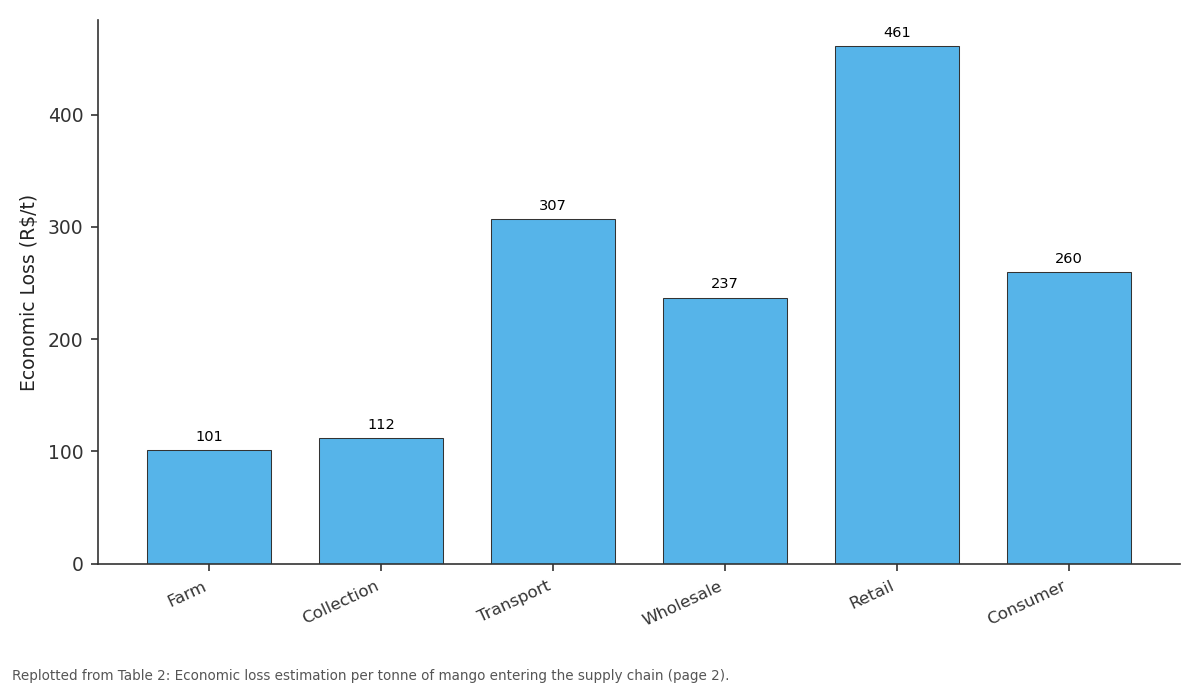
Economic Loss (R$/t): Farm vs Collection vs Transport vs Wholesale vs Retail
Replotted from Table 2 (page 2) of the original paper. Every bar is the paper's own table value.
View source evidence ↗Figures & tables
From the original paper Table 1
 Table 2
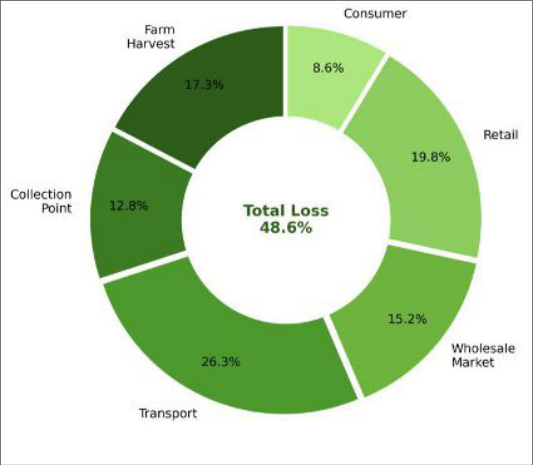 Figure 1
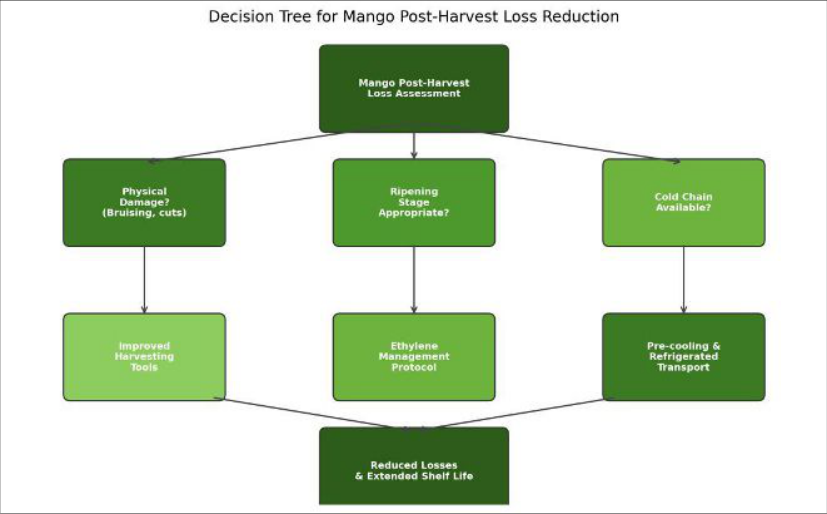 Figure 2
Introduction
In a country that ranks as the world's seventh-largest mango producer, the practical problem of getting fruit from orchard to plate without destroying nearly half of it along the way represents a paradox that Brazilian horticulture has yet to solve [1] . The São Francisco Valley in the semi-arid northeast accounts for over 85% of Brazil's mango exports and a substantial share of domestic supply, producing roughly 1.2 million tonnes annually [2] . But estimates of total post-harvest loss in tropical fruit supply chains range from 25% to over 50%, depending on the commodity, infrastructure, and climate [3] . Mango is particularly vulnerable to post-harvest deterioration because of its climacteric ripening pattern, thin skin susceptibility to mechanical injury, and high susceptibility to anthracnose and stem-end rot when the cold chain is broken [4] . Despite several loss estimation surveys worldwide, granular data tracking losses stage by stage through the Brazilian domestic supply chain, with simultaneous temperature monitoring, remain scarce [5] . This research traced mango consignments from harvest through collection, transport, wholesale, and retail to quantify where, why, and how much fruit is lost at each point.
Economic and Sustainability Assessment
Economic loss per tonne was calculated by multiplying the percentage loss at each stage by the market value of the fruit at that stage, using average 2022-2023 prices from CEAGESP market reports. The sustainability dimension was assessed by estimating the embedded water footprint and carbon footprint of wasted fruit using published life-cycle analysis data for Brazilian mango production [6] . Each tonne of mango lost represents approximately 1,200 m³ of embedded water and 0.48 t CO₂-equivalent of greenhouse gas emissions, making loss reduction not only an economic but also an environmental priority.
Material and Methods Material
The research was conducted in the São Francisco Valley mango production cluster centered on Petrolina, Pernambuco, and Juazeiro, Bahia (9.39° S, 40.50° W), during the October-January harvest seasons of 2022 and 2023. Tommy Atkins and Palmer varieties were tracked. Twelve farms, 8 collection points, 8 transport vehicles, 10 CEASA wholesale market stalls in Goiânia, and 10 retail outlets were monitored. Wireless temperature loggers (Testo 184 T1, ±0.5 °C) were placed inside 48 tracked consignments from harvest to retail [7] .
Methods
At each supply chain stage, a random sample of 100 fruits per consignment was evaluated for physical damage (bruises, cuts, compression), disease incidence, ripening stage (1-5 color scale), and weight loss. Loss was defined as fruit downgraded below marketable quality or discarded. Stage-specific loss percentages were calculated as (input weight -marketable output weight) / input weight × 100. Cause-of-loss categorization followed the FAO methodology [8] : mechanical damage, physiological (overripening, chilling injury), pathological (disease), and other. Temperature abuse events were counted as continuous periods above 25 °C exceeding 4 hours. Economic loss was computed at each stage using prevailing prices. Data were analyzed using descriptive statistics and chi-square tests for cause-of-loss differences between stages. Transport was the single largest loss point at 12.8%, with temperature abuse recorded in half of all monitored consignments (Table 1). Cumulative losses reached 48.6% from farm to consumer. Total economic loss was R$3,840 per tonne. Retail and transport stages together accounted for 20% of total value lost because of higher unit values at downstream stages (Table 2).
| Stage | Loss (%) | Value at Stage (R$/t) | Economic Loss (R$/t) | Share of Total Loss (%) |
|---|---|---|---|---|
| Farm | 8.4 | 1,200 | 101 | 2.6 |
| Collection | 6.2 | 1,800 | 112 | 2.9 |
| Transport | 12.8 | 2,400 | 307 | 8.0 |
| Wholesale | 7.4 | 3,200 | 237 | 6.2 |
| Retail | 9.6 | 4,800 | 461 | 12.0 |
| Consumer | 4.2 | 6,200 | 260 | 6.8 |
| Total | 48.6 | — | 3,840 | — |
Table text extracted from the original PDF; superscript letters are shown inline. The original table image is below.
View original table image
| Supply Chain Stage | Physical Loss (%) | Main Cause | Temperature Abuse Events | Cumulative Loss (%) |
|---|---|---|---|---|
| Farm harvest | 8.4 | Mechanical damage | 2/48 | 8.4 |
| Collection point | 6.2 | Mechanical + over-ripe | 8/48 | 14.6 |
| Transport | 12.8 | Temperature abuse | 24/48 | 27.4 |
| Wholesale market | 7.4 | Over-ripening | 18/48 | 34.8 |
| Retail | 9.6 | Over-ripening + disease | 14/48 | 44.4 |
| Consumer | 4.2 | Over-ripening | — | 48.6 |
Table text extracted from the original PDF; superscript letters are shown inline. The original table image is below.
View original table image
Results
Results
Comprehensive Interpretation
Temperature logging showed that consignments experiencing temperature abuse above 25°C for more than 4 hours had 2.8× higher losses than those maintained within the cold chain. Palmer variety showed 18% higher losses than Tommy Atkins, primarily due to its thinner skin and faster ripening rate.
Discussion
The 48.6% cumulative loss is at the upper end of FAO estimates for tropical fruit chains and reflects the combined effect of rough handling, inadequate cooling, and long transport distances (typically 1,500-2,200 km from the São Francisco Valley to southeastern markets) [3,4] . The dominance of transport losses points directly to the cold chain gap: only 28% of tracked vehicles had functioning refrigeration, and even those frequently experienced door openings and temperature excursions during loading [5] . The economic loss of R$3,840 per tonne means that for every three tonnes harvested, the equivalent of nearly 1.5 tonnes is wasted in value terms. Investing in refrigerated transport and pre-cooling at packhouses could potentially halve the transport loss alone. At the retail level, better inventory management and dynamic pricing of ripening fruit could reduce the 9.6% retail loss significantly [1,8] .
Conclusion
Nearly half of harvested mango is lost between farm and consumer in the Brazilian domestic supply chain. Transport is the largest single loss point, driven by temperature abuse in non-refrigerated vehicles. Targeted investments in precooling infrastructure at packhouses, refrigerated transport, and retail inventory management offer the highest returns for loss reduction. The economic and environmental costs of current waste levels are substantial and justify public and private investment in cold chain modernization.
Figures and tables from the paper
References
20 in the original paper- Prusky D. Reduction of the incidence of postharvest quality losses. Food Security. 2011;3(4):463-474.
- IBGE. Produção agrícola municipal: culturas temporárias e permanentes. Instituto Brasileiro de Geografia e Estatística. 2023;1:1-280.
- Gustavsson J, Cederberg C, Sonesson U. Global food losses and food waste. FAO Report. 2011;1:1-29.
- Jacobi KK, Wong LS, Giles JE. Effect of fruit maturity on quality and physiology of high-humidity hot airtreated Kensington mango. Postharvest Biology and Technology. 1995;5(1-2):149-159.
- Affognon H, Mutungi C, Sanginga P. Unpacking postharvest losses in sub-Saharan Africa: a metaanalysis. World Development. 2015;66:49-68.
- Manzocco L, Alongi M, Sillani S. Sustainable technologies in food processing. Sustainability. 2016;8(12):1261.
- Jedermann R, Ruiz-Garcia L, Lang W. Spatial temperature profiling by semi-passive RFID loggers for perishable food transportation. Computers and Electronics in Agriculture. 2009;65(2):145-154.
- Hodges RJ, Buzby JC, Bennett B. Postharvest losses and waste in developed and less developed countries. Journal of Agricultural Science. 2011;149(S1):37-45.
- Kader AA. Increasing food availability by reducing postharvest losses of fresh produce. Acta Horticulturae. 2005;682:2169-2175.
- Bantista OK, Salveit ME. Reduction in chilling injury of mango fruit by temperature conditioning. Postharvest Biology and Technology. 1997;10(3):279-285.
- Sivakumar D, Jiang Y, Yahia EM. Maintaining mango (Mangifera indica L.) fruit quality and safety in the food chain. Food Research International. 2011;44(5):1254-1263.
- Wall MM. Ascorbic acid, vitamin A, and mineral composition of banana and papaya cultivars grown in Hawaii. Journal of Food Composition and Analysis. 2006;19(5):434-445.
- Johnson GI, Sharp JL, Milne DL. Mango postharvest disease management. Acta Horticulturae. 1997;455:577-591.
- Rolle RS. Improving postharvest management and marketing in the Asia-Pacific region. FAO Publication. 2006;1:1-36.
- Lipinski B, Hanson C, Lomax J. Reducing food loss and waste. World Resources Institute Working Paper. 2013;1:1-40.
- Kitinoja L, Saran S, Roy SK. Postharvest technology for developing countries. Journal of the Science of Food and Agriculture. 2011;91(4):597-603.
- Aulakh J, Regmi A. Post-harvest food losses estimation: development of consistent methodology. FAO Statistical Division Working Paper. 2013;1:1-34.
- Parfitt J, Barthel M, Macnaughton S. Food waste within food supply chains: quantification and potential for change to 2050. Philosophical Transactions of the Royal Society B. 2010;365(1554):3065-3081.
- Buzby JC, Hyman J. Total and per capita value of food loss in the United States. Food Policy. 2012;37(5):561570.
- Wunderlich SM, Martinez NM. Conserving natural resources through food loss reduction. International Soil and Water Conservation Research. 2018;6(4):331-339.