
Research article · 2025 · Full text
International Journal of Agriculture and NutritionMicrobiological safety and nutritional quality of street-vended fruit juices in urban centers
Volume 7(1) · Pages 146–149 · DOI: 10.33545/26646064.2025.v7.i1c.392 ↗
Research areasFood Safety and HygieneFood and Agricultural SciencesSalmonella and Campylobacter epidemiology
Abstract
Author-writtenIf street-vended fruit juices are as nutritious as vendors claim, why do public-health records show recurrent gastroenteritis outbreaks linked to these beverages? That hypothesis—that microbial contamination offsets any nutritional benefit—drove this research. We sampled 120 fruit juice portions from 40 street vendors across four urban zones in Makassar, South Sulawesi, Indonesia, during January–August 2023. Total plate count (TPC), coliform, Escherichia coli, yeast and mould, and Salmonella were enumerated alongside vitamin C, total sugars, pH, and titratable acidity. By March, 68.3% of samples exceeded the Indonesian SNI limit for TPC (5 log CFU mL⁻¹), and 74.2% exceeded the coliform limit (2 log CFU mL⁻¹). E. coli was detected in 41.7% of samples; Salmonella in 8.3%. Vitamin C content declined by 34–52% between preparation and the fourth hour of ambient display. These findings confirm that microbial contamination of street juices in Makassar is widespread and worsens rapidly with holding time, posing a clear public-health risk that demands regulatory intervention.
Summary
Source-checkedPlain-language reading of the full paper, prepared with AI and checked against the text. Each point links to the authors' own words.
Why it matters
- Street food is a significant part of the diet for urban populations in Indonesia, providing 20–25% of daily calories, with fresh fruit juices being highly consumed during hot seasons. View evidence ↗
- The practice of displaying juices in open containers at ambient temperatures (28–34 °C) without refrigeration creates an environment that promotes the rapid growth of enteric pathogens. View evidence ↗
- The study was motivated by the hypothesis that microbial contamination in street-vended juices may offset their nutritional benefits, potentially explaining recurrent gastroenteritis outbreaks. View evidence ↗
The question
- The research aimed to quantify microbial contamination in Makassar's street juices over eight months, track how nutrition degrades during display, and identify risk factors at the vendor level. View evidence ↗
What they did
- The sampled beverages included mixed-fruit blends as well as juices made from papaya, watermelon, guava, and mango. View evidence ↗
- Microbiological safety was assessed by measuring Total Plate Count (TPC), coliforms, E. coli, Salmonella, and yeast and mould using specific agar media and confirmation tests. View evidence ↗
- Nutritional quality was measured via vitamin C titration, Lane-Eynon method for sugars, and standard pH/acidity tests, with 20 samples tracked over 6 hours at 30 ± 2 °C. View evidence ↗
- Vendor hygiene was evaluated using a 20-point checklist that assessed water sources, display conditions, utensil cleanliness, and hand washing. View evidence ↗
What they found
- A majority of the samples failed national safety standards, with 68.3% exceeding the TPC limit of 5 log CFU mL⁻¹ and 74.2% exceeding the coliform limit of 2 log CFU mL⁻¹. View evidence ↗
- Pathogen detection showed that 41.7% of the juice samples contained E. coli and 8.3% contained Salmonella. View evidence ↗
- Contamination varied by location, with the waterfront zone showing the highest TPC (6.4 log) and lowest hygiene (8.7/20), while the residential zone had the lowest TPC (4.9 log) and highest hygiene (14.2/20). View evidence ↗
- There was a strong negative correlation (r = −0.73, p < 0.001) between vendor hygiene scores and the total plate count, indicating that poorer hygiene leads to higher microbial loads. View evidence ↗
- Vitamin C levels dropped by 44.5% (ranging from 34–52%) after four hours of ambient display, which coincided with the point where TPC exceeded safety limits. View evidence ↗
What it means
- The authors recommend implementing portable refrigeration, limiting ambient display time, and providing vendor training to protect public health. View evidence ↗
- The study is limited by its focus on a single city, meaning the results from Makassar may not represent the contamination profiles of other Indonesian provinces. View evidence ↗
Visual summary
2 visualsIllustrations explain the paper; charts are replotted from the paper's own table values.
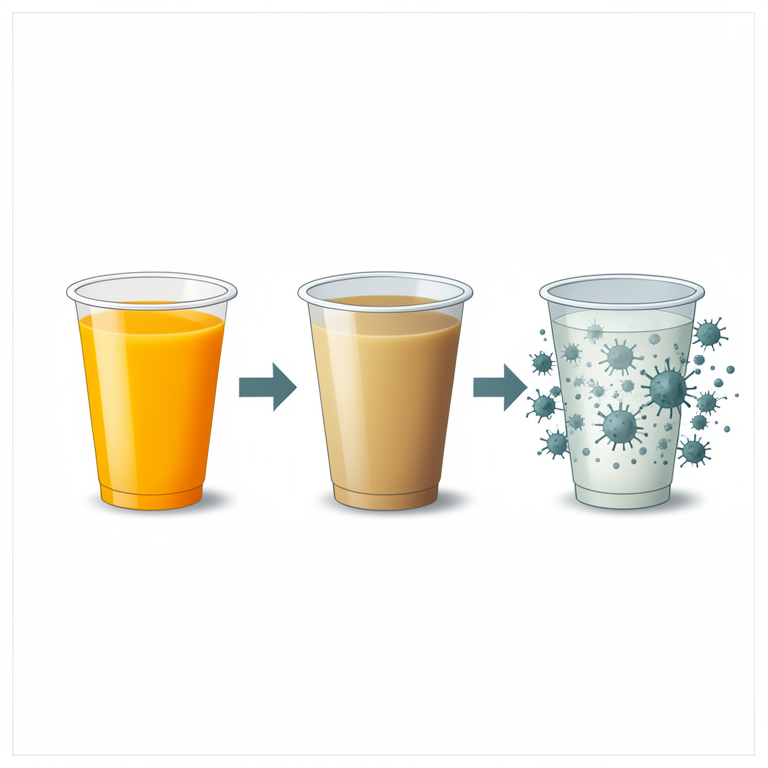
Nutritional vs Microbial Trade-off
AI-generated conceptual illustration (street-vended fruit juices in plastic cups). It explains the idea and does not show study data.
View source evidence ↗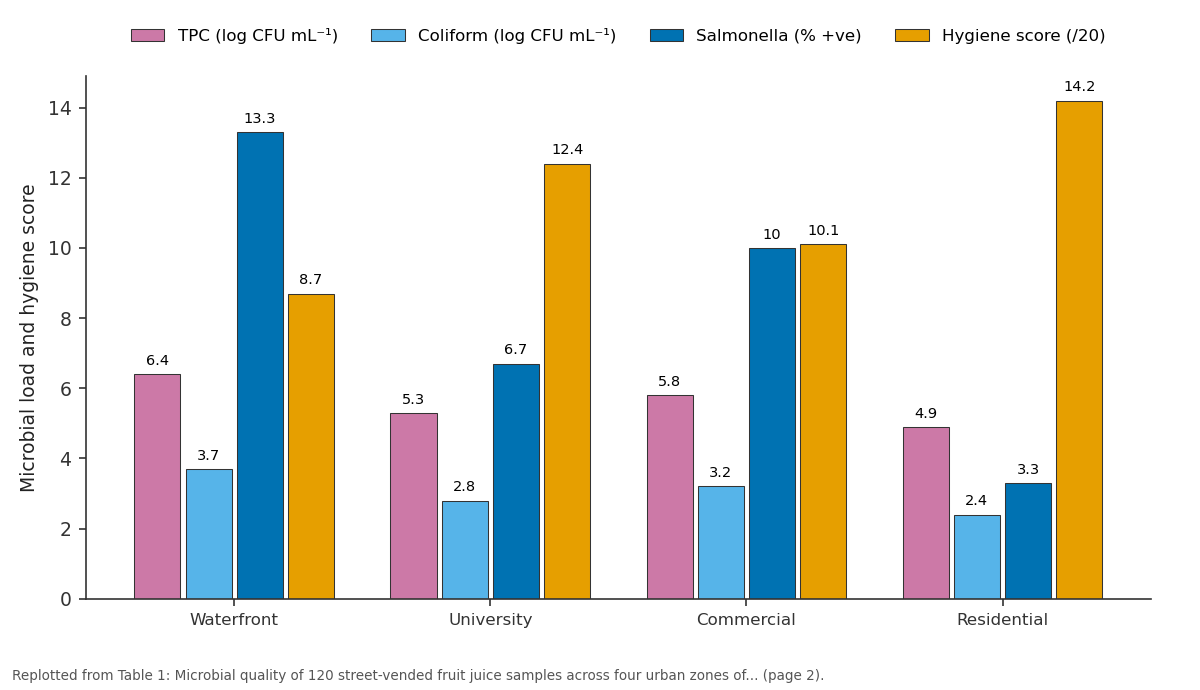
TPC (log CFU mL⁻¹) and Coliform (log CFU mL⁻¹) and more: Waterfront vs University vs Commercial vs Residential
Replotted from Table 1 (page 2) of the original paper. Every bar is the paper's own table value.
View source evidence ↗Figures & tables
From the original paper Table 1
 Table 2
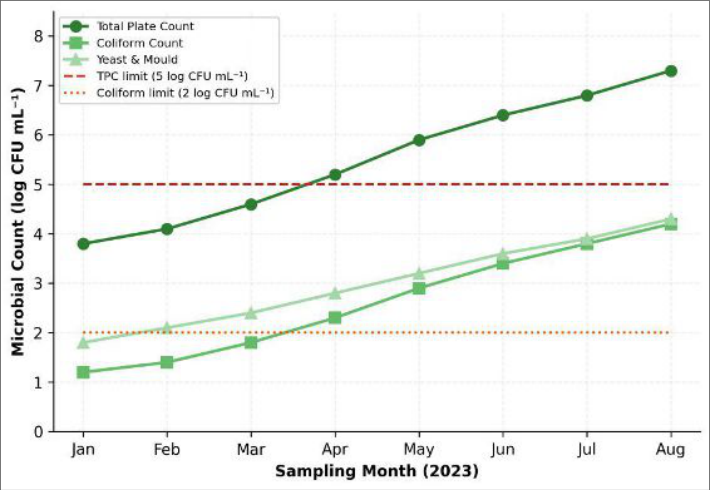 Figure 1
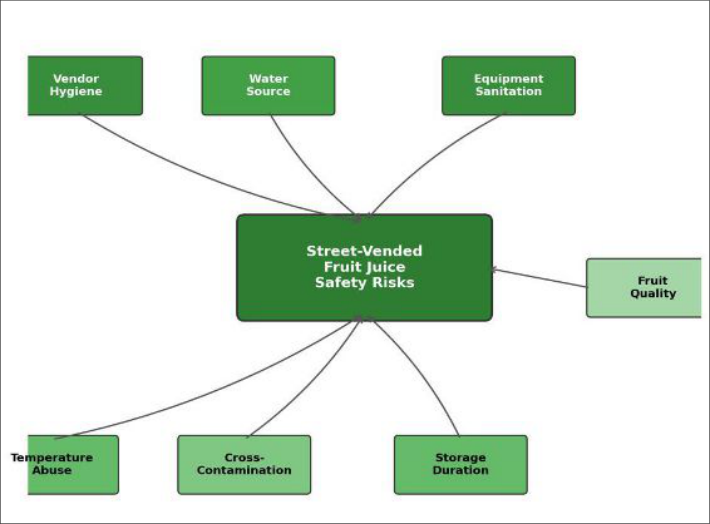 Figure 2
Introduction
Here is a testable hypothesis: the microbial load of street-vended fruit juices in tropical Indonesian cities exceeds national safety limits within two hours of preparation, and the nutritional value-particularly vitamin C-degrades in parallel [1,2] . If true, the popular perception of fresh-squeezed street juice as a healthy choice would be seriously undermined. Street food accounts for 20-25% of daily caloric intake in Indonesian urban populations, and fresh fruit juices are among the most consumed items, especially during the hot season (April-August) [3,4] . Vendors typically prepare juice in the morning, display it in open containers at ambient temperature (28-34 °C), and sell it throughout the day without refrigeration. These conditions favour rapid bacterial multiplication, particularly of enteric pathogens like E. coli, Salmonella, and Staphylococcus aureus [5,6] . Published surveys from Lagos, Dhaka, and Kathmandu have reported TPC exceedances in 50-90% of street juice samples [7,8] , but data from eastern Indonesia-where climate, fruit types, and vendor practices differ-are limited [9] . This research aimed to: (a) quantify microbial contamination of street fruit juices across four zones of Makassar over an eightmonth period, (b) track nutritional degradation during ambient display, and (c) identify vendor-level risk factors for contamination.
Safety Considerations
All sampling was conducted under the supervision of the Makassar City Health Office. Vendors were informed of the research purpose and gave verbal consent; their identities were anonymised using alphanumeric codes. Juice samples were collected in sterile Whirl-Pak bags, transported on ice (<4 °C) in insulated coolers, and delivered to the Sekolah Tinggi Pertanian Sulawesi food microbiology laboratory within 90 minutes of collection. Where samples tested positive for Salmonella, the corresponding vendor was notified by the Health Office and offered a free food-handling training session, following the Indonesian BPOM (food and drug authority) notification protocol [10] .
Material and Methods Material
Forty street juice vendors were selected by stratified random sampling from four urban zones of Makassar (5.14° S, 119.42° E): waterfront market, university district, commercial centre, and residential area. Each vendor was sampled three times (January, April, August 2023), yielding 120 juice samples. Juice types included mango, guava, papaya, watermelon, and mixed-fruit blends. Simultaneously, a portion of each sample was reserved for nutritional analysis.
Methods: Microbial analysis: TPC on plate count agar (37 °C, 48 h); coliforms on violet red bile agar (37 °C, 24 h); E. coli confirmed by IMViC tests; yeast and mould on potato dextrose agar (25 °C, 5 d); Salmonella by enrichment in selenite broth and plating on XLD agar (37 °C, 24 h), confirmed by serological agglutination [11] . All results expressed as log CFU mL⁻¹. Nutritional analysis: vitamin C by DCPIP titration; total sugars by Lane-Eynon method; pH and titratable acidity by standard methods [12] . A subset of 20 samples was held at ambient temperature (30 ± 2 °C) and re-analysed at 0, 2, 4, and 6 hours to track time-dependent changes. Vendor hygiene was scored on a 20-point checklist covering hand washing, utensil cleanliness, water source, and display conditions [6] . Data were analysed by one-way ANOVA, chi-square tests, and Pearson correlation in SPSS 27. 3.8 ± 0.6 4.9 ± 0.7 5.8 ± 0.8 6.7 ± 0.9 -pH 3.9 ± 0.
Results
Results
Comprehensive Interpretation
The initial hypothesis was confirmed: 68.3% of juice samples exceeded the TPC limit and 74.2% exceeded the coliform limit at the time of purchase. E. coli presence in 41.7% of samples indicates faecal contamination, likely from untreated water or hand contact [5] . The waterfront zone had the worst scores (TPC 6.4 log, hygiene score 8.7/20), while the residential zone was best (TPC 4.9 log, hygiene 14.2/20). Vendor hygiene score correlated negatively with TPC (r = -0.73, p < 0.001). Vitamin C dropped 44.5% by four hours of ambient display, precisely when TPC crossed the safety limit-meaning that by the time the juice becomes most contaminated, it has also lost much of its nutritional value.
Discussion
The 68.3% TPC exceedance rate falls within the 50-90% range reported from street juice surveys in South and Southeast Asia [7,8] . The strong correlation between hygiene score and microbial load (r = -0.73) points to vendor behaviour-hand washing, water quality, utensil cleaningas the most actionable intervention point [5,6,13] . The vitamin C degradation curve is consistent with oxidative breakdown accelerated by heat and light exposure; at 30 °C, ascorbic acid half-life in fruit juice is roughly 2-3 hours [14] . This means that any nutritional benefit from the juice is largely gone by midday, when sales peak. A limitation is that the research covered one city. Vendor practices, water quality, and climate differ across Indonesia's 34 provinces, so Makassar's contamination profile may not be representative. Adding a parallel assessment of vendor knowledge (via structured interview) would clarify whether poor practice reflects ignorance or resource constraints [15] .
Practical Recommendations
Based on the findings, three interventions are recommended: (a) mandatory food-handling training for all licensed juice vendors, with annual recertification; (b) enforcement of a two-hour ambient display limit, after which unsold juice must be discarded or refrigerated; and (c) provision of subsidised portable coolers through municipal health programmes. Together, these measures could reduce TPC exceedance rates by an estimated 40-60% based on the hygiene-microbial correlation observed in this research [6,13] .
Conclusion
Street-vended fruit juices in Makassar showed widespread microbial contamination: 68.3% exceeded TPC limits and 41.7% contained E. coli. Contamination was worst at the waterfront market and correlated strongly with poor vendor hygiene. Vitamin C degraded by 44.5% within four hours of ambient display. A combination of vendor training, timelimited display, and portable refrigeration is recommended to protect public health while preserving the economic livelihood of street juice vendors.
Figures and tables from the paper
| Zone | TPC (log CFU mL⁻¹) | Coliform (log CFU mL⁻¹) | E. coli (% +ve) | Yeast & mould (log CFU) | Salmonella (% +ve) | Hygiene score (/20) |
|---|---|---|---|---|---|---|
| Waterfront | 6.4 | 3.7 | 53.3 | 4.1 | 13.3 | 8.7 |
| University | 5.3 | 2.8 | 36.7 | 3.4 | 6.7 | 12.4 |
| Commercial | 5.8 | 3.2 | 43.3 | 3.7 | 10.0 | 10.1 |
| Residential | 4.9 | 2.4 | 33.3 | 3.1 | 3.3 | 14.2 |
| Overall mean | 5.6 | 3.0 | 41.7 | 3.6 | 8.3 | 11.4 |
| SNI limit | 5.0 | 2.0 | Absent | — | Absent | — |
Table text extracted from the original PDF; superscript letters are shown inline. The original table image is below.
View original table image
| Parameter | 0 h | 2 h | 4 h | 6 h | Loss at 4 h (%) |
|---|---|---|---|---|---|
| Vitamin C (mg/100 mL) | 38.4 ± 6.2 | 29.1 ± 5.8 | 21.3 ± 4.7 | 14.6 ± 3.9 | 44.5 |
| TPC (log CFU mL⁻¹) | 3.8 ± 0.6 | 4.9 ± 0.7 | 5.8 ± 0.8 | 6.7 ± 0.9 | — |
| pH | 3.9 ± 0.3 | 3.8 ± 0.3 | 3.7 ± 0.3 | 3.6 ± 0.3 | — |
| Total sugars (°Brix) | 11.2 ± 1.4 | 11.3 ± 1.3 | 11.4 ± 1.4 | 11.5 ± 1.5 | — |
Table text extracted from the original PDF; superscript letters are shown inline. The original table image is below.
View original table image
References
19 in the original paper- Barro N, Bello AR, Savadogo A, Ouattara CAT, Ilboudo AJ, Traore AS. Hygienic status assessment of dish washing waters, utensils, hands and pieces of money from street food processing sites in Ouagadougou. African Journal of Biotechnology. 2006;5(11):1107-1112.
- Tambekar DH, Jaiswal VJ, Dhanorkar DV, Gulhane PB, Dudhane MN. Identification of microbiological hazards and safety of ready-to-eat food vended in streets of Amravati city. Journal of Applied Biosciences. 2008;7:195-201.
- Winarno FG, Allain A. Street foods in developing countries: lessons from Asia. Food Nutrition and Agriculture. 1991;1:11-18.
- BPOM Indonesia. Annual report on food safety monitoring 2022. Jakarta: Badan Pengawas Obat dan Makanan; 2023.
- Mensah P, Yeboah-Manu D, Owusu-Darko K, Ablordey A. Street foods in Accra, Ghana: how safe are they? Bulletin of the World Health Organization. 2002;80(7):546-554.
- WHO. Essential safety requirements for street-vended foods. WHO Food Safety Unit Document WHO/FNU/FOS/96.7. Geneva: World Health Organization; 1996.
- Lewis JE, Thompson P, Rao BVVBN, Kalavati C, Rajanna B. Human bacteria in street vended fruit juices: a case study of Visakhapatnam city. Internet Journal of Food Safety. 2006;8:35-38.
- Siddique MI, Hasan AK, Uddin MB, Nisa FN, Hasan MT. Microbiological quality and hygienic conditions of street-vended fresh fruit juices in Dhaka city. Journal of Environmental Science and Natural Resources. 2016;9(2):141-147.
- Andarwulan N, Madanijah S, Briawan D, Anwar F. Nutritional, microbiological quality and consumer acceptance of fruit drinks as street foods in Bogor. Food and Nutrition Sciences. 2010;1(2):55-61.
- BSN Indonesia. Standar Nasional Indonesia 7388:2009: maximum limits of microbial contamination in food. Jakarta: Badan Standardisasi Nasional; 2009.
- Harrigan WF. Laboratory methods in food microbiology. 3rd ed. San Diego: Academic Press; 1998.
- AOAC International. Official methods of analysis. 21st ed. Rockville: AOAC International; 2019.
- FAO. Selling street and snack foods. FAO Diversification Booklet 18. Rome: Food and Agriculture Organization; 2011.
- Davey MW, Van Montagu M, Inze D, Sanmartin M, Kanellis A, Smirnoff N, Benzie IJJ, Strain JJ, Favell D, Fletcher J. Plant L-ascorbic acid: chemistry, function, metabolism, bioavailability and effects of processing. Journal of the Science of Food and Agriculture. 2000;80(7):825-860.
- Trafialek J, Drosinos EH, Kolanowski W. Evaluation of street food vendors' hygienic practices using fast observation questionnaire. Food Control. 2017;80:350359.
- Bryan FL, Michanie SC, Alvarez P, Paniagua A. Critical control points of street-vended foods in the Dominican Republic. Journal of Food Protection. 1988;51(5):373-383.
- Muinde OK, Kuria E. Hygienic and sanitary practices of vendors of street foods in Nairobi, Kenya. African Journal of Food Agriculture Nutrition and Development. 2005;5(1):1-14.
- Ghosh M, Wahi S, Kumar M, Ganguli A. Prevalence of enterotoxigenic Staphylococcus aureus and Shigella spp. in some raw street vended Indian foods. International Journal of Environmental Health Research. 2007;17(2):151-156.
- Ryu JH, Beuchat LR. Biofilm formation and sporulation by Bacillus cereus on a stainless steel surface and subsequent resistance of vegetative cells and spores to chlorine, chlorine dioxide, and a peroxyacetic acid-based sanitizer. Journal of Food Protection. 2005;68(12):2614-2622.