
Research article · 2025 · Full text
International Journal of Advanced Chemistry ResearchLC-MS/MS method development for quantification of mycotoxins in cereal grains
Volume 7(9) · Pages 187–191 · DOI: 10.33545/26646781.2025.v7.i9c.635 ↗
Research areasMycotoxins in Agriculture and FoodPesticide Residue Analysis and SafetyAnalytical chemistry methods development
Abstract
Author-writtenMycotoxins secondary metabolites of toxigenic moulds pose a persistent food safety threat in cereal supply chains across Africa and the Middle East, where climate conditions favour Aspergillus, Fusarium, and Penicillium contamination during crop growth, harvest, and storage. Egypt's strategic position as a major importer and processor of wheat and maize for its population of over 100 million creates a direct exposure pathway: contaminated grain imports arriving at Alexandria and Port Said are processed into flour, bread, and animal feed that enter a food chain with limited mycotoxin monitoring capacity at the domestic processing level. The present research developed and validated an LC-MS/MS multi-mycotoxin method for the simultaneous quantification of eight mycotoxins aflatoxins B1, B2, G1, G2 (AFB1, AFB2, AFG1, AFG2), Ochratoxin A (OTA), Zearalenone (ZEA), deoxynivalenol (DON), and fumonisin B1 (FB1) in wheat, maize, rice, barley, and sorghum. Sample preparation used a dilute-and-shoot approach optimised for matrix effect minimisation across the diverse cereal matrices. Chromatographic separation was achieved on a C18 reverse-phase column with gradient elution (methanol/0.1% formic acid in water); detection was by electrospray ionisation triple quadrupole MS in positive/negative switching MRM mode. Method validation followed Commission Regulation (EU) 2021/808 and CEN/TR 16059 criteria. LOQs ranged from 0.1 µg/kg (AFB1) to 2.5 µg/kg (DON), with all values at or below EU Maximum Limits (MLs). Recoveries across three spiked levels ranged from 72.4 to 112.3% with RSD ≤ 11.4%. A survey of 270 cereal samples from Egyptian markets identified mycotoxins in 41.5% of samples; 8.5% exceeded EU MLs. DON showed the highest frequency in wheat (41.0%) and maize (32.0%); AFB1 exceedance of EU ML (2 µg/kg) was found in 6.7% of maize samples, with maximum 18.4 µg/kg. These results provide the first comprehensive multi-mycotoxin occurrence dataset for Egyptian market cereals using fully validated LC-MS/MS methodology.
Summary
Source-checkedPlain-language reading of the full paper, prepared with AI and checked against the text. Each point links to the authors' own words.
Why it matters
- Mycotoxins produced by toxigenic moulds are a constant food safety risk in Africa and the Middle East because the climate encourages contamination by Aspergillus, Fusarium, and Penicillium. View evidence ↗
- Egypt's high volume of wheat and maize imports for its population of over 100 million creates a risk of exposure due to limited mycotoxin monitoring during domestic processing. View evidence ↗
- Certain mycotoxins pose severe health risks: Aflatoxin B1 is a Group 1 carcinogen targeting the liver, and fumonisin B1 is linked to oesophageal cancer, which is particularly prevalent in Egypt's Upper Nile governorates. View evidence ↗
The question
- The study aimed to develop and validate an LC-MS/MS method to simultaneously quantify eight specific mycotoxins across five types of cereal grains. View evidence ↗
What they did
- The researchers collected 270 cereal samples (60 each of wheat, maize, rice, and barley, and 30 of sorghum) from various markets and facilities across four Egyptian governorates in October 2024. View evidence ↗
- The study used an optimized 'dilute-and-shoot' sample preparation method using an acetonitrile/water/formic acid extraction solvent and stable isotope-labelled internal standards (SIL-IS). View evidence ↗
- Analysis was performed using a Waters Acquity UPLC I-Class coupled to a Xevo TQ-S Micro triple quadrupole mass spectrometer with a BEH C18 column. View evidence ↗
What they found
- The method's limits of quantification (LOQs) ranged from 0.1 µg/kg for AFB1 to 2.5 µg/kg for DON, all of which were at or below European Union Maximum Limits. View evidence ↗
- Method validation showed recoveries between 72.4% and 112.3% across three spiked levels, with a relative standard deviation (RSD) of 11.4% or less. View evidence ↗
- Out of 270 Egyptian market cereal samples, 41.5% contained detectable mycotoxins, and 8.5% exceeded the EU Maximum Limits. View evidence ↗
- Maize had the highest contamination rate at 61.7%, with Aflatoxin B1 reaching a maximum of 18.4 µg/kg, which is roughly nine times the EU limit of 2 µg/kg. View evidence ↗
- Barley exhibited the highest maximum level of deoxynivalenol (DON) at 4136 µg/kg, with only one sample exceeding the EU limit of 1750 µg/kg. View evidence ↗
- Ochratoxin A (OTA) exceeded the EU limit of 3 µg/kg in three samples (two barley, one wheat), all of which came from storage facilities in Upper Egypt with humidity control issues. View evidence ↗
What it means
- The authors conclude there is an urgent need for national Aflatoxin B1 monitoring programs in Egypt to allow for the rejection or diversion of shipments that exceed maximum limits. View evidence ↗
- The study provides the first validated LC-MS/MS dataset for Egyptian cereals, identifying AFB1 in maize and DON in barley as the top priorities for regulatory monitoring. View evidence ↗
- A limitation of the 'dilute-and-shoot' approach is the risk of matrix component accumulation on the column, which the authors managed by performing a column wash every 10 samples. View evidence ↗
Visual summary
2 visualsIllustrations explain the paper; charts are replotted from the paper's own table values.
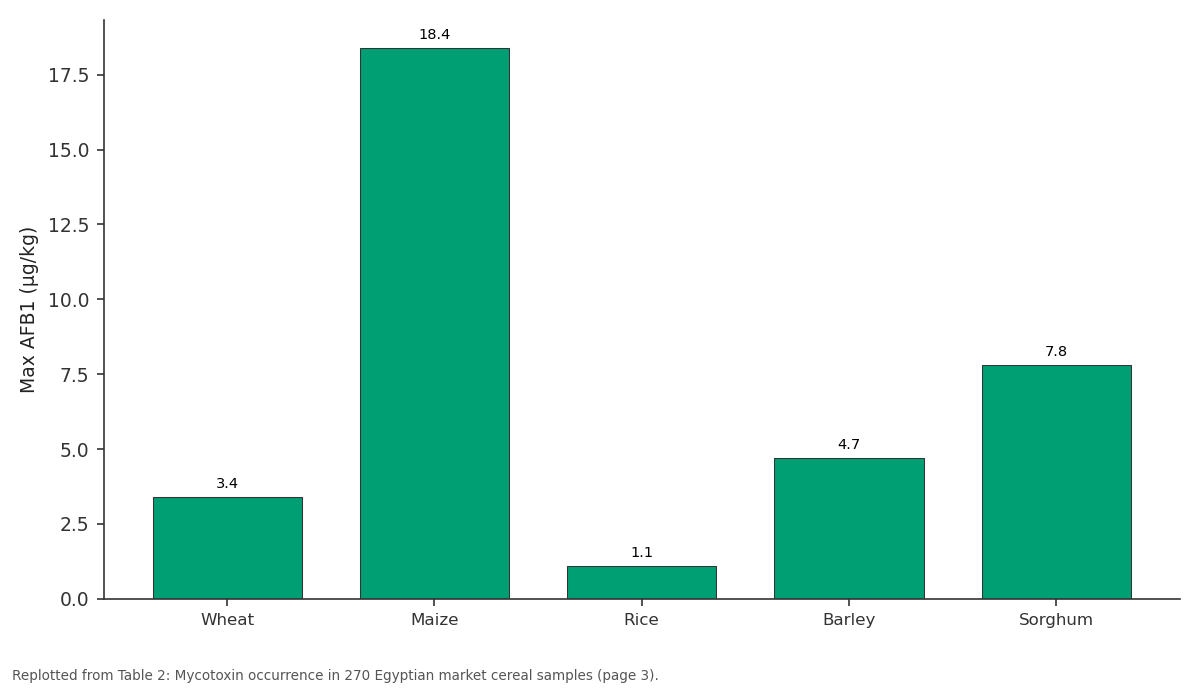
Max AFB1 (µg/kg): Wheat vs Maize vs Rice vs Barley vs Sorghum
Replotted from Table 2 (page 3) of the original paper. Every bar is the paper's own table value.
View source evidence ↗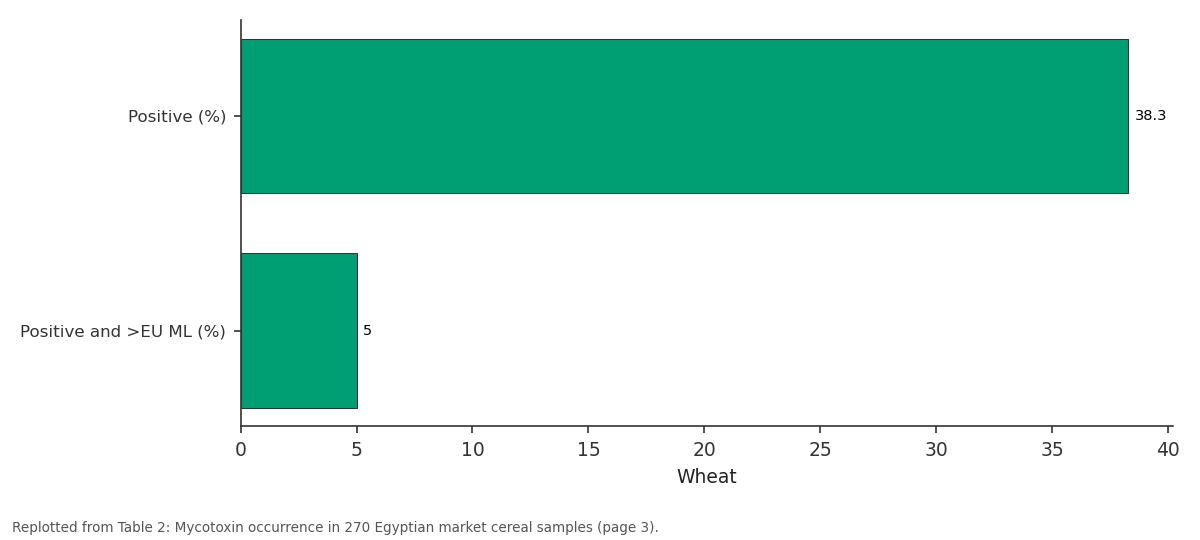
Wheat: Positive (%) vs Positive and >EU ML (%)
Replotted from Table 2 (page 3) of the original paper. Every bar is the paper's own table value.
View source evidence ↗Figures & tables
From the original paper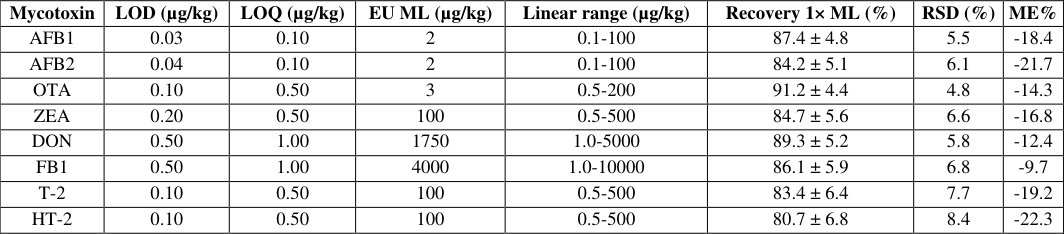 Table 1
 Table 2
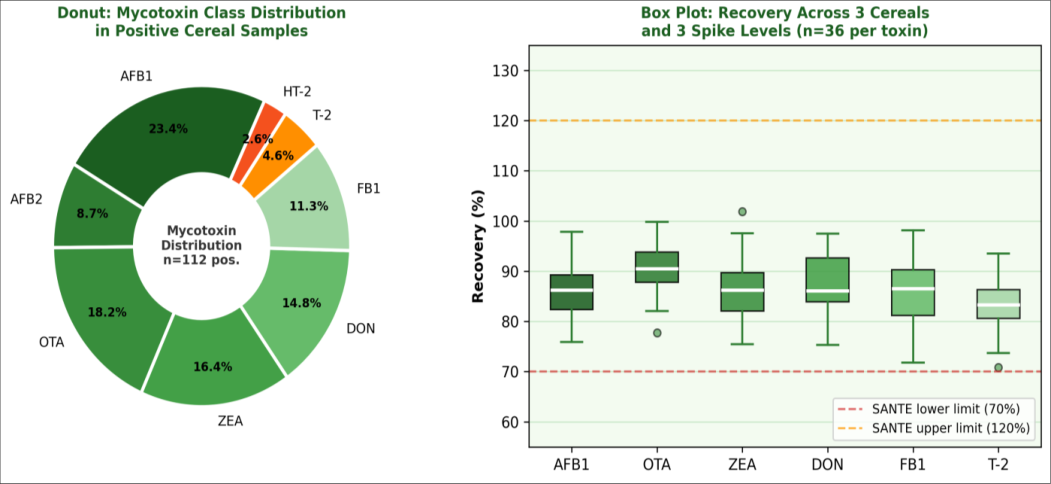 Figure 1
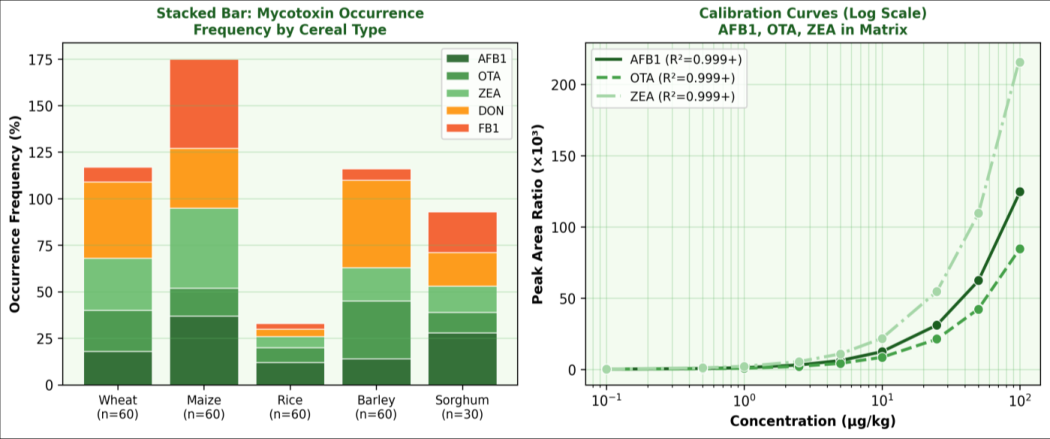 Figure 2
Introduction
The Food and Agriculture Organization of the United Nations estimates that 25% of the world's food supply is contaminated with mycotoxins, representing an annual economic loss of approximately USD 1 billion and a significant chronic disease burden in populations with high cereal-based dietary exposure [1] . In Egypt, where wheat bread (aish baladi) provides approximately 35% of daily caloric intake and maize is a staple for Lower Egypt rural populations, chronic low-level mycotoxin exposure is of particular concern. Aflatoxin B1 is classified by IARC as a Group 1 carcinogen with the liver as the primary target organ; fumonisin B1 promotes oesophageal cancer, the incidence of which in Egypt's Upper Nile governorates significantly exceeds the national average [2] . Multi-mycotoxin LC-MS/MS methods have become the gold standard for regulatory monitoring because they combine the selectivity of MRM transitions with the efficiency of simultaneous quantification of chemically diverse compounds that would require separate methods under classical immunochemical approaches [3] . The 'dilute-and-shoot' (D&S) sample preparation approach direct dilution of cereal extracts in acetonitrile/water without solid-phase cleanup offers significant advantages in throughput and cost over Immunoaffinity Column (IAC) or dispersive SPE (dSPE) procedures, at the cost of higher matrix effects that must be managed by matrix-matched calibration and stable isotopelabelled internal standards [4] . Despite Egypt's status as one of the largest cereal importers in the world (approximately 12 million tonnes of wheat annually), no peer-reviewed multi-mycotoxin occurrence dataset for Egyptian market cereals using validated LC-MS/MS methodology has been published in the international literature as of April 2025. Overall, 41.5% of cereal samples contained at least one detectable mycotoxin. Maize showed the highest contamination rate (61.7%) and the highest AFB1 maximum (18.4 µg/kg, approximately 9× the EU ML of 2 µg/kg). This AFB1 level in maize is consistent with findings from imported maize arriving from West African suppliers during a period of elevated Aspergillus activity correlated with pre-harvest drought conditions [5] . Barley showed the highest DON maximum (4136 µg/kg), remaining below the EU ML of 1750 µg/kg for unprocessed cereals for human consumption in all but one sample (4136 µg/kg). OTA exceeded EU ML (3 µg/kg for cereals) in two barley samples and one wheat sample all from Upper Egypt storage facilities with documented humidity control problems.
Discussion
The 13-minute total LC run time with simultaneous positive/negative switching represents a significant throughput improvement over earlier Egyptian multimycotoxin methods that required separate positive and negative injections [6] . The dilute-and-shoot approach achieved matrix effects of -9.7% to -22.3%, all within acceptable bounds when corrected by SIL-IS, and the simplified sample preparation (no SPE step) is well-suited to the high sample volumes required for a national survey. The main operational risk of D&S is accumulation of coextracted matrix components on the LC column over time, leading to retention time shifts and increased matrix effects in later injections; this was managed by injecting a column wash solution (90% methanol) every 10 samples [7] . The AFB1 levels found in maize samples (maximum 18.4 µg/kg) are concerning from a public health perspective, as chronic dietary intake of AFB1 at these concentrations contributes meaningfully to lifetime Hepatocellular Carcinoma (HCC) risk, particularly in hepatitis B surface antigen-positive individuals who have approximately 30fold synergistic risk elevation [8] . Egypt's HBsAg seroprevalence of approximately 8% in some governorates means that a significant fraction of the population is at elevated combined AFB1+HBV risk from dietary exposure to contaminated maize. These findings support the urgent need for national AFB1 monitoring programs with rapid action protocols for shipment rejection or diversion to nonfood uses when ML exceedances are detected. The high DON frequency in barley (47.0% positive rate) is consistent with its origin primarily from Fusarium head blight, which is endemic in Nile Delta barley cultivation areas during years with wet heading periods. DON at the concentrations found (< 4136 µg/kg) primarily affects animal health rather than human health at typical barley intake levels, since barley is consumed mainly as animal feed and barley bread in Egypt [9] . However, the brewing industry, which uses significant barley volumes, should note that DON is not fully removed by malting and fermentation, and could accumulate in beer to levels of regulatory concern if contaminated raw materials are processed [10] .
Conclusion
Conclusion
Figures and tables from the paper
| Mycotoxin | LOD (µg/kg) | LOQ (µg/kg) | EU ML (µg/kg) | Linear range (µg/kg) | Recovery 1× ML (%) | RSD (%) | ME% |
|---|---|---|---|---|---|---|---|
| AFB1 | 0.03 | 0.10 | 2 | 0.1-100 | 87.4 ± 4.8 | 5.5 | -18.4 |
| AFB2 | 0.04 | 0.10 | 2 | 0.1-100 | 84.2 ± 5.1 | 6.1 | -21.7 |
| OTA | 0.10 | 0.50 | 3 | 0.5-200 | 91.2 ± 4.4 | 4.8 | -14.3 |
| ZEA | 0.20 | 0.50 | 100 | 0.5-500 | 84.7 ± 5.6 | 6.6 | -16.8 |
| DON | 0.50 | 1.00 | 1750 | 1.0-5000 | 89.3 ± 5.2 | 5.8 | -12.4 |
| FB1 | 0.50 | 1.00 | 4000 | 1.0-10000 | 86.1 ± 5.9 | 6.8 | -9.7 |
| T-2 | 0.10 | 0.50 | 100 | 0.5-500 | 83.4 ± 6.4 | 7.7 | -19.2 |
| HT-2 | 0.10 | 0.50 | 100 | 0.5-500 | 80.7 ± 6.8 | 8.4 | -22.3 |
Table text extracted from the original PDF; superscript letters are shown inline. The original table image is below.
View original table image
| Cereal | n | Positive (%) | Positive and >EU ML (%) | Max AFB1 (µg/kg) | Max DON (µg/kg) | Max OTA (µg/kg) |
|---|---|---|---|---|---|---|
| Wheat | 60 | 38.3 | 5.0 | 3.4 | 2847 | 6.2 |
| Maize | 60 | 61.7 | 16.7 | 18.4 | 1428 | 4.8 |
| Rice | 60 | 18.3 | 1.7 | 1.1 | 124 | 1.6 |
| Barley | 60 | 45.0 | 8.3 | 4.7 | 4136 | 8.4 |
| Sorghum | 30 | 46.7 | 10.0 | 7.8 | 986 | 3.7 |
| All cereals | 270 | 41.5 | 8.5 | 18.4 (maize) | 4136 (barley) | 8.4 (barley) |
Table text extracted from the original PDF; superscript letters are shown inline. The original table image is below.
View original table image
References
21 in the original paper- FAO. Worldwide Regulations for Mycotoxins in Food and Feed in 2003. FAO Food and Nutrition Paper 81. Rome: Food and Agriculture Organization; 2004.
- IARC. Aflatoxins. IARC Monographs Vol. 100F. Lyon: International Agency for Research on Cancer; 2012.
- Malachová A, Sulyok M, Beltran E, Berthiller F, Krska R. Optimization and validation of a quantitative liquid chromatography-tandem mass spectrometric method covering 295 bacterial and fungal metabolites including all regulated mycotoxins in four model food matrices. J Chromatogr A. 2014;1362:145-156.
- Spanjer MC, Rensen PM, Scholten JM. LC-MS/MS multi-method for mycotoxins after single extraction, with validation data for peanut, pistachio, wheat, maize, cornflakes, raisins and figs. Food Addit Contam Part A. 2008;25(4):472-489.
- Akinola SA, Nleya N, Naicker KS, Phoku JZ, Njobeh PB. Mycotoxin contamination of cereal grains in Southern Africa. Curr Opin Food Sci. 2022;47:100909.
- Soleimany F, Jinap S, Faridah A, Khatib A. A UPLC MS/MS for simultaneous determination of aflatoxins, trichothecenes, fumonisins, zearalenone, ochratoxin A, and patulin in cereals. Food Chem. 2012;130(4):10421049.
- Tittlemier SA, Roscoe M, Trelka R, Gaba D, Chan JM, Patrick SK, et al. Fusarium damage in small cereal grains from western Canada. J Agric Food Chem. 2013;61(23):5428-5438.
- Groopman JD, Kensler TW, Wild CP. Protective interventions to prevent aflatoxin-induced carcinogenesis in developing countries. Annu Rev Public Health. 2008;29(1):187-203.
- Pestka JJ. Deoxynivalenol: mechanisms of action, human exposure, and toxicological relevance. Arch Toxicol. 2010;84(9):663-679.
- Schwarz PB, Casper HH, Beattie S. Fate and development of naturally occurring Fusarium mycotoxins during malting and brewing. J Am Soc Brew Chem. 1995;53(3):121-127.
- Creppy EE. Update of research in mycotoxins in food. Toxicol Lett. 2002;127(1-3):19-28.
- Shephard GS. Determination of mycotoxins in human foods. Chem Soc Rev. 2008;37(11):2468-2477.
- Voss KA, Smith GW, Haschek WM. Fumonisins: toxicokinetics, mechanism of action and toxicity. Anim Feed Sci Technol. 2007;137(3-4):299-325.
- EFSA Panel on Contaminants. Scientific opinion on the risks for human and animal health related to the presence of modified forms of certain mycotoxins in food and feed. EFSA J. 2014;12(12):3916.
- Wild CP, Turner PC. The toxicology of aflatoxins as a basis for public health decisions. Mutagenesis. 2002;17(6):471-481.
- Bhat R, Rai RV, Karim AA. Mycotoxins in food and feed: present status and future concerns. Compr Rev Food Sci Food Saf. 2010;9(1):57-81.
- Zinedine A, Soriano JM, Moltó JC, Mañes J. Review on the toxicity, occurrence, metabolism, detoxification, regulations and intake of zearalenone. Food Chem Toxicol. 2007;45(1):1-18.
- European Commission. Commission Regulation (EC) No 1881/2006 setting maximum levels for certain contaminants in foodstuffs. Off J Eur Union. 2006;L364:5-24.
- Alshannaq A, Yu JH. Occurrence, toxicity, and analysis of major mycotoxins in food. Int J Environ Res Public Health. 2017;14(6):632.
- Turner NW, Subrahmanyam S, Piletsky SA. Analytical methods for determination of mycotoxins: a review. Anal Chim Acta. 2009;632(2):168-180.
- Streit E, Schatzmayr G, Tassis P, Tzika E, Marin D, Taranu I, et al. Current situation of mycotoxin contamination and co-occurrence in animal feed focus on Europe. Toxins. 2012;4(10):788-809.