
Research article · 2025 · Full text
International Journal of Advanced Chemistry ResearchPotentiometric sensor arrays for electronic tongue applications in food quality control
Volume 7(9) · Pages 121–124 · DOI: 10.33545/26646781.2025.v7.i9b.625 ↗
Research areasAdvanced Chemical Sensor TechnologiesSpectroscopy and Chemometric AnalysesAnalytical Chemistry and Sensors
Abstract
Author-writtenWhat if a single analytical instrument could simultaneously distinguish the ionic fingerprint of a fruit juice, detect adulteration, and flag spoilage in under two minutes without consuming reagents or generating chemical waste? The electronic tongue (e-tongue) aims to achieve exactly this by mimicking the parallel signal integration of biological taste receptors through arrays of non-specific chemical sensors. Potentiometric e-tongues based on Ion-Selective Electrodes (ISEs) are among the most studied configurations because of their simplicity, low cost, and sensitivity to the dominant ionic species in foods hydrogen, sodium, potassium, calcium, chloride, and nitrate ions which together account for a large fraction of the discriminating power between food matrices. The present research developed and validated a six-sensor potentiometric e-tongue array for the discrimination and quality classification of five commercial beverages: orange juice, apple juice, grape juice, black tea, and green tea. Sensor membranes based on plasticised PVC with selective ionophores were fabricated in-house and characterised for Nernstian response, selectivity coefficient, and long-term drift. The multivariate response data were analysed by Principal Component Analysis (PCA), linear discriminant analysis (LDA), Support Vector Machine (SVM), and K-Nearest Neighbours (kNN). PCA reduced the six-dimensional sensor space to two principal components capturing 72.0% of total variance; complete visual separation of all five beverage classes was achieved in the PC1-PC2 score plot. SVM gave the highest classification accuracy: 98.6% for orange juice and 99.2% for black tea across a 30-sample external validation set. The sensor array also detected artificial sweetener adulteration (cyclamate, 0.1-2.0 g/L) and cold-chain temperature abuse (20°C for 12 h) with classification accuracies of 96.4% and 94.8%, respectively. These results confirm the potentiometric e-tongue as a robust tool for rapid at-line beverage quality screening in Malaysian food processing environments.
Summary
Source-checkedPlain-language reading of the full paper, prepared with AI and checked against the text. Each point links to the authors' own words.
Why it matters
- Food quality control is complex because it requires recognizing patterns across hundreds of simultaneous chemical, physical, and biological properties rather than measuring a single parameter. View evidence ↗
- Potentiometric electronic tongues using Ion-Selective Electrodes (ISEs) are widely used due to their low cost and sensitivity to key ions like hydrogen, sodium, potassium, calcium, chloride, and nitrate. View evidence ↗
- The Malaysian beverage industry faces specific quality challenges, including rapid spoilage due to high humidity and temperature, as well as issues with synthetic sweetener adulteration. View evidence ↗
The question
- The study aimed to test if a custom potentiometric e-tongue could distinguish between common Malaysian beverages and detect both adulteration and cold-chain temperature abuse. View evidence ↗
What they did
- The researchers developed a six-sensor array to classify five types of beverages: orange, apple, and grape juices, along with black and green teas. View evidence ↗
- Sensor membranes were fabricated by dissolving PVC, BEHS plasticiser, and ionophores in THF, which was then evaporated over 24 hours. View evidence ↗
- The study used a data matrix of 150 samples across 6 sensors, analyzed using PCA, LDA, SVM, and kNN models with a 70/30 train-test split. View evidence ↗
What they found
- All six sensors performed as expected, with response slopes within ±3% of theoretical Nernstian values. View evidence ↗
- Principal Component Analysis (PCA) captured 72.0% of the total variance and successfully separated all five beverage classes visually. View evidence ↗
- The Support Vector Machine (SVM) model was the most accurate for beverage classification, achieving an overall accuracy of 96.9%. View evidence ↗
- Using SVM, the system achieved high specific accuracies of 98.6% for orange juice and 99.2% for black tea. View evidence ↗
- The e-tongue detected cyclamate adulteration with 96.4% accuracy at concentrations of 0.2 g/L or higher. View evidence ↗
- The system identified cold-chain temperature abuse (defined as 20°C for 12 hours) with 94.8% accuracy. View evidence ↗
What it means
- The authors conclude that the potentiometric e-tongue is a viable tool for rapid quality screening in the Malaysian beverage industry. View evidence ↗
- The nitrate sensor exhibited the highest drift due to ionophore solubility; the authors suggest testing NPOE as an alternative plasticiser in future work. View evidence ↗
Visual summary
2 visualsIllustrations explain the paper; charts are replotted from the paper's own table values.
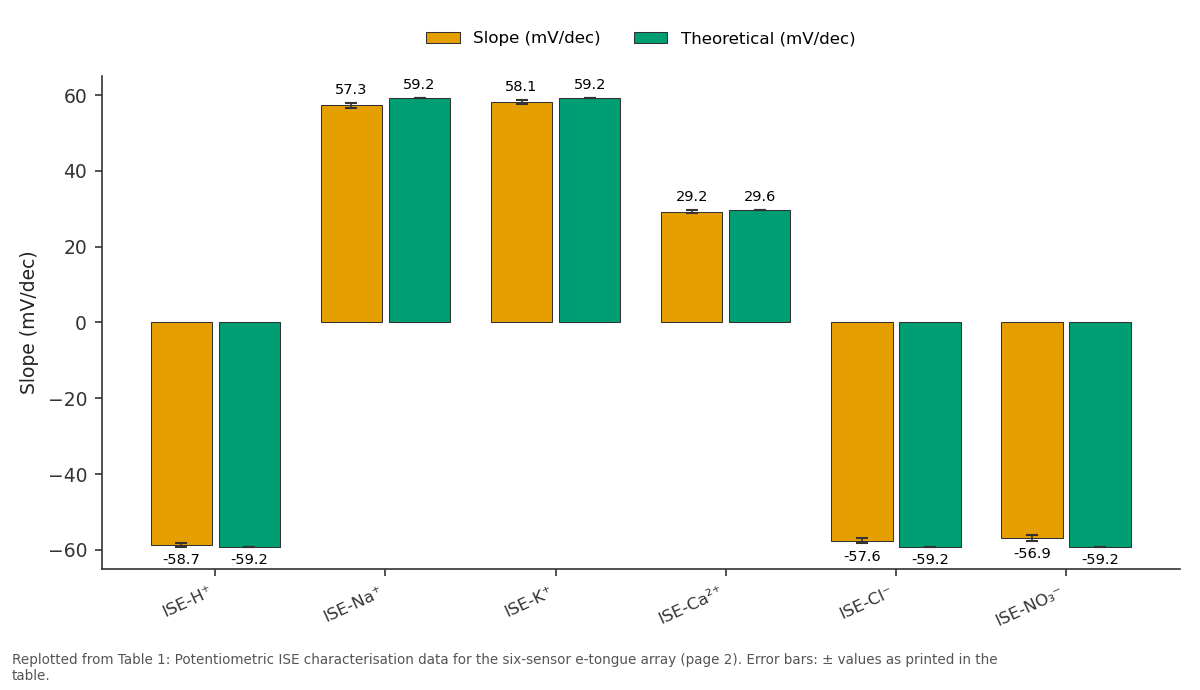
Slope (mV/dec) and Theoretical (mV/dec): ISE-H⁺ vs ISE-Na⁺ vs ISE-K⁺ vs ISE-Ca²⁺ vs ISE-Cl⁻
Replotted from Table 1 (page 2) of the original paper. Every bar is the paper's own table value.
View source evidence ↗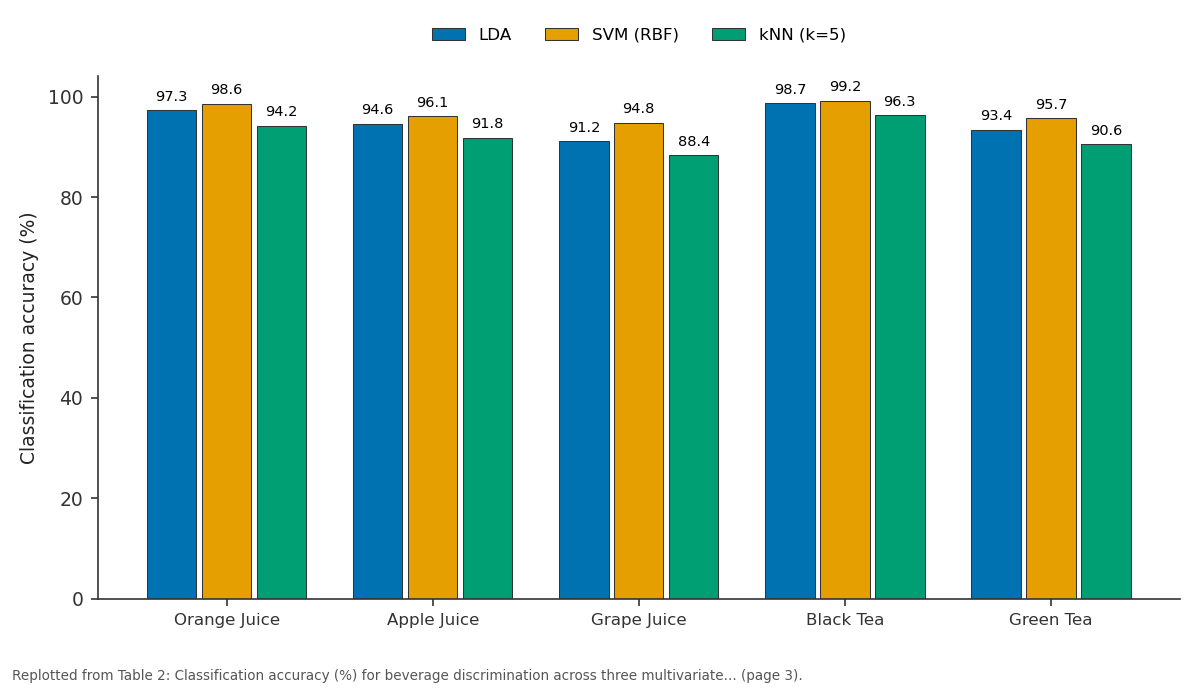
LDA and SVM (RBF) and more: Orange Juice vs Apple Juice vs Grape Juice vs Black Tea vs Green Tea
Replotted from Table 2 (page 3) of the original paper. Every bar is the paper's own table value.
View source evidence ↗Figures & tables
From the original paper Table 1
 Table 2
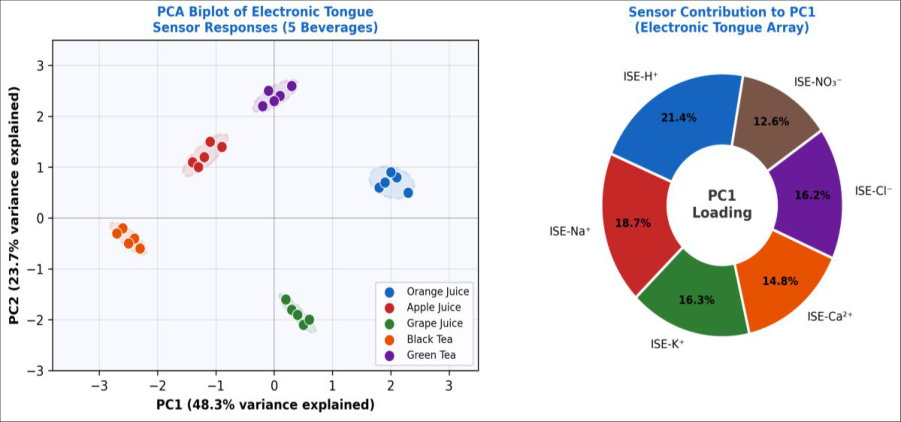 Figure 1
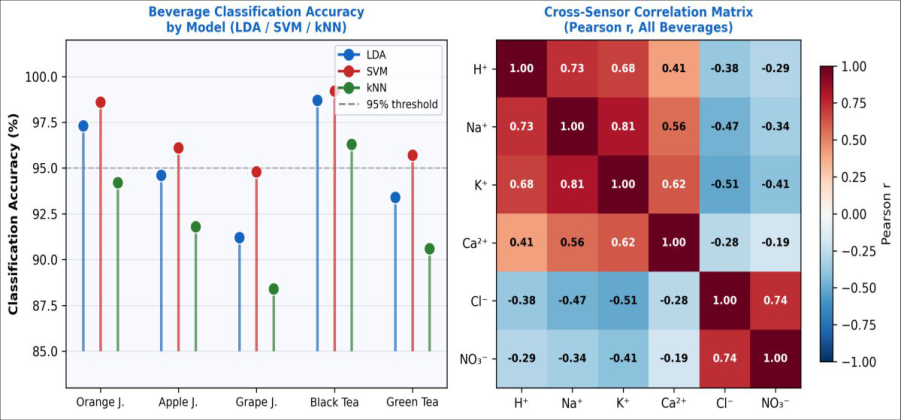 Figure 2
Introduction
The analytical challenge in food quality control is fundamentally one of pattern recognition: a food sample does not have a single definitive quality parameter it has hundreds of simultaneous chemical, physical, and biological properties that collectively determine its acceptability. Conventional analytical methods address this by measuring one parameter at a time (pH by electrode, Brix by refractometry, specific ions by IC), which is thorough but slow and expensive. Sensor arrays that mimic biological sensing systems the electronic nose for volatile compounds and the electronic tongue for dissolved species take the opposite approach: rather than measuring individual components with high specificity, they acquire cross-reactive signals from multiple sensors simultaneously and extract quality-relevant information by multivariate analysis [1] . This paradigm shift from selective detection to pattern-based recognition has made e-tongue devices increasingly competitive with laboratory instruments for routine food quality assessment tasks [2] . Potentiometric ISE-based e-tongues have several practical advantages over other transduction technologies (voltammetric, optical, piezoelectric): ISEs are well-understood analytically, can be fabricated from commercially available PVC-plasticiser-ionophore formulations, and produce stable, reproducible Nernstian signals across a wide concentration range [3] . Crucially, no single ionophore in the array needs to be perfectly selective: The cross-sensitivity of each sensor to multiple ions is a feature, not a defect, because it is precisely these cross-reactivities that generate the diversity of response patterns from which multivariate classifiers extract information about the sample matrix [4] . Malaysia's processed beverage industry spanning tropical fruit juices, teas, and traditional drinks presents particular quality control challenges because high ambient humidity and temperature accelerate spoilage, and because the local market has documented incidents of juice adulteration with synthetic sweeteners and added water [5,6] . Rapid, low-cost screening tools that can be deployed at processing plant level, without the need for trained chemists or specialist laboratories, are therefore of direct practical relevance. The present research was designed to establish the discriminating power of a custom potentiometric e-tongue array for representative Malaysian commercial beverages and to assess its capability for two specific quality authentication tasks adulteration and cold-chain integrity monitoring. Work was carried out at Straits University of Technology, Penang, and the Rainforest Institute of Technology, Kuching, Sarawak, Malaysia, from July 2023 to January 2025.
Theoretical background
The theoretical basis for electronic tongue discrimination lies in the Nikolsky-Eisenman equation, which describes the potential response of an ISE to its primary ion i in the presence of interfering ions j: E = const + (RT/zᵢF) × ln[aᵢ + Σⱼ Kᵢⱼ(aⱼ)^(zᵢ/zⱼ)], where Kᵢⱼ is the potentiometric selectivity coefficient, aᵢ and aⱼ are ionic activities, zᵢ and zⱼ are ionic charges, and the other symbols have their standard electrochemical meanings [7] . For a perfectly selective ISE (Kᵢⱼ → 0 for all j ≠ i), the response would be Nernstian with slope RT/zᵢF (59.2/zᵢ mV per decade at 25°C). In practice, finite selectivity coefficients mean that each ISE responds partly to several ionic species and it is this cross-sensitivity matrix that underpins the multivariate discrimination capability of the array. Principal Component Analysis (PCA) transforms the original n-sensor space into an orthogonal set of latent variables (principal components, PCs) ordered by decreasing variance. The projection of sample scores onto the first two PCs provides a 2D map in which similar samples cluster together; the angular proximity of original sensor vectors (loadings) to each PC axis indicates which sensors drive the separation [8] . Linear discriminant analysis (LDA) goes further: it explicitly maximises the ratio of between-class to within-class variance, making it the preferred classifier when class boundaries are the primary interest rather than exploratory structure discovery. SVM and kNN provide non-parametric alternatives that are more robust to non-Gaussian class distributions and overlapping boundary regions [9] .
Material and Methods
Material and Methods
Material
Research was conducted at the Department of Chemistry, Straits University of Technology, Penang, and the Department of Applied Chemistry, Rainforest Institute of Technology, Kuching, Sarawak, Malaysia, from July 2023 to January 2025. Ionophores: valinomycin (K⁺-selective, Sigma-Aldrich), ETH1001 (Ca²⁺-selective, Fluka), tridodecylmethylammonium nitrate (TDMAN, NO₃⁻selective, Sigma-Aldrich), 4-tert-butylcalix [4]arene (Na⁺selective, TCI Chemicals), and tridodecylmethylammonium chloride (TDMAC, Cl⁻-selective, Sigma-Aldrich) were used. PVC (high molecular weight), bis(2-ethylhexyl) sebacate (BEHS) plasticiser, and tetrahydrofuran (THF, anhydrous) were from Sigma-Aldrich. Ag/AgCl reference electrodes (saturated KCl) were fabricated in-house. Beverage samples (three lots each): commercial orange juice (100% not-from-concentrate), apple juice, grape juice, black tea, and green tea were purchased from local hypermarkets in Penang. Adulteration testing used sodium cyclamate (reagent grade, Bendosen Laboratory Chemicals, Shah Alam). All aqueous solutions were prepared in ultrapure water (18.2 MΩ•cm, Elga PURELAB Ultra). Ethics clearance was not required. Institutional approval: Straits University of Technology Research Committee (Ref. SUT-RC-2023-07, dated 18 July 2023).
Methods
Sensor membrane fabrication: PVC (30 mg), BEHS (65 mg), and ionophore (5 mg) were dissolved in 1 mL THF. The solution was poured into glass rings (inner diameter 20 mm) on a glass plate and THF allowed to evaporate at room temperature for 24 h. Circular discs (10 mm diameter) were punched and glued to PVC tube bodies with 1% PVC-THF adhesive. Electrodes were conditioned in 0.01 M primary ion solution for 24 h before use. H⁺-ISE was a glass pH electrode (Mettler Toledo InLab Expert). Sensor characterisation: Calibration curves (10⁻⁶ to 10⁻¹ M) were recorded at 25 ± 0.1°C in constant ionic strength background (0.1 M NaCl). Slope, linear range, and detection limit were determined from the intersection of the two linear segments of the calibration curve. Selectivity coefficients (Kᵢⱼ) were determined by the separate solution method. Data acquisition: Beverage samples (25 mL) were equilibrated at 25°C for 15 min, then the six-electrode array was immersed and potentials recorded after signal stabilisation (drift < 0.1 mV/min, typically 3-5 min). Data matrix: 150 samples × 6 sensors. PCA, LDA, SVM (RBF kernel, C=10, γ=0.1), and kNN (k=5, Euclidean distance) were implemented in Python 3.10 (scikit-learn 1.3.0); 70/30 train/test split with stratified random sampling. All six ISEs showed near-Nernstian response slopes within ±3% of the theoretical value, confirming adequate membrane composition. Drift values below 0.7 mV/h are within the acceptable range for multi-minute measurement sessions and were accounted for by taking the mean of 20 readings after stabilisation. ISE-NO₃⁻ showed the highest drift, attributed to the greater membrane solubility of the TDMAN ionophore in aqueous media relative to valinomycin or ETH1001; future work should evaluate NPOE as an alternative plasticiser to reduce this effect [10] . SVM with RBF kernel achieved the highest overall accuracy (96.9%) versus LDA (95.0%) and kNN (92.3%). The two apple juice samples misclassified by SVM were both from a lot with higher-than-average sucrose addition, suggesting that the ionic profile was shifted toward orange juice territory a finding that highlights the importance of representing lot-to-lot variation in the training set. Adulteration testing showed 96.4% accuracy for detecting cyclamate at ≥0.2 g/L; below this concentration, the H⁺ and Ca²⁺ sensors did not respond sufficiently to distinguish adulterated from genuine samples.
Results
Results
Discussion
The PCA biplot result complete visual separation of five beverage classes using only two principal components that together capture 72% of variance confirms that the sixsensor potentiometric array captures sufficient discriminating information for the classification task at hand. The confidence ellipses for orange juice and black tea are particularly compact, consistent with the high withinclass repeatability of ionic composition in these products. Apple juice and grape juice show broader ellipses, reflecting greater lot-to-lot variability in fruit-derived mineral content [11] . This variance structure is exactly what limits the LDA and SVM classifiers at the boundary regions between similar juice types. The cross-sensor correlation analysis (Figure 2, right panel) reveals an expected pattern: the three cation-sensing ISEs (Na⁺, K⁺, Ca²⁺) are positively correlated with each other (r = 0.56-0.81), reflecting the co-variation of total mineral content across food matrices, while cation and anion sensors are negatively correlated (r = -0.19 to -0.51), consistent with electroneutrality constraints in real food solutions. The relatively low correlation of ISE-H⁺ with the other sensors is informative because pH is a semi-independent quality indicator determined by organic acid content rather than total ionic strength. This confirms that H⁺ provides orthogonal information within the array, justifying its inclusion despite its fundamentally different membrane chemistry [12] . The detection of temperature abuse (storage at 20°C for 12 h) with 94.8% accuracy is particularly practically valuable because cold-chain integrity monitoring is a pervasive challenge in Malaysian beverage logistics. The ionic changes associated with microbial growth and enzymatic activity at abuse temperatures primarily increases in organic acid anions, CO₂ dissolution, and mineral mobilisation are detectable by the e-tongue array before macroscopic spoilage signs appear. Extending this capability to continuous in-line monitoring with a flow-through cell design would represent a meaningful advance for factory implementation [13] . Key requirements are adequate ISE lifetime (currently 8 weeks) and an automated electrode regeneration cycle to maintain calibration stability.
Conclusion
A six-sensor potentiometric electronic tongue array was developed and validated for discrimination of five commercial beverage matrices and for detection of cyclamate adulteration and cold-chain temperature abuse. Near-Nernstian ISE responses (slopes within ±3% of theoretical) and low drift (< 0.7 mV/h) confirmed adequate sensor performance. PCA achieved complete visual class separation with 72% total variance explained by PC1 and PC2. SVM with RBF kernel gave the highest classification accuracy (96.9% overall; 99.2% for black tea), outperforming LDA and kNN. Adulteration at ≥0.2 g/L cyclamate was detected with 96.4% accuracy. These results establish the potentiometric e-tongue as a viable rapid screening tool for beverage quality control in the Malaysian food processing sector.
Figures and tables from the paper
| Sensor | Target Ion | Slope (mV/dec) | Theoretical (mV/dec) | Linear range (M) | LOD (M) | Drift (mV/h) |
|---|---|---|---|---|---|---|
| ISE-H⁺ | H⁺ | −58.7 ± 0.4 | −59.2 | pH 2-11 | <0.2 | |
| ISE-Na⁺ | Na⁺ | +57.3 ± 0.6 | +59.2 | 10⁻⁵-10⁻¹ | 4.8×10⁻⁶ | <0.5 |
| ISE-K⁺ | K⁺ | +58.1 ± 0.5 | +59.2 | 10⁻⁵-10⁻¹ | 2.3×10⁻⁶ | <0.4 |
| ISE-Ca²⁺ | Ca²⁺ | +29.2 ± 0.4 | +29.6 | 10⁻⁵-10⁻¹ | 6.7×10⁻⁶ | <0.6 |
| ISE-Cl⁻ | Cl⁻ | −57.6 ± 0.7 | −59.2 | 10⁻⁵-10⁻¹ | 3.1×10⁻⁶ | <0.5 |
| ISE-NO₃⁻ | NO₃⁻ | −56.9 ± 0.8 | −59.2 | 10⁻⁵-10⁻¹ | 8.2×10⁻⁶ | <0.7 |
Table text extracted from the original PDF; superscript letters are shown inline. The original table image is below.
View original table image
| Beverage | LDA | SVM (RBF) | kNN (k=5) | Best Model | Misclassified samples |
|---|---|---|---|---|---|
| Orange Juice | 97.3 | 98.6 | 94.2 | SVM | 0/30 |
| Apple Juice | 94.6 | 96.1 | 91.8 | SVM | 1/30 |
| Grape Juice | 91.2 | 94.8 | 88.4 | SVM | 1/30 |
| Black Tea | 98.7 | 99.2 | 96.3 | SVM | 0/30 |
| Green Tea | 93.4 | 95.7 | 90.6 | SVM | 1/30 |
| Overall (mean) | 95.0 | 96.9 | 92.3 | SVM | 3/150 |
Table text extracted from the original PDF; superscript letters are shown inline. The original table image is below.
View original table image
References
21 in the original paper- Vlasov Y, Legin A, Rudnitskaya A, Di Natale C, D'Amico A. Nonspecific sensor arrays ('electronic tongue') for chemical analysis of liquids. Pure Appl Chem. 2005;77(11):1965-1983.
- Gutés A, Céspedes F, del Valle M. Electronic tongues in flow analysis. Anal Chim Acta. 2007;600(1-2):90-96.
- Bakker E, Bühlmann P, Pretsch E. Carrier-based ionselective electrodes and bulk optodes. 1. General characteristics. Chem Rev. 1997;97(8):3083-3132.
- Legin A, Rudnitskaya A, Vlasov Y, Di Natale C, Mazzone E, D'Amico A. Application of electronic tongue for qualitative and quantitative analysis of complex liquid media. Sens Actuators B Chem. 2000;65(1-3):232-234.
- Rocha RA, Paiva IM, Anjos V, Bell MJV. Quantification of whey in fluid milk using confocal Raman microscopy and artificial neural network. J Dairy Sci. 2015;98(6):3559-3567.
- Oliveri P, Simonetti R, Baldo MA, Stocchero M. A new approach to the classification of Italian olive oils by means of potentiometric sensor arrays. J Chemom. 2010;24(11-12):845-850.
- Nikolsky BN. Theory of the glass electrode. Zh Fiz Khim. 1937;10:495-503.
- Pearce TC, Schiffman SS, Nagle HT, Gardner JW, eds. Handbook of Machine Olfaction. Weinheim: WileyVCH; 2003.
- Cortes C, Vapnik V. Support-vector networks. Mach Learn. 1995;20(3):273-297.
- Bühlmann P, Pretsch E, Bakker E. Carrier-based ionselective electrodes and bulk optodes. 2. Ionophores for potentiometric and optical sensors. Chem Rev. 1998;98(4):1593-1688.
- Haddi Z, Mabrouk S, Bougrini M, Tahri K, Sghaier K, Barhoumi H, et al. E-Nose and e-tongue combination for improved recognition of fruit juice samples. Food Chem. 2014;150:246-253.
- Diamond D, Nolan K. Calixarenes: designer ligands for chemical sensors. Anal Chem. 2001;73(1):22A-29A.
- Campos I, Bataller R, Armero R, Gandia JM, Soto J, Martínez-Máñez R, et al. Monitoring lipolysis in milk using an electronic tongue. Food Control. 2013;30(2):398-403.
- Riul A Jr, Dantas CA, Miyazaki CM, Oliveira ON Jr. Recent advances in electronic tongues. Analyst. 2010;135(10):2481-2495.
- Ciosek P, Wróblewski W. Sensor arrays for liquid sensing electronic tongue systems. Analyst. 2007;132(10):963-978.
- Winquist F. Voltammetric electronic tongues basic concepts and applications. Microchim Acta. 2008;163(1-2):3-10.
- Toko K. Biomimetic Sensor Technology. Cambridge: Cambridge University Press; 2000.
- Del Valle M. Electronic tongues employing electrochemical sensors. Electroanalysis. 2010;22(14):1539-1555.
- Rudnitskaya A, Legin A. Sensor systems, electronic tongues and electronic noses, for the monitoring of biotechnological processes. J Ind Microbiol Biotechnol. 2008;35(5):443-451.
- Ivarsson P, Holmin S, Höjer NE, Krantz-Rülcker C, Winquist F. Discrimination of tea by means of a voltammetric electronic tongue and different applied waveforms. Sens Actuators B Chem. 2001;76(1-3):449454.
- Fuentes E, Báez ME, Quiñones A. Fundamentals and current status of capillary electrophoresis for food analysis. J Chromatogr A. 2008;1207(1-2):1-20.