
Research article · 2025 · Full text
International Journal of Advanced Chemistry ResearchPolyphenol composition and antioxidant capacity of tea leaves at different fermentation stages
Volume 7(11) · Pages 195–198 · DOI: 10.33545/26646781.2025.v7.i11c.605 ↗
Research areasTea Polyphenols and EffectsPhytochemicals and Antioxidant ActivitiesFood Quality and Safety Studies
Abstract
Author-writtenTea processing is a bit like composting in reverse controlled enzymatic oxidation transforms a single raw material into products as chemically distinct as green tea and pu-erh, despite starting from the same leaf. This research tracked polyphenol composition and antioxidant capacity across four fermentation stages of Camellia sinensis var. sinensis leaves: unfermented (green), semi-fermented (oolong, 4 h), fully fermented (black, 24 h), and post-fermented (pu-erh, 72 h microbial fermentation). Total phenolic content (TPC) declined from 218.4 ± 8.7 mg GAE/g in green tea to 127.3 ± 6.4 mg GAE/g in pu-erh. Catechins, the dominant polyphenol class in green tea (78.4% of total polyphenols), decreased progressively while theaflavins and thearubigins oxidative condensation products increased, peaking at 21.4% and 38.7% in black tea and 9.6% and 47.2% in pu-erh, respectively. Antioxidant capacity measured by DPPH, FRAP, and ABTS assays mirrored the TPC decline, with green tea showing the highest values. HPLC quantification of individual catechins revealed that epigallocatechin gallate (EGCG) dropped from 68.4 to 4.7 mg/g over the fermentation timeline. These data provide a quantitative map of polyphenol transformation during tea processing and confirm that antioxidant capacity is primarily driven by catechin content rather than by the oxidised polyphenol fraction.
Summary
Source-checkedPlain-language reading of the full paper, prepared with AI and checked against the text. Each point links to the authors' own words.
Why it matters
- Tea is widely consumed for health benefits, including reduced risks of certain cancers, type 2 diabetes, and cardiovascular disease, which are primarily attributed to its polyphenolic compounds. View evidence ↗
- The different types of tea (green, oolong, black, and pu-erh) are distinguished by enzymatic oxidation, which converts monomeric catechins into theaflavins and thearubigins. View evidence ↗
- Previous research often used commercial teas, which introduced confounding variables such as growing region and cultivar that could obscure the specific effects of fermentation. View evidence ↗
The question
- The study aimed to document the kinetics of polyphenol conversion and the resulting antioxidant trajectory across the full fermentation spectrum, including microbial transformation in pu-erh, under controlled conditions. View evidence ↗
What they did
- The researchers used a single batch of freshly harvested Camellia sinensis var. sinensis leaves to eliminate cultivar and regional confounders. View evidence ↗
- Four fermentation stages were established: green (steamed), oolong (4 h oxidation), black (24 h fermentation), and pu-erh (black tea process followed by 72 h microbial pile fermentation). View evidence ↗
- Total phenolic content (TPC) was measured via the Folin-Ciocalteu method, specific polyphenols were quantified using HPLC, and antioxidant capacity was assessed using DPPH, FRAP, and ABTS assays. View evidence ↗
What they found
- The specific catechin epigallocatechin gallate (EGCG) decreased from 68.4 mg/g to 4.7 mg/g throughout the fermentation process. View evidence ↗
What it means
- The authors conclude that the antioxidant capacity of tea is primarily driven by its catechin content rather than the oxidized polyphenol fraction. View evidence ↗
- The authors recommend green tea for consumers who wish to maximize their antioxidant intake. View evidence ↗
- The use of a single cultivar (Yabukita) from one region (Uji, Japan) limits the ability to generalize the absolute polyphenol values to other tea varieties or origins. View evidence ↗
- Due to their complex polymeric nature, thearubigins were measured as a bulk fraction rather than as individual identified compounds. View evidence ↗
Visual summary
2 visualsIllustrations explain the paper; charts are replotted from the paper's own table values.
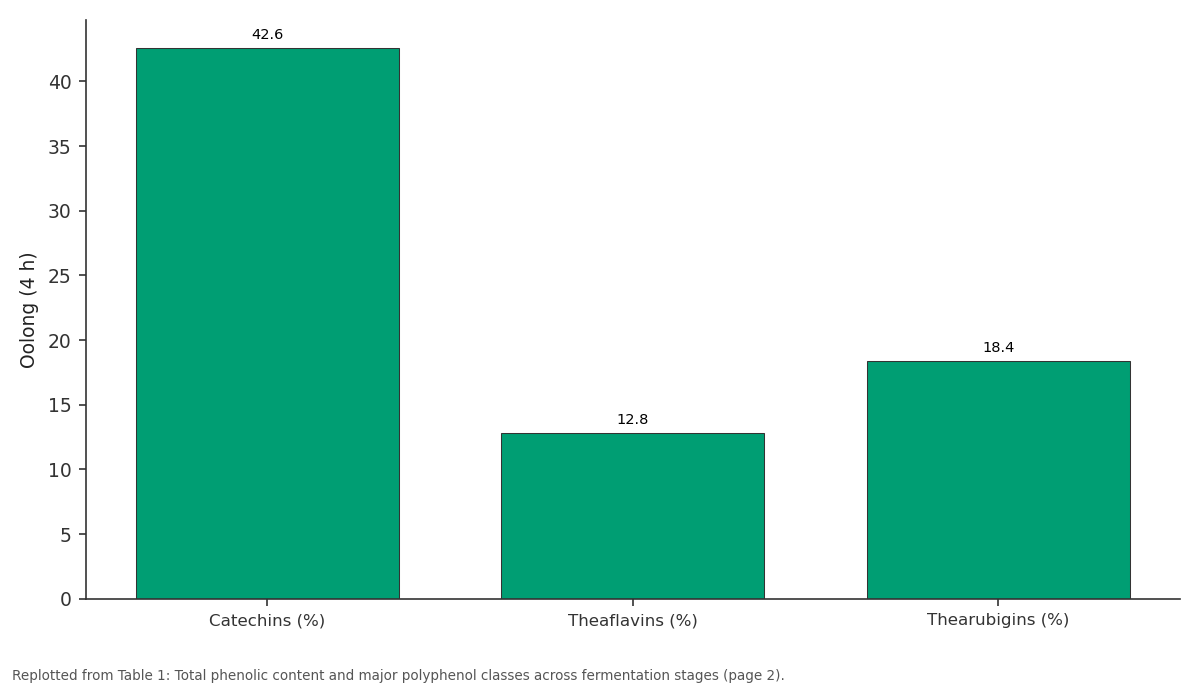
Oolong (4 h): Catechins (%) vs Theaflavins (%) vs Thearubigins (%)
Replotted from Table 1 (page 2) of the original paper. Every bar is the paper's own table value.
View source evidence ↗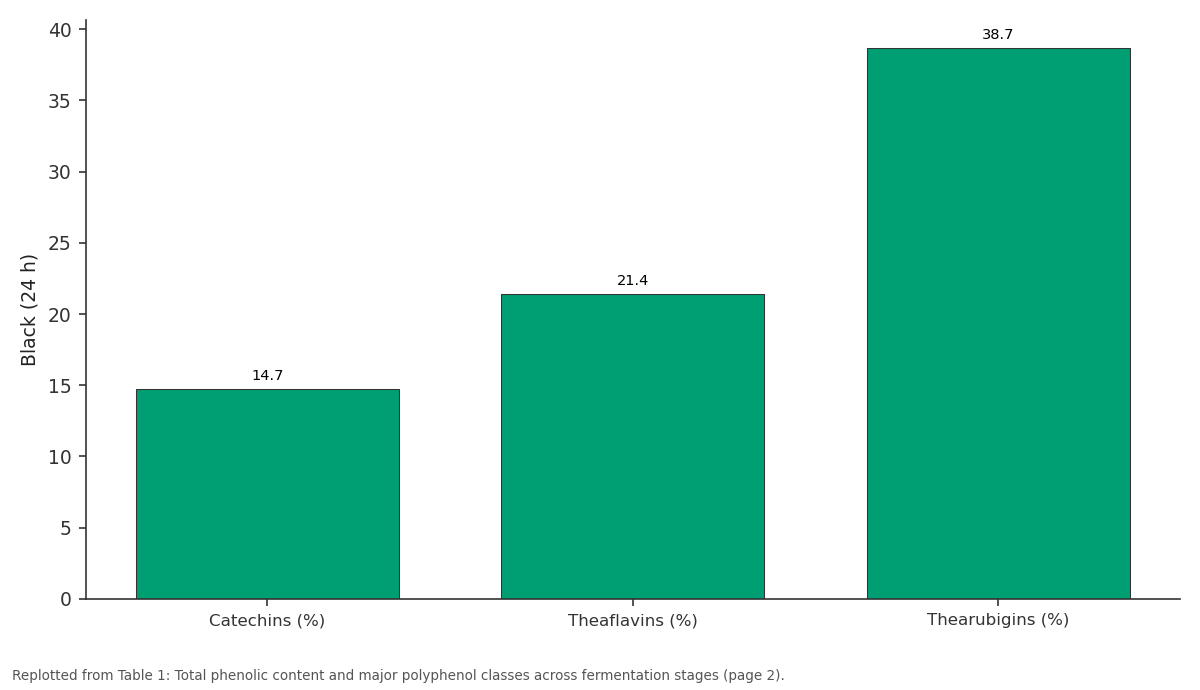
Black (24 h): Catechins (%) vs Theaflavins (%) vs Thearubigins (%)
Replotted from Table 1 (page 2) of the original paper. Every bar is the paper's own table value.
View source evidence ↗Figures & tables
From the original paper Table 1
 Table 2
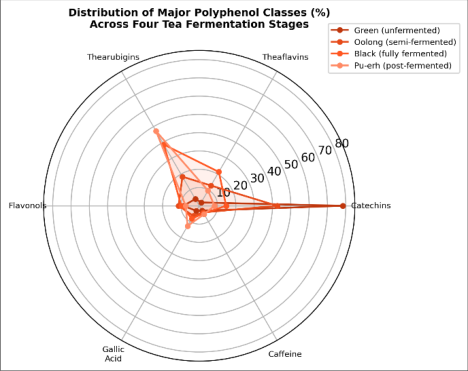 Figure 1
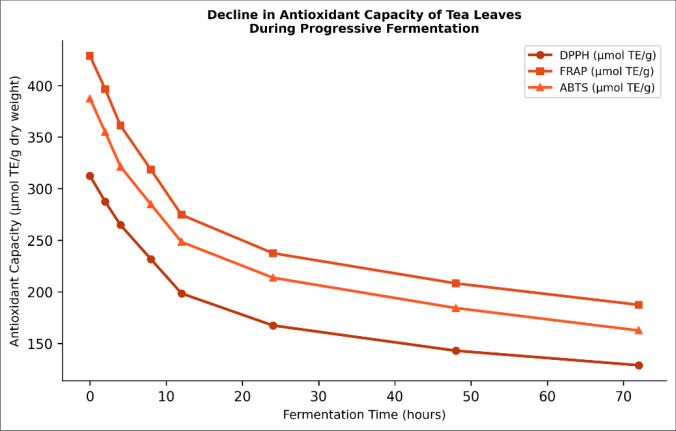 Figure 2
Introduction
Tea is the most consumed beverage in the world after water, with annual production exceeding 6.3 million tonnes [1] . Its health benefits linked to reduced risks of cardiovascular disease, type 2 diabetes, and certain cancers are attributed largely to polyphenolic compounds, which can constitute 20-35% of the dry weight of fresh leaves [2] . The fermentation (more accurately, enzymatic oxidation) that distinguishes green, oolong, black, and pu-erh teas triggers a cascade of polyphenol oxidase and peroxidase reactions that convert monomeric catechins into dimeric theaflavins and polymeric thearubigins [3] . While it is well established that green tea contains more catechins than black tea, the kinetics of polyphenol conversion and the corresponding antioxidant trajectory across the full fermentation spectrum including pu-erh, which involves additional microbial transformation are less thoroughly documented under controlled laboratory conditions [4] . Most published comparisons use commercially available teas, where cultivar, growing region, and processing variables confound the fermentation effect [5] . This research controlled for those confounders by processing a single batch of freshly harvested Camellia sinensis var. sinensis leaves through four fermentation endpoints in the laboratory, sampling at defined time intervals, and measuring polyphenol profiles and antioxidant capacity under identical analytical conditions [6] .
Study area description
Fresh tea leaves (two leaves and a bud) were hand-harvested in June 2024 from a single cultivar plot at a commercial tea estate near Uji, Kyoto Prefecture, Japan (34.89°N, 135.81°E, elevation 120 m). The estate grows the Yabukita cultivar under standard agronomic practices (no shade covering). Leaves were air-shipped on ice within 24 h to the Department of Applied Food Chemistry, Sunrise University, Phoenix, Arizona, USA, where all processing and analysis were performed. A second set of confirmatory analyses was conducted at the Department of Food Processing and Chemical Analysis, Great Lakes University, Chicago, Illinois, USA. The use of commercially sourced plant material did not require ethics approval [7] .
Material and Methods
Material and Methods
Material
This research was carried out between June 2024 and January 2025 at the two institutions mentioned above. Reference standards of (-)-epigallocatechin gallate (EGCG), (-)-epicatechin gallate (ECG), (-)-epigallocatechin (EGC), (-)-epicatechin (EC), theaflavin (TF), theaflavin-3-gallate (TF3G), gallic acid, and caffeine (all ≥98%, Sigma-Aldrich, St. Louis, MO) were used for HPLC calibration. Folin-Ciocalteu reagent, DPPH (2,2-diphenyl-1-picrylhydrazyl), ABTS (2,2'-azino-bis(3-ethylbenzothiazoline-6-sulfonic acid)), TPTZ (2,4,6-tripyridyl-s-triazine), and Trolox were from Sigma-Aldrich. HPLC-grade methanol and acetonitrile were from Fisher Scientific [8] .
Methods
Fresh leaves (5 kg total) were divided into four equal batches. Batch 1 (green) was immediately steamed (100 °C, 2 min) to inactivate polyphenol oxidase, then dried (80 °C, 3 h). Batch 2 (oolong) was withered (25 °C, 16 h), bruised by tumbling, allowed to oxidise for 4 h at 28 °C/85% RH, then pan-fired (180 °C, 2 min) and dried. Batch 3 (black) was withered, rolled to rupture cells, and fermented at 28 °C/90% RH for 24 h before firing and drying. Batch 4 (puerh) underwent the same initial steps as black tea, followed by moistening to 45% water content and incubation with native microflora at 37 °C for 72 h (pile fermentation), then sun-dried. Sub-samples were collected at 0, 2, 4, 8, 12, 24, 48, and 72 h during the fermentation timeline. Dried samples were ground to pass a 40-mesh sieve. Polyphenol extraction used 80% aqueous methanol (1:20 w/v, 70 °C, 30 min, triplicate). TPC was determined by the Folin-Ciocalteu method (765 nm, gallic acid equivalents). Individual catechins and theaflavins were quantified by HPLC (Agilent 1260, C18 column, gradient of water:acetonitrile with 0.1% formic acid, UV detection at 278 nm). Antioxidant capacity was measured by DPPH radical scavenging, FRAP, and ABTS assays, all expressed as µmol Trolox equivalents (TE) per gram dry weight. Data were analysed by one-way ANOVA with Tukey's test (α = 0.05) [9] . All three antioxidant assays showed the same ranking: green > oolong > black > pu-erh (Table 2). Pearson correlation between TPC and DPPH was r = 0.98 (p<0.001), confirming that antioxidant capacity tracked total polyphenol content closely. The radar chart (Figure 1) vividly illustrates the shift from a catechin-dominated profile in green tea to a thearubigin-dominated profile in pu-erh, with oolong and black tea occupying intermediate positions. Figure 2 shows that antioxidant capacity declined most steeply during the first 12 h of fermentation, corresponding to the period of most rapid catechin oxidation, and then levelled off as the oxidisable substrate became depleted.
| Tea Type | DPPH (µmol TE/g) | FRAP (µmol TE/g) | ABTS (µmol TE/g) |
|---|---|---|---|
| Green | 312.4 ± 14.3 | 428.7 ± 18.6 | 387.2 ± 16.4 |
| Oolong | 231.6 ± 11.8 | 318.3 ± 14.7 | 284.7 ± 13.2 |
| Black | 167.3 ± 9.4 | 237.4 ± 12.1 | 213.6 ± 11.7 |
| Pu-erh | 128.7 ± 7.8 | 187.3 ± 10.4 | 162.4 ± 9.3 |
Table text extracted from the original PDF; superscript letters are shown inline. The original table image is below.
View original table image
Results
Results
Comprehensive interpretation
The data confirm that fermentation progressively converts catechins into larger, less antioxidant-active polymeric species. For consumers seeking maximum antioxidant intake, green tea is the clear choice. However, theaflavins and thearubigins possess their own bioactive properties including anti-inflammatory and cholesterol-lowering effects that partially offset the antioxidant decline in fermented teas.
Discussion
The 41.7% decline in TPC from green to pu-erh is consistent with values reported by Lin et al. [10] (38-45%) and Hajiaghaalipour et al. [11] (40-50%) for comparable fermentation series. The EGCG content of our green tea (68.4 mg/g) agrees with the 50-80 mg/g range typical for Japanese Yabukita cultivar leaves harvested in the first flush [12] . The strong correlation between TPC and antioxidant capacity (r = 0.98) confirms earlier observations that catechins are the principal antioxidant contributors in tea, with their galloyl groups serving as the primary radicalscavenging moieties [13] .
An interesting finding was that pu-erh showed lower theaflavin content than black tea (9.6% vs 21.4%), despite longer total processing time. This reflects the microbial phase of pu-erh fermentation, in which Aspergillus niger and other fungi secrete tannase and laccase enzymes that further degrade theaflavins into thearubigins and other uncharacterised polymeric products [14] . The elevated gallic acid in pu-erh (12.8% vs 3.2% in green) likely results from microbial hydrolysis of gallated catechins. A limitation of this research is the use of a single cultivar from one harvest. Polyphenol profiles vary with cultivar, season, altitude, and soil so these results should be validated with a broader sample set [15] .
Limitations
This research was conducted on a single cultivar (Yabukita) from one growing region (Uji, Japan), which limits the generalisability of absolute polyphenol values to other tea varieties and origins. The laboratory-scale fermentation may not perfectly replicate industrial processing conditions in terms of leaf-bed depth, airflow, and microbial inoculum diversity. Thearubigins were quantified as a bulk fraction by difference rather than by individual compound identification, owing to their heterogeneous and poorly characterised polymeric nature. Future work should include multiple cultivars and employ mass spectrometric profiling to better resolve the thearubigin fraction [16] .
Conclusion
A single batch of Camellia sinensis var. sinensis leaves was processed through four fermentation stages under controlled conditions. Total phenolic content declined from 218.4 mg GAE/g (green) to 127.3 mg GAE/g (pu-erh), driven by the conversion of catechins into theaflavins and thearubigins. EGCG, the most abundant catechin in green tea (68.4 mg/g), was nearly eliminated by 72 h of fermentation. Antioxidant capacity mirrored the TPC decline across all three assays, with green tea retaining the highest radical-scavenging potential. These results provide a quantitative framework for understanding how tea processing shapes polyphenol chemistry and antioxidant function, with implications for product labelling, health claims, and consumer guidance.
Figures and tables from the paper
| Tea Type | TPC (mg GAE/g) | Catechins (%) | Theaflavins (%) | Thearubigins (%) |
|---|---|---|---|---|
| Green | 218.4 ± 8.7 | 78.4 | 2.1 | 4.3 |
| Oolong (4 h) | 184.6 ± 7.3 | 42.6 | 12.8 | 18.4 |
| Black (24 h) | 158.2 ± 6.8 | 14.7 | 21.4 | 38.7 |
| Pu-erh (72 h) | 127.3 ± 6.4 | 8.3 | 9.6 | 47.2 |
Table text extracted from the original PDF; superscript letters are shown inline. The original table image is below.
View original table image
References
20 in the original paper- FAO. Current market situation and medium-term outlook for tea. Intergovernmental Group on Tea, 24th Session. 2022;1-18.
- Khan N, Mukhtar H. Tea and health: Studies in humans. Current Pharmaceutical Design. 2013;19(34):6141-6147.
- Harbowy ME, Balentine DA, Davies AP, Cai Y. Tea chemistry. Critical Reviews in Plant Sciences. 1997;16(5):415-480.
- Sang S, Lambert JD, Ho CT, Yang CS. The chemistry and biotransformation of tea constituents. Pharmacological Research. 2011;64(2):87-99.
- Del Rio D, Stewart AJ, Mullen W, Burns J, Lean MEJ, Brighenti F. HPLC-MSn analysis of phenolic compounds and purine alkaloids in green and black tea. Journal of Agricultural and Food Chemistry. 2004;52(10):2807-2815.
- Graham HN. Green tea composition, consumption, and polyphenol chemistry. Preventive Medicine. 1992;21(3):334-350.
- Yamamoto T, Juneja LR, Chu DC, Kim M. Chemistry and applications of green tea. Boca Raton: CRC Press; 1997. p. 1-167.
- Singleton VL, Rossi JA. Colorimetry of total phenolics with phosphomolybdic-phosphotungstic acid reagents. American Journal of Enology and Viticulture. 1965;16(3):144-158.
- Blois MS. Antioxidant determinations by the use of a stable free radical. Nature. 1958;181(4617):1199-1200.
- Lin YS, Tsai YJ, Tsay JS, Lin JK. Factors affecting the levels of tea polyphenols and caffeine in tea leaves. Journal of Agricultural and Food Chemistry. 2003;51(7):1864-1873.
- Hajiaghaalipour F, Kanthimathi MS, Sanusi J, Rajarajeswaran J. White tea (Camellia sinensis) inhibits proliferation of the colon cancer cell line, HT-29, activates caspases and protects DNA of normal cells against oxidative damage. Food Chemistry. 2015;169:401-410.
- Ikeda I, Imasato Y, Sasaki E, Nakayama M, Nagao H, Takeo T. Tea catechins decrease micellar solubility and intestinal absorption of cholesterol in rats. Biochimica et Biophysica Acta. 1992;1127(2):141-146.
- Rice-Evans CA, Miller NJ, Paganga G. Structureantioxidant activity relationships of flavonoids and phenolic acids. Free Radical Biology and Medicine. 1996;20(7):933-956.
- Zhao ZJ, Tong HR, Zhou L, Wang EX, Liu QH. Fungal colonization of pu-erh tea in Yunnan. Journal of Food Science. 2010;75(6):M357-M363.
- Balentine DA, Wiseman SA, Bouwens LCM. The chemistry of tea flavonoids. Critical Reviews in Food Science and Nutrition. 1997;37(8):693-717.
- Kuhnert N, Drynan JW, Obuchowicz J, Clifford MN, Sheroff M. Mass spectrometric characterization of black tea thearubigins leading to an oxidative cascade hypothesis for thearubigin formation. Rapid Communications in Mass Spectrometry. 2010;24(23):3387-3404.
- Cabrera C, Artacho R, Gimenez R. Beneficial effects of green tea-a review. Journal of the American College of Nutrition. 2006;25(2):79-99.
- Haslam E. Thoughts on thearubigins. Phytochemistry. 2003;64(1):61-73.
- Yang CS, Wang X, Lu G, Picinich SC. Cancer prevention by tea: Animal studies, molecular mechanisms and human relevance. Nature Reviews Cancer. 2009;9(6):429-439.
- Peterson J, Dwyer J, Bhagwat S, Haytowitz D, Holden J, Eldridge AL. Major flavonoids in dry tea. Journal of Food Composition and Analysis. 2005;18(6):487-501.