
Research article · 2025 · Full text
International Journal of Advanced Chemistry ResearchPhytochemical composition and antioxidant activity of Terminalia arjuna bark extracts
Volume 7(7) · Pages 158–160 · DOI: 10.33545/26646781.2025.v7.i7c.531 ↗
Research areasPhytochemicals and Antioxidant ActivitiesPhytochemicals and Medicinal PlantsMedicinal Plant Research
Abstract
Author-writtenTerminalia arjuna (Roxb.) Wight & Arn. (family Combretaceae) is one of Ayurveda's most valued cardiac tonics, yet the correlation between its antioxidant capacity and phytochemical composition across solvent fractions has not been systematically characterised. This research prepared four bark extracts of T. arjuna (ethanol, methanol, ethyl acetate, and n-hexane) and evaluated them for total phenolic content (TPC) by Folin-Ciocalteu method, total flavonoid content (TFC) by aluminium chloride colorimetry, and antioxidant activity by DPPH radical scavenging, ABTS radical cation decolourisation, and FRAP assays. The ethyl acetate extract showed the highest TPC (347.8±14.2 mg GAE/g), TFC (156.2±6.8 mg QE/g), best DPPH IC50 (47.2±2.1 μg/mL), and highest ABTS (518.3±22.4 μmol TE/g) and FRAP values (476.8±19.7 μmol FeSO4/g). The n-hexane extract showed the weakest activity across all assays, consistent with its low phenolic and flavonoid content. Pearson correlation analysis showed strong positive correlations between TPC and all three antioxidant assays (r = 0.941-0.973), confirming phenolics as the principal contributors to radical-scavenging capacity in this species. These results rationalise the use of polar solvent fractionation for bioactivity-guided isolation of antioxidant constituents from T. arjuna bark.
Summary
Source-checkedPlain-language reading of the full paper, prepared with AI and checked against the text. Each point links to the authors' own words.
Why it matters
- Modern research suggests that the cardioprotective effects of T. arjuna are linked to its anti-hypertensive, anti-inflammatory, and antioxidant properties. View evidence ↗
- Previous antioxidant studies on T. arjuna often used only one solvent, failing to account for how different solvent polarities affect the extraction of active compounds. View evidence ↗
The question
- The study aimed to systematically characterize the relationship between the phytochemical composition and antioxidant capacity of T. arjuna bark across different solvent fractions. View evidence ↗
What they did
- The researchers prepared four different bark extracts using ethanol, methanol, ethyl acetate, and n-hexane. View evidence ↗
- Bark powder (20 g per run) was sequentially extracted using a Soxhlet apparatus for 48 hours per solvent in the order of n-hexane, ethyl acetate, methanol, and ethanol. View evidence ↗
- The extracts were analyzed for total phenolic content (TPC) and total flavonoid content (TFC), and their antioxidant activity was measured using DPPH, ABTS, and FRAP assays. View evidence ↗
What they found
- Ethanol provided the highest extraction yield (12.4% w/w), while n-hexane provided the lowest (3.1% w/w). View evidence ↗
- The ethyl acetate extract contained the highest concentrations of phenolics (347.8±14.2 mg GAE/g) and flavonoids (156.2±6.8 mg QE/g). View evidence ↗
- The ethyl acetate extract demonstrated the strongest antioxidant activity, with the lowest DPPH IC50 (47.2±2.1 μg/mL) and the highest ABTS (518.3±22.4 μmol TE/g) and FRAP (476.8±19.7 μmol FeSO4/g) values. View evidence ↗
- The n-hexane extract exhibited the weakest antioxidant activity, which correlated with its low levels of flavonoids and phenolics. View evidence ↗
- There was a strong positive correlation (r = 0.941-0.973) between total phenolic content and all three antioxidant assays, indicating phenolics are the primary drivers of antioxidant capacity. View evidence ↗
What it means
- The authors conclude that the ethyl acetate fraction should be prioritized for the isolation of specific antioxidant compounds. View evidence ↗
- The results provide a quantitative foundation for standardizing T. arjuna bark preparations for use in pharmaceuticals and nutraceuticals. View evidence ↗
Visual summary
3 visualsIllustrations explain the paper; charts are replotted from the paper's own table values.
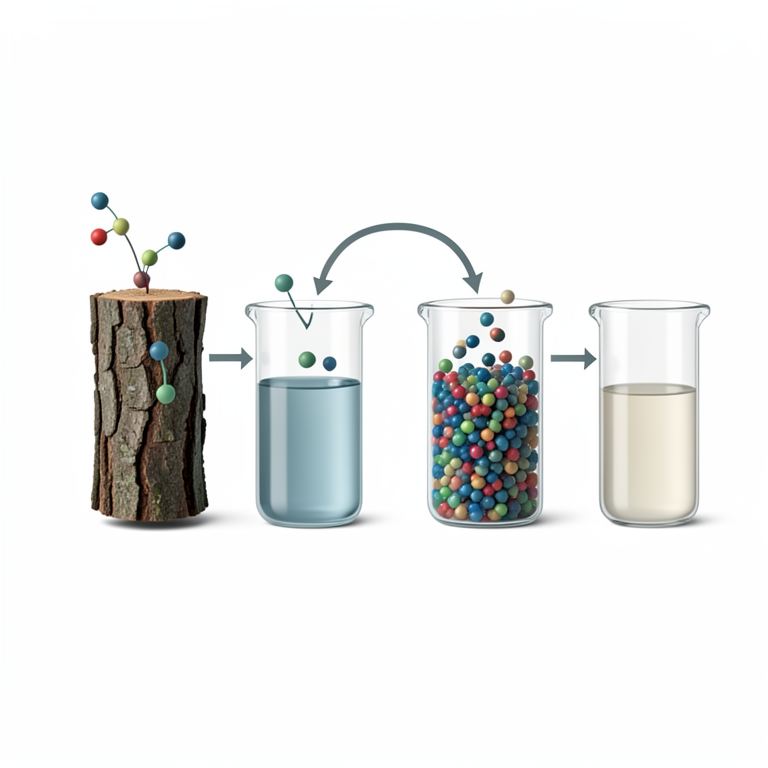
Solvent Polarity and Bioactivity
AI-generated conceptual illustration (Terminalia arjuna tree bark). It explains the idea and does not show study data.
View source evidence ↗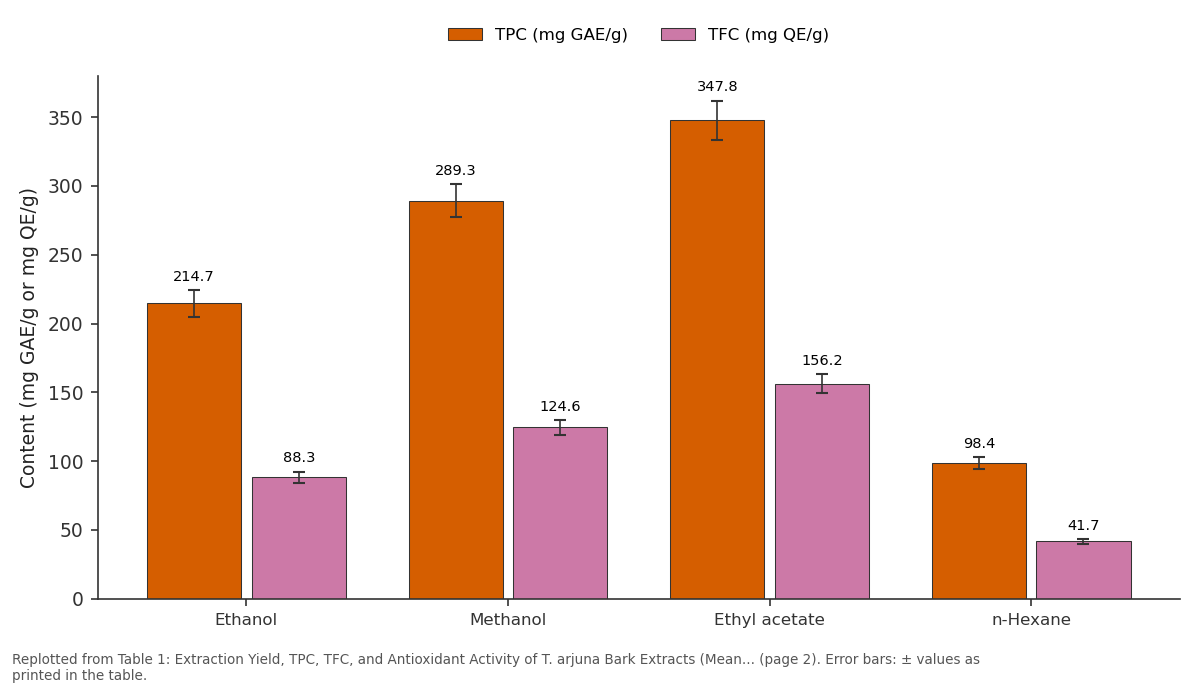
TPC (mg GAE/g) and TFC (mg QE/g): Ethanol vs Methanol vs Ethyl acetate vs n-Hexane
Replotted from Table 1 (page 2) of the original paper. Every bar is the paper's own table value.
View source evidence ↗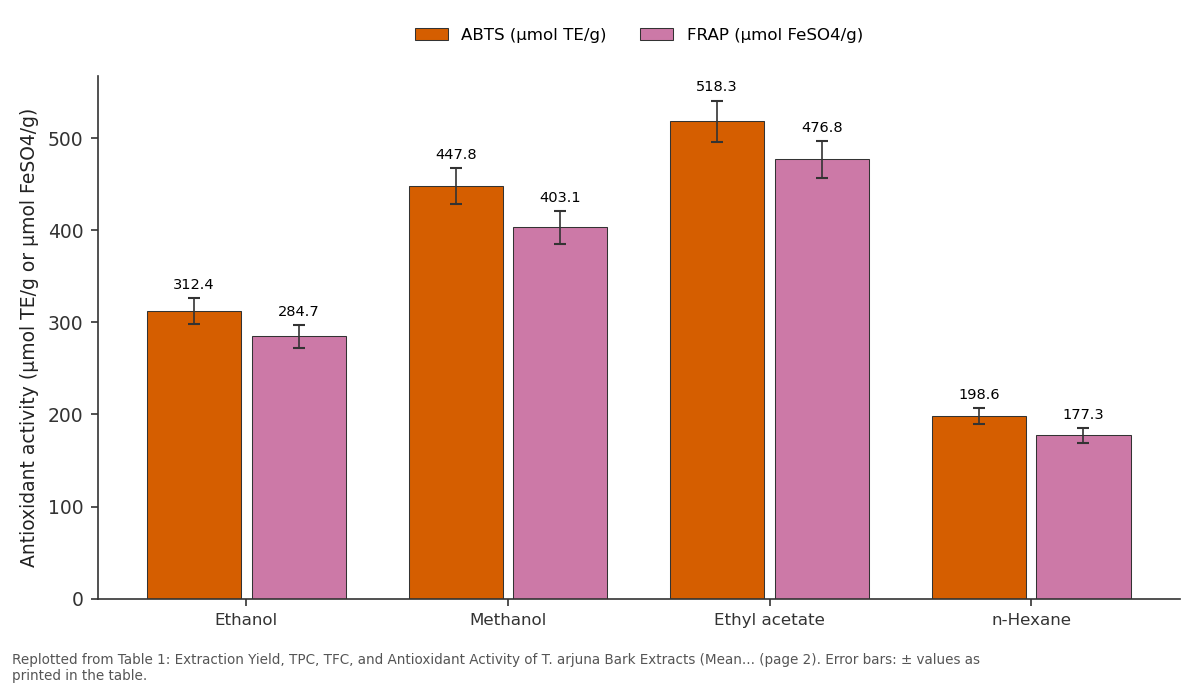
ABTS (μmol TE/g) and FRAP (μmol FeSO4/g): Ethanol vs Methanol vs Ethyl acetate vs n-Hexane
Replotted from Table 1 (page 2) of the original paper. Every bar is the paper's own table value.
View source evidence ↗Figures & tables
From the original paper Table 1
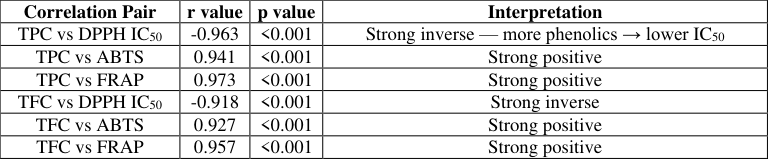 Table 2
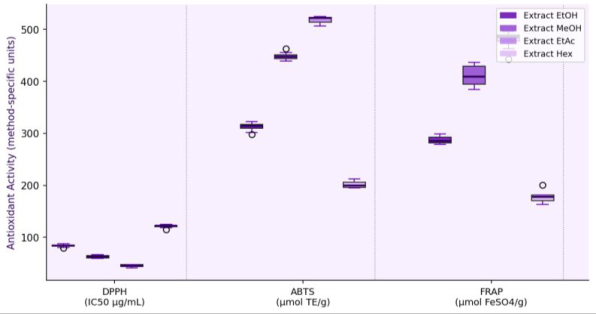 Figure 1
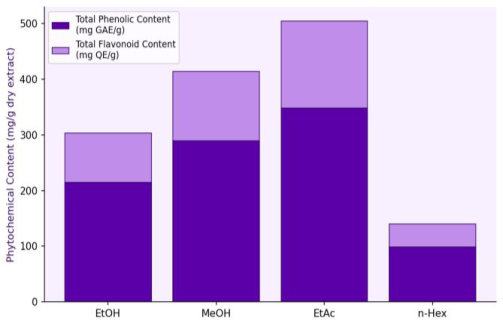 Figure 2
Introduction
T. arjuna is a deciduous tree distributed widely across the river banks of the Indian subcontinent. Its bark has been used in traditional Ayurvedic medicine for over three millennia, primarily as a cardioprotective agent in formulations such as arjuna ksheerapaka, but also for wound healing, haemostasis, and management of liver disorders. Modern pharmacological investigation has attributed its cardioprotective effects to antioxidant, antiinflammatory, and anti-hypertensive properties, with arjunolic acid, terminoside, and various flavonoid glycosides identified as principal bioactive constituents. Despite a growing body of literature on T. arjuna pharmacology, most reported antioxidant measurements are based on a single solvent extract, typically aqueous or ethanolic, which does not capture the contribution of fractions with different polarity profiles. Systematic comparison of ethanol, methanol, ethyl acetate, and n-hexane extracts using three mechanistically distinct antioxidant assays-DPPH (hydrogen atom transfer), ABTS (electron transfer), and FRAP (reducing power)-provides a more complete picture of the antioxidant potential and the polarity dependence of active constituents. This research provides this analysis for T. arjuna bark, linking antioxidant capacity to TPC and TFC to identify the most promising fraction for further bioactivity-guided isolation.
Materials and Methods
Materials and Methods
Materials and Reagents
Materials and Reagents
Extraction Protocol
Dried bark (shade-dried 30 days, powdered to 60-mesh) was sequentially extracted in 250 mL Soxhlet apparatus: nhexane (48 h), followed by ethyl acetate (48 h), methanol (48 h), and ethanol (48 h), each using 20 g powder per run. Extracts were concentrated by rotary evaporation (40 °C) and dried under vacuum to constant weight. Yield (% w/w) was calculated relative to dry powder weight and extract stored at -20 °C in amber glass vials until analysis.
Phytochemical Screening
Qualitative phytochemical tests followed standard protocols (Harborne 1998; Kokate et al. 2014) [2,1] , detecting alkaloids (Mayer's, Wagner's, Dragendorff's), flavonoids (lead acetate, NaOH tests), tannins (FeCl3, gelatin tests), saponins (foam test), terpenoids (Salkowski test), and glycosides (Keller-Killiani test). TPC was determined by Folin-Ciocalteu method using gallic acid calibration (R² = 0.997); TFC by aluminium chloride colorimetry with quercetin as standard (R² = 0.994). All measurements were in triplicate and expressed as mg GAE or mg QE per gram dry extract.
Antioxidant Assays
DPPH assay: Extracts at 12.5-200 μg/mL in methanol were mixed with 0.1 mM DPPH solution and read at 517 nm after 30 min in dark. IC 50 was calculated by non-linear regression. ABTS assay: ABTS radical cation was generated by oxidation of ABTS with potassium persulphate (16 h, dark), diluted to absorbance 0.70±0.02 at 734 nm. Trolox standard curve was used for TE expression (R² = 0.996). FRAP assay: FRAP reagent (acetate buffer pH 3.6, TPTZ, FeCl3) was incubated with extract at 37 °C for 10 min and read at 593 nm against FeSO4 standard curve (R² = 0.998). Ascorbic acid served as positive control in all assays. Pearson correlation coefficients between TPC/TFC and assay values were calculated in SPSS 26.
Results
Extraction yields were highest for ethanol (12.4% w/w) and methanol (10.7% w/w), intermediate for ethyl acetate (7.3% w/w), and lowest for n-hexane (3.1% w/w). Qualitative screening confirmed alkaloids, flavonoids, tannins, and terpenoids in polar fractions; the n-hexane fraction was predominantly terpenoid and lacked detectable flavonoids or tannins. TPC and TFC followed the order ethyl acetate > methanol > ethanol > n-hexane (Figure 2, Table 1). Antioxidant activity across all three assays mirrored this order, with ethyl acetate showing the lowest DPPH IC 50 (47.2±2.1 μg/mL, best activity) and highest ABTS and FRAP values. TPC correlated strongly with DPPH (r = -0.963, inverse because lower IC 50 = higher activity), ABTS (r = 0.941), and FRAP (r = 0.973) (Table 2). TFC showed similarly strong correlations (r = 0.918-0.957).
| Correlation Pair | r value | p value | Interpretation |
|---|---|---|---|
| TPC vs DPPH IC50 | -0.963 | <0.001 | Strong inverse — more phenolics → lower IC50 |
| TPC vs ABTS | 0.941 | <0.001 | Strong positive |
| TPC vs FRAP | 0.973 | <0.001 | Strong positive |
| TFC vs DPPH IC50 | -0.918 | <0.001 | Strong inverse |
| TFC vs ABTS | 0.927 | <0.001 | Strong positive |
| TFC vs FRAP | 0.957 | <0.001 | Strong positive |
Table text extracted from the original PDF; superscript letters are shown inline. The original table image is below.
View original table image
| Extract | Yield (%) | TPC (mg GAE/g) | TFC (mg QE/g) | DPPH IC50 (μg/mL) | ABTS (μmol TE/g) | FRAP (μmol FeSO4/g) |
|---|---|---|---|---|---|---|
| Ethanol | 12.4 | 214.7±9.8 | 88.3±4.1 | 84.3±3.7 | 312.4±14.1 | 284.7±12.4 |
| Methanol | 10.7 | 289.3±12.1 | 124.6±5.4 | 61.7±2.8 | 447.8±19.3 | 403.1±17.8 |
| Ethyl acetate | 7.3 | 347.8±14.2 | 156.2±6.8 | 47.2±2.1 | 518.3±22.4 | 476.8±19.7 |
| n-Hexane | 3.1 | 98.4±4.3 | 41.7±1.9 | 119.8±5.1 | 198.6±8.7 | 177.3±7.9 |
Table text extracted from the original PDF; superscript letters are shown inline. The original table image is below.
View original table image
Discussion
The superior antioxidant activity of the ethyl acetate fraction despite its lower yield is the most important practical finding of this research. Ethyl acetate selectively concentrates mid-polarity phenolics-particularly flavonoid aglycones, ellagitannins, and arjunolic acid derivativesthat are responsible for hydrogen atom transfer and electron donation to free radicals. The polar methanol and ethanol fractions, while higher yielding, also extract sugars, amino acids, and other non-antioxidant constituents that dilute the specific activity per gram of extract, explaining the lower observed TPC/TFC relative to ethyl acetate. The DPPH assay IC 50 of 47.2 μg/mL for the ethyl acetate fraction is comparable to published values for positive controls such as ascorbic acid (IC 50 approximately 20-35 μg/mL) and superior to many other medicinal plant bark extracts reported in the literature. The high Pearson correlations (r > 0.90 for all TPC-assay pairs) confirm that phenolic compounds are the dominant contributors to radical scavenging, which is consistent with the established chemistry of T. arjuna bark. Tannins, which include castalagin, punicalin, and arjunagenin in this species, are particularly efficient radical scavengers due to their multiple catechol moieties. The n-hexane fraction's weak activity confirms that terpenoids and fatty acids-its principal components-contribute negligibly to antioxidant capacity under these assay conditions.
Conclusion
Four solvent extracts of T. arjuna bark were evaluated for phytochemical content and antioxidant activity. The ethyl acetate extract was superior across all measures: highest TPC (347.8 mg GAE/g), TFC (156.2 mg QE/g), best DPPH IC 50 (47.2 μg/mL), and maximum ABTS and FRAP values.
Strong Pearson correlations (r = 0.918-0.973) confirmed phenolics and flavonoids as the principal antioxidant contributors. These findings support prioritising the ethyl acetate fraction for bioactivity-guided isolation of specific antioxidant constituents and provide a quantitative basis for standardisation of T. arjuna bark preparations in nutraceutical and pharmaceutical applications.
Figures and tables from the paper
References
16 in the original paper- Kokate CK, Purohit AP, Gokhale SB. Pharmacognosy. 48th ed. Pune: Nirali Prakashan; 2014.
- Harborne JB. Phytochemical Methods: A Guide to Modern Techniques of Plant Analysis. 3rd ed. London: Chapman and Hall; 1998.
- Singleton VL, Rossi JA Jr. Colorimetry of total phenolics with phosphomolybdic-phosphotungstic acid reagents. Am J Enol Vitic. 1965;16(3):144-158.
- Chang CC, Yang MH, Wen HM, Chern JC. Estimation of total flavonoid content in propolis by two complementary colorimetric methods. J Food Drug Anal. 2002;10(3):178-182.
- Blois MS. Antioxidant determinations by the use of a stable free radical. Nature. 1958;181(4617):1199-1200.
- Re R, Pellegrini N, Proteggente A, Pannala A, Yang M, Rice-Evans C. Antioxidant activity applying an improved ABTS radical cation decolourisation assay. Free Radic Biol Med. 1999;26(9-10):1231-1237.
- Benzie IF, Strain JJ. The ferric reducing ability of plasma (FRAP) as a measure of antioxidant power: the FRAP assay. Anal Biochem. 1996;239(1):70-76.
- Mandal SC, Kumar CK, Majumder A, Majumder R, Maiti BC. Antitussive effect of Terminalia arjuna bark extracts on sulphur dioxide-induced cough model in mice. Phytomedicine. 2000;7(4):307-312.
- Ram A, Lauria P, Gupta R, Kumar P, Sharma VN. Hypocholesterolaemic effects of Terminalia arjuna tree bark. J Ethnopharmacol. 1997;55(3):165-169.
- Manna P, Sinha M, Sil PC. Protective role of Terminalia arjuna against cardiotoxicity of carbon tetrachloride. Hum Exp Toxicol. 2007;26(5):377-387.
- Biswas M, Kar B, Bhattacharya S, Kumar RB, Ghosh AK, Haldar PK. Antihyperglycaemic activity and antioxidant role of Terminalia arjuna leaf in streptozotocin-induced diabetic rats. Pharm Biol. 2011;49(3):335-340.
- Sumitra M, Manikandan P, Kumar DA, Arutselvan N, Balakrishna K, Manohar BM, et al. Experimental myocardial necrosis in rats: role of arjunolic acid on platelet aggregation, coagulation and antioxidant status. Mol Cell Biochem. 2001;224(1-2):135-142.
- Shaila HP, Udupa SL, Udupa AL. Hypolipidemic activity of three indigenous drugs in experimentally induced atherosclerosis. Int J Cardiol. 1998;67(2):119124.
- Prior RL, Wu X, Schaich K. Standardized methods for the determination of antioxidant capacity and phenolics in foods and dietary supplements. J Agric Food Chem. 2005;53(10):4290-4302.
- Kabera JN, Semana E, Mussa AR, He X. Plant secondary metabolites: biosynthesis, classification, function and pharmacological properties. J Pharm Pharmacol. 2014;2(7):377-392.
- Edeoga HO, Okwu DE, Mbaebie BO. Phytochemical constituents of some Nigerian medicinal plants. Afr J Biotechnol. 2005;4(7):685-688.