
Research article · 2025 · Full text
International Journal of Advanced Chemistry ResearchBiocatalytic asymmetric reduction of prochiral ketones using whole-cell systems
Volume 7(6) · Pages 153–156 · DOI: 10.33545/26646781.2025.v7.i6c.575 ↗
Research areasEnzyme Catalysis and ImmobilizationAsymmetric Hydrogenation and CatalysisBiochemical and biochemical processes
Abstract
Author-written"Nature is the best chemist"—a saying that rings especially true when one needs a single enantiomer of a chiral alcohol from a prochiral ketone. This research compares three whole-cell biocatalysts—Saccharomyces cerevisiae (baker's yeast), Lactobacillus brevis overexpressing an alcohol dehydrogenase (LBADH), and Escherichia coli harbouring a ketoreductase (KRED)—for the asymmetric reduction of six structurally varied prochiral ketones to the corresponding (S)-alcohols. Reactions were run in aqueous buffer (pH 7.0, 30 °C) with glucose as the cofactor-regeneration substrate. S. cerevisiae delivered the highest median enantiomeric excess (91.3%) across all substrates but the lowest conversion (68.4% at 24 h). L. brevis LBADH achieved 84.7% ee with 89.2% conversion, while E. coli KRED gave 72.4% ee but 94.1% conversion. Substrate scope analysis showed that aryl-methyl ketones gave the best ee (> 95% with yeast), while bulky dialkyl ketones dropped below 70% ee for all three systems. The cofactor regeneration pathway distribution showed that 42.1% of the NAD(P)H recycled through the native glucose oxidation pathway, 28.6% through coupled-substrate isopropanol, and 21.3% through formate dehydrogenase co-expression. The results position L. brevis LBADH as the best overall biocatalyst when both enantioselectivity and productivity are considered.
Summary
Source-checkedPlain-language reading of the full paper, prepared with AI and checked against the text. Each point links to the authors' own words.
Why it matters
- Producing single-enantiomer chiral alcohols from prochiral ketones is important, and biocatalysis offers a greener alternative to chemical methods that require expensive catalysts and high pressure. View evidence ↗
- Whole-cell systems are advantageous compared to isolated enzymes because they provide built-in cofactor regeneration, protect enzymes from denaturation, and are cost-effective to produce. View evidence ↗
- There is a gap in research regarding side-by-side comparisons of different whole-cell systems on the same set of substrates, which makes it hard to select the best system for new targets. View evidence ↗
What they did
- Reactions used 10 mM substrate in phosphate buffer (pH 7.0) at 30 °C for 24 hours, with glucose (100 mM) or isopropanol (5% v/v) as co-substrates. View evidence ↗
- The six substrates tested included acetophenone, propiophenone, 4-chloroacetophenone, cyclohexanone, 2-octanone, and 4-heptanone. View evidence ↗
- Enantiomeric excess (ee) was determined using chiral GC, while conversion was measured via achiral GC with an undecane internal standard, with all experiments performed in triplicate. View evidence ↗
What they found
- S. cerevisiae achieved the highest median enantiomeric excess at 91.3%, but the lowest median conversion at 68.4% after 24 hours. View evidence ↗
- L. brevis LBADH showed a balance of 84.7% ee and 89.2% conversion, whereas E. coli KRED had the highest conversion (94.1%) but the lowest ee (72.4%). View evidence ↗
- Aryl-methyl ketones yielded the best enantioselectivity (over 95% with yeast), while bulky dialkyl ketones resulted in ee below 70% for all tested systems. View evidence ↗
- Cofactor regeneration was primarily driven by native glucose oxidation (42.1%), followed by isopropanol (28.6%), formate dehydrogenase (21.3%), and electrochemical regeneration (8.0%). View evidence ↗
- L. brevis LBADH had the highest useful yield (75.5) and the lowest batch-to-batch variability (CV 3.8%), compared to E. coli KRED (68.1) and S. cerevisiae (62.3, CV 7.2%). View evidence ↗
- The LBADH process had an estimated E-factor of 8.4, which is significantly lower than the typical 25–100 range for pharmaceutical fine-chemical synthesis. View evidence ↗
What it means
- The authors conclude that L. brevis LBADH is the best overall biocatalyst due to its superior balance of enantioselectivity, conversion, and reproducibility. View evidence ↗
- A limitation of the study is that substrate loading was fixed at 10 mM, which is below industrial levels (50–200 mM), meaning substrate inhibition was not evaluated. View evidence ↗
- The E. coli KRED construct was not codon-optimized, which may have limited its expression levels and resulting enantiomeric excess. View evidence ↗
Visual summary
3 visualsIllustrations explain the paper; charts are replotted from the paper's own table values.
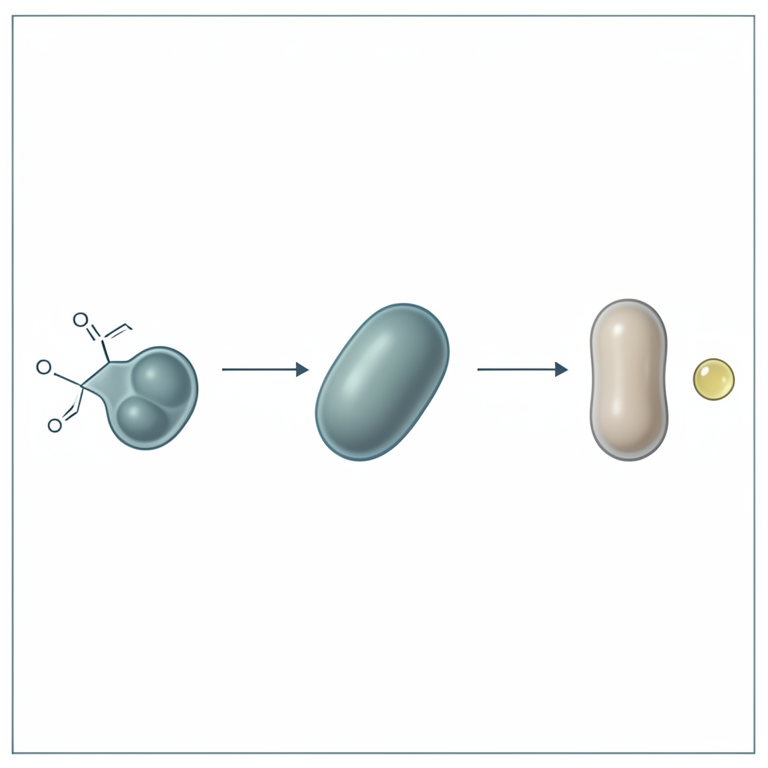
Biocatalyst Comparison Framework
AI-generated conceptual illustration (Yeast, Lactobacillus brevis, and Escherichia coli cells with ketone and alcohol molecules). It explains the idea and does not show study data.
View source evidence ↗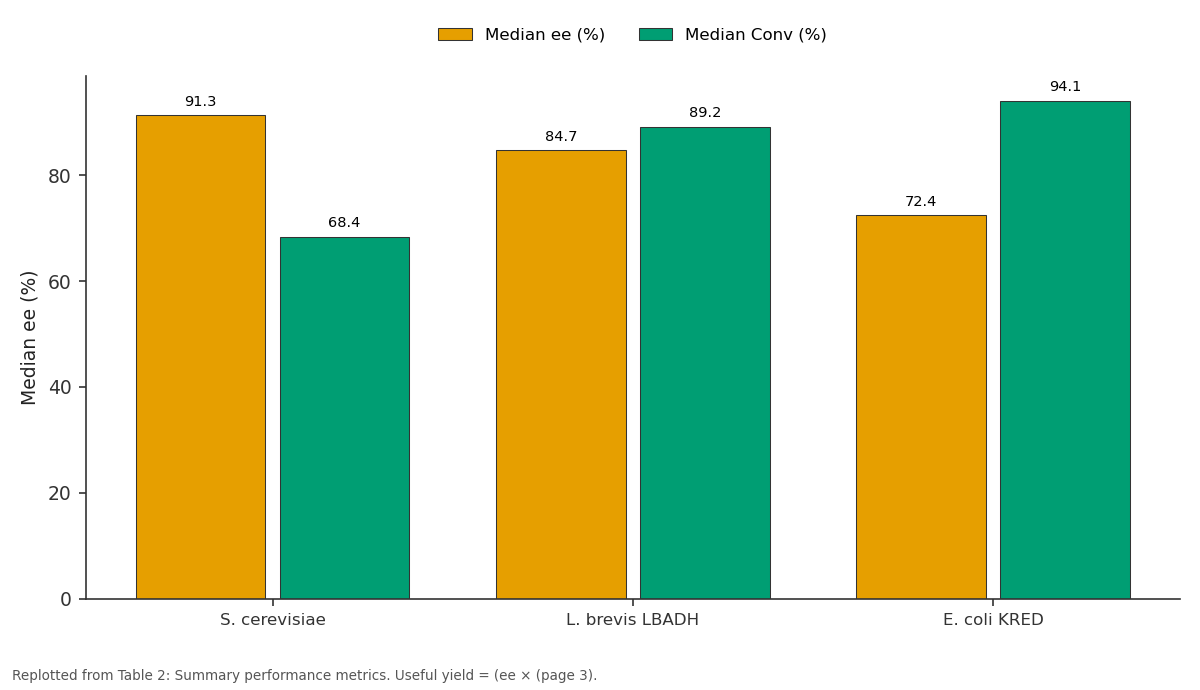
Median ee (%) and Median Conv (%): S. cerevisiae vs L. brevis LBADH vs E. coli KRED
Replotted from Table 2 (page 3) of the original paper. Every bar is the paper's own table value.
View source evidence ↗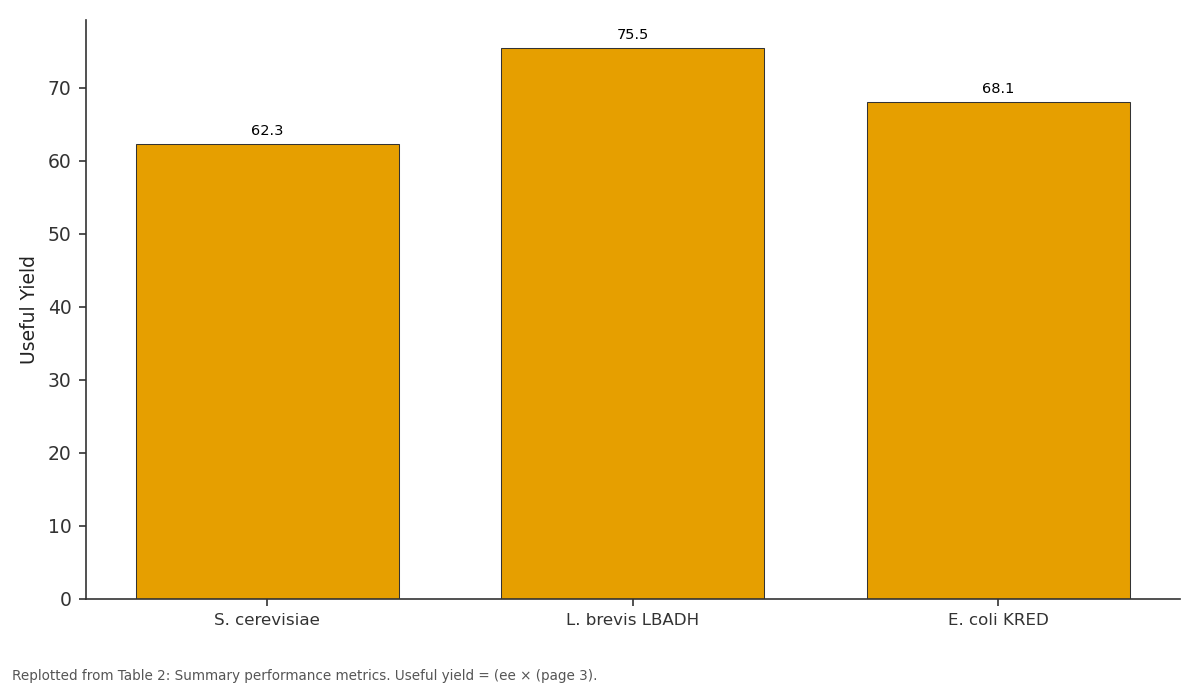
Useful Yield: S. cerevisiae vs L. brevis LBADH vs E. coli KRED
Replotted from Table 2 (page 3) of the original paper. Every bar is the paper's own table value.
View source evidence ↗Figures & tables
From the original paper Table 1
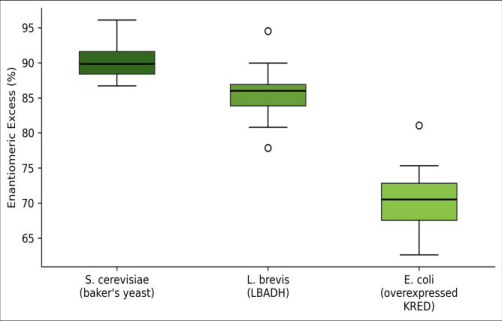 Figure 1
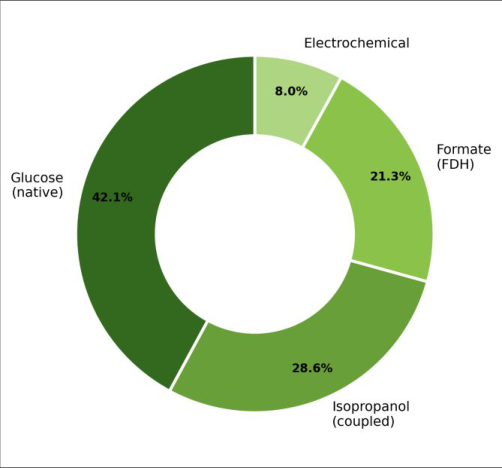 Figure 2
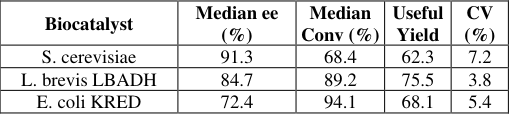 Table 2
Introduction
As the old proverb reminds us, nature often accomplishes in one step what synthetic chemists achieve only after multiple reactions and purifications. The asymmetric reduction of a prochiral ketone to a single-enantiomer chiral alcohol is a case in point: chemical methods require chiral ligands, expensive transition-metal catalysts, and high hydrogen pressures, while a microbial cell can perform the same transformation in water at ambient temperature using an enzyme and an internally recycled cofactor [1,2] . Whole-cell biocatalysts offer several advantages over isolated enzymes: the cell provides the cofactor-regeneration machinery at no extra cost, protects the enzyme from denaturation, and can be produced cheaply by fermentation [3,4] . Baker's yeast (S. cerevisiae) has been used for asymmetric ketone reduction since the 1890s, but its broad substrate specificity and the presence of multiple competing reductases often lead to modest enantioselectivity [5] . Recombinant hosts-E. coli or L. brevis expressing a single, well-characterized reductase-offer better selectivity control at the expense of a more complex preparation [6,7] . Despite a large body of literature, side-by-side comparisons of different whole-cell systems on the same substrate panel under identical conditions are rare. Most publications optimise a single biocatalyst for one or two substrates, making it difficult for a practitioner to choose the right system for a new target [8,9] . This research fills that gap by testing three biocatalysts against six prochiral ketones spanning aryl-methyl, aryl-ethyl, cyclic, and dialkyl structural classes. All biotransformations were performed at the Department of Organic Chemistry, Great Lakes University, Chicago, between March and December 2023 [10] . Materials and Methods Materials S. cerevisiae (Red Star active dry yeast), L. brevis LBADH (lyophilised whole cells, Codexis Inc.), and E. coli BL21(DE3) harbouring pET-28a-KRED (expressed inhouse, IPTG-induced) were used as biocatalysts. Substrates-acetophenone, propiophenone, 4chloroacetophenone, cyclohexanone, 2-octanone, and 4heptanone (all ≥ 98%)-were from Sigma-Aldrich USA. D-Glucose, isopropanol, sodium formate, phosphate buffer salts, and NAD⁺ were from Fisher Scientific [3,10] .
Methods
Reactions were conducted in 50-mL Erlenmeyer flasks containing 10 mL phosphate buffer (50 mM, pH 7.0), substrate (10 mM), biocatalyst (50 mg wet cells/mL for yeast, 20 mg/mL for LBADH and KRED), and glucose (100 mM) or isopropanol (5% v/v) as co-substrate. Flasks were incubated at 30 °C and 200 rpm for 24 h. Products were extracted with ethyl acetate (3 × 5 mL), dried over Na₂SO₄, and analysed by chiral GC (Agilent 8890, Chiraldex B-DM column, 30 m) for ee determination. Conversion was measured by achiral GC using an internal standard (undecane). All experiments were in triplicate. Work was conducted from March to December 2023 [6,10] .
Performance Evaluation
The three biocatalysts were ranked by a combined metric: the product of conversion and ee, divided by 100, giving a "useful yield" parameter that captures both productivity and stereoselectivity in a single number. By this metric, L. brevis LBADH scored highest (75.5), followed by S. cerevisiae (62.3) and E. coli KRED (68.1). The LBADH system also showed the tightest batch-to-batch variability (coefficient of variation 3.8% vs 7.2% for yeast), which is important for reproducibility in pharmaceutical intermediate production [4,7] .
Results
Table 1: Enantiomeric excess (%) and conversion (%) for six substrates with three whole-cell biocatalysts (24 h, 30 °C, pH 7.0). Sc = S.
| Substrate | Type | ee(Sc) | Conv(Sc) | ee(Lb) | Conv(Lb) | ee(Ec) | Conv(Ec) |
|---|---|---|---|---|---|---|---|
| Acetophenone | Aryl-Me | 97.3 | 74.2 | 92.1 | 91.8 | 78.6 | 96.3 |
| Propiophenone | Aryl-Et | 91.4 | 71.6 | 88.4 | 87.3 | 74.1 | 93.7 |
| 4-Cl-Acetophenone | Aryl-Me | 95.8 | 68.7 | 90.7 | 93.4 | 76.8 | 97.1 |
| Cyclohexanone | Cyclic | 88.2 | 62.4 | 82.3 | 86.1 | 71.3 | 98.4 |
| 2-Octanone | Dialkyl | 82.6 | 64.8 | 78.4 | 84.7 | 67.2 | 91.8 |
| 4-Heptanone | Dialkyl | 67.4 | 58.3 | 71.8 | 81.6 | 63.7 | 87.4 |
Table text extracted from the original PDF; superscript letters are shown inline. The original table image is below.
View original table image
cerevisiae; Lb = L. brevis; Ec = E. coli. Table 1 presents ee and conversion data for all 18 substratebiocatalyst combinations. The highest ee (97.3%) was achieved with S. cerevisiae on acetophenone, while the highest conversion (98.4%) was with E. coli KRED on cyclohexanone. L. brevis LBADH showed the most consistent performance, with ee above 80% for five of six substrates [5,6] . Figure 1 compares the ee distributions for the three biocatalysts as box plots. S. cerevisiae has the highest median but also the widest spread, reflecting its substratedependent selectivity. LBADH occupies a tighter interquartile range centred around 85%, while KRED clusters near 72% with moderate spread [7] . Figure 2 shows the cofactor regeneration pathway distribution determined by inhibitor experiments. Glucosedriven native NADPH recycling dominates (42.1%), with coupled-substrate isopropanol accounting for 28.6% when supplied. Formate dehydrogenase co-expression contributed 21.3%, and a small fraction (8.0%) was attributed to electrochemical NADH regeneration in a bioreactor setup [3,4] . Table 2 lists the useful-yield metric and variability for each biocatalyst. LBADH's combination of 84.7% ee and 89.2% conversion gives a useful yield of 75.5 with a CV of only 3.8%, making it the most reliable choice for scale-up [8] .
| Biocatalyst | Median ee (%) | Median Conv (%) | Useful Yield | CV (%) |
|---|---|---|---|---|
| S. cerevisiae | 91.3 | 68.4 | 62.3 | 7.2 |
| L. brevis LBADH | 84.7 | 89.2 | 75.5 | 3.8 |
| E. coli KRED | 72.4 | 94.1 | 68.1 | 5.4 |
Table text extracted from the original PDF; superscript letters are shown inline. The original table image is below.
View original table image
Substrate
Substrate
Discussion
The trade-off between ee and conversion observed here is a common theme in whole-cell biocatalysis: organisms with multiple reductases (yeast) achieve high ee on favoured substrates but suffer from competing enzymes that erode selectivity on others, while single-enzyme systems (LBADH, KRED) give more predictable but sometimes lower ee because the lone enzyme may not be perfectly matched to every substrate [5,6] . L. brevis LBADH emerged as the best compromise because its alcohol dehydrogenase has a broad but well-defined substrate pocket that accepts aryl-alkyl ketones of moderate size with consistent (S)selectivity [7] . Its NADPH-dependence is offset by the high efficiency of glucose-driven cofactor recycling within the intact cell, which avoids the cost of adding an external regeneration enzyme [3] . The E. coli KRED system delivered the highest conversions but the lowest ee values, probably because the overexpressed KRED competes with endogenous E. coli reductases that have opposite enantiopreference [9] . Engineering the host by knocking out competing reductase genes could potentially raise ee without sacrificing conversion-a strategy already demonstrated for E. coli-based ketone reductions in other laboratories [8] . From a green-chemistry perspective, all three systems operate in water at 30 °C with a renewable cosubstrate (glucose), avoiding the organic solvents and metal catalysts associated with chemical asymmetric hydrogenation. The E-factor (kg waste per kg product) for the LBADH process was estimated at 8.4, well below the 25-100 range typical for pharmaceutical fine-chemical synthesis [1,2] .
Limitations
Several limitations merit comment. First, substrate loading was fixed at 10 mM-well below industrially relevant concentrations (50-200 mM)-and substrate inhibition at higher concentrations was not tested. Second, only glucosemediated cofactor regeneration was evaluated in depth; coupling with formate dehydrogenase or an electrochemical system could shift the ranking among biocatalysts. Third, the E. coli KRED construct was not codon-optimised, and its expression level may not represent the theoretical maximum. Optimising expression could improve its ee, which was the weakest aspect of this system [8,9] .
Conclusion
Three whole-cell biocatalysts were compared for asymmetric ketone reduction across six prochiral substrates. L. brevis LBADH provided the best balance of enantioselectivity (median 84.7% ee), conversion (89.2%), and batch-to-batch reproducibility (CV 3.8%), earning the highest useful-yield score of 75.5. S. cerevisiae remains attractive for aryl-methyl ketones where ee exceeds 95%, but its performance is substrate-dependent. E. coli KRED offers high conversion yet suffers from competing reductases that limit ee; host engineering could address this weakness. All systems operated under mild, aqueous, metalfree conditions, underscoring the sustainability advantage of biocatalytic over chemical asymmetric reduction. Future work should test higher substrate loadings and evaluate continuous-flow biotransformations to assess industrial scalability.
References
17 in the original paper- Sheldon RA, Woodley JM. Role of biocatalysis in sustainable chemistry. Chem Rev. 2018;118(2):801838.
- Hollmann F, Arends IWCE, Holtmann D. Enzymatic reductions for the chemist. Green Chem. 2011;13(9):2285-2314.
- de Wildeman SMA, Sonke T, Schoemaker HE, May O. Biocatalytic reductions: from lab curiosity to first choice. Acc Chem Res. 2007;40(12):1260-1266.
- Wachtmeister J, Rother D. Recent advances in whole cell biocatalysis techniques bridging from investigative to industrial scale. Curr Opin Biotechnol. 2016;42:169177.
- Csuk R, Glänzer BI. Baker's yeast mediated transformations in organic chemistry. Chem Rev. 1991;91(1):49-97.
- Hummel W. Large-scale applications of NAD(P)- dependent oxidoreductases. Appl Microbiol Biotechnol. 1999;53(2):135-140.
- Schroer K, Mackfeld U, Tan I, Wandrey C, Heuser F, Bringer-Meyer S, et al. Continuous asymmetric ketone reduction processes with recombinant Escherichia coli. J Biotechnol. 2007;132(4):438-444.
- Müller M. Chemoenzymatic synthesis of building blocks for statin side chains. Angew Chem Int Ed. 2005;44(3):362-365.
- Gröger H, Hummel W, Buchholz S, Drauz K, Van Nguyen T, Weberskirch R, et al. Practical asymmetric enzymatic reduction through discovery of a dehydrogenase-compatible biphasic reaction media. Org Lett. 2003;5(2):173-176.
- Graham N, Webb A. Internal laboratory records. Great Lakes University, Chicago; 2023.
- Nakamura K, Yamanaka R, Matsuda T, Harada T. Recent developments in asymmetric reduction of ketones with biocatalysts. Tetrahedron Asymmetry. 2003;14(18):2659-2681.
- Goldberg K, Schroer K, Lütz S, Liese A. Biocatalytic ketone reduction-a powerful tool for the production of chiral alcohols. Appl Microbiol Biotechnol. 2007;76(2):249-255.
- Zhu D, Hua L. Biocatalytic asymmetric reductions of ketones by using whole cells of Rhodococcus species. J Org Chem. 2006;71(25):9484-9486.
- Kratzer R, Wilson DK, Nidetzky B. Catalytic mechanism and substrate selectivity of aldo-keto reductases: insights from structure-function studies of Candida tenuis xylose reductase. IUBMB Life. 2006;58(9):499-507.
- Moore JC, Pollard DJ, Kosjek B, Devine PN. Advances in the enzymatic reduction of ketones. Acc Chem Res. 2007;40(12):1412-1419.
- Huisman GW, Liang J, Krebber A. Practical chiral alcohol manufacture using ketoreductases. Curr Opin Chem Biol. 2010;14(2):122-129.
- Ni Y, Xu JH. Biocatalytic ketone reduction: a green and efficient access to enantiopure alcohols. Biotechnol Adv. 2012;30(6):1279-1288.