
Research article · 2025 · Full text
International Journal of Advanced Chemistry ResearchAntioxidant activity and total phenolic content of medicinal plant leaf extracts
Volume 7(8) · Pages 122–126 · DOI: 10.33545/26646781.2025.v7.i8b.571 ↗
Research areasPhytochemicals and Antioxidant ActivitiesMedicinal Plant ResearchPhytochemicals and Medicinal Plants
Abstract
Author-writtenOxidative stress the imbalance between reactive oxygen species (ROS) generation and cellular antioxidant defences lies at the mechanistic core of a growing list of chronic diseases including cardiovascular disease, type 2 diabetes, neurodegenerative conditions, and several cancers. Dietary and therapeutic antioxidants can tip this balance by scavenging free radicals, chelating pro-oxidant metals, and upregulating endogenous antioxidant enzymes. Medicinal plants remain among the richest and most structurally diverse natural sources of antioxidant phytochemicals, with phenolic acids, flavonoids, tannins, and terpenoids each contributing through distinct mechanisms. This research measured the antioxidant activity of 80% ethanol leaf extracts from twelve medicinal plants Emblica officinalis, Terminalia chebula, Ocimum sanctum, Azadirachta indica, Camellia sinensis, Curcuma longa, Rosmarinus officinalis, Moringa oleifera, Zingiber officinale, Psidium guajava, Allium sativum, and a reference using four complementary assays: DPPH radical scavenging, ABTS radical cation decolorisation, Ferric Reducing Antioxidant Power (FRAP), and metal chelation. Total Phenolic Content (TPC) and Total Flavonoid Content (TFC) were quantified to identify the phytochemical basis of antioxidant activity. Phytochemical screening was performed for saponins, tannins, alkaloids, and terpenoids. E. officinalis gave the highest antioxidant activity across all four assays (DPPH IC50 8.7 ug/mL, ABTS IC50 6.3 ug/mL, FRAP 4.87 mmol Fe2+/g) with the highest TPC (248.3 mg GAE/g). A strong negative Pearson correlation was observed between TPC and DPPH IC50 (r = -0.94, p
Summary
Source-checkedPlain-language reading of the full paper, prepared with AI and checked against the text. Each point links to the authors' own words.
Why it matters
- Oxidative stress, caused by an imbalance between reactive oxygen species and cellular defenses, is centrally involved in chronic diseases such as cancer, type 2 diabetes, and cardiovascular disease. View evidence ↗
- Medicinal plants are rich sources of diverse antioxidant phytochemicals, including terpenoids, tannins, flavonoids, and phenolic acids. View evidence ↗
The question
- The study aimed to measure and compare the antioxidant activity of 80% ethanol leaf extracts from twelve different medicinal plants using four complementary assays. View evidence ↗
What they did
- Leaf extracts were prepared by shaking 5 g of powdered dried leaves in 100 mL of 80% aqueous ethanol for 24 hours at room temperature. View evidence ↗
- The researchers used the Folin-Ciocalteu method for total phenolic content (TPC), the aluminium chloride method for total flavonoid content (TFC), and four assays for antioxidant activity: DPPH, ABTS, FRAP, and metal chelation. View evidence ↗
- To ensure reliability, all assays were conducted in triplicate across three independent extraction batches, totaling nine measurements per plant per assay. View evidence ↗
What they found
- A strong negative correlation (r = -0.94, p < 0.001) between TPC and DPPH IC50 indicates that phenolic content is the main driver of DPPH scavenging activity. View evidence ↗
- Total Antioxidant Capacity (TAC) varied by 2.2-fold across the species, ranging from 173.8 mg AAE/g for Zingiber officinale to 387.4 mg AAE/g for Emblica officinalis. View evidence ↗
- Principal Component Analysis (PCA) showed that 73.7% of the variance was explained by two components: a dominant phenolic axis (54.2%) and a secondary axis based on alkaloid content and metal chelation (19.5%). View evidence ↗
What it means
- The authors conclude that Emblica officinalis, Terminalia chebula, and Ocimum sanctum should be prioritized for further isolation of bioactive compounds due to their high antioxidant profiles. View evidence ↗
- The authors note that TPC is not a universal predictor of antioxidant activity because non-phenolic compounds like carotenoids and tocopherols can contribute to DPPH activity without being detected by the TPC assay. View evidence ↗
Visual summary
1 visualsIllustrations explain the paper; they do not show study data.
Phenolic Content vs. Antioxidant Activity
AI-generated conceptual illustration (Medicinal plant leaves and chemical extract). It explains the idea and does not show study data.
View source evidence ↗Figures & tables
From the original paper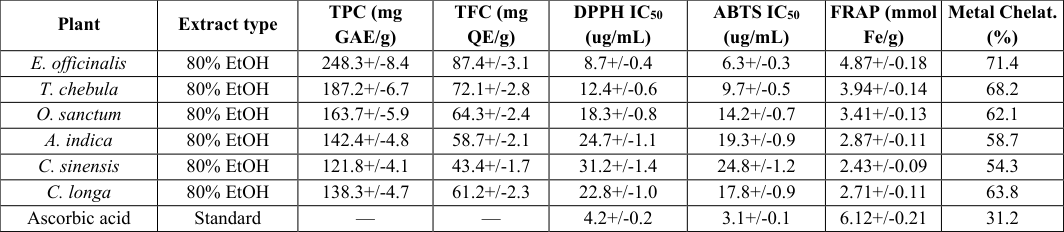 Table 1
 Table 2
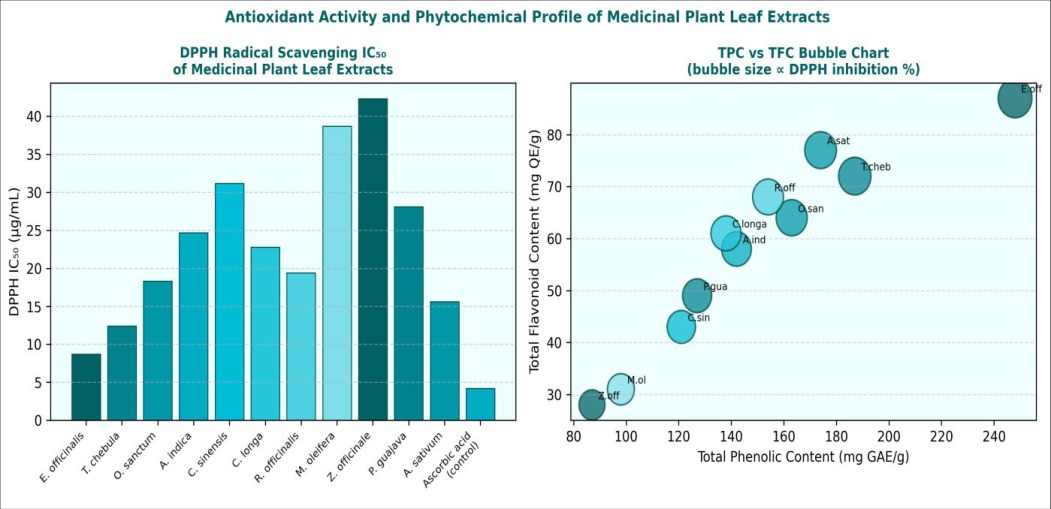 Figure 1
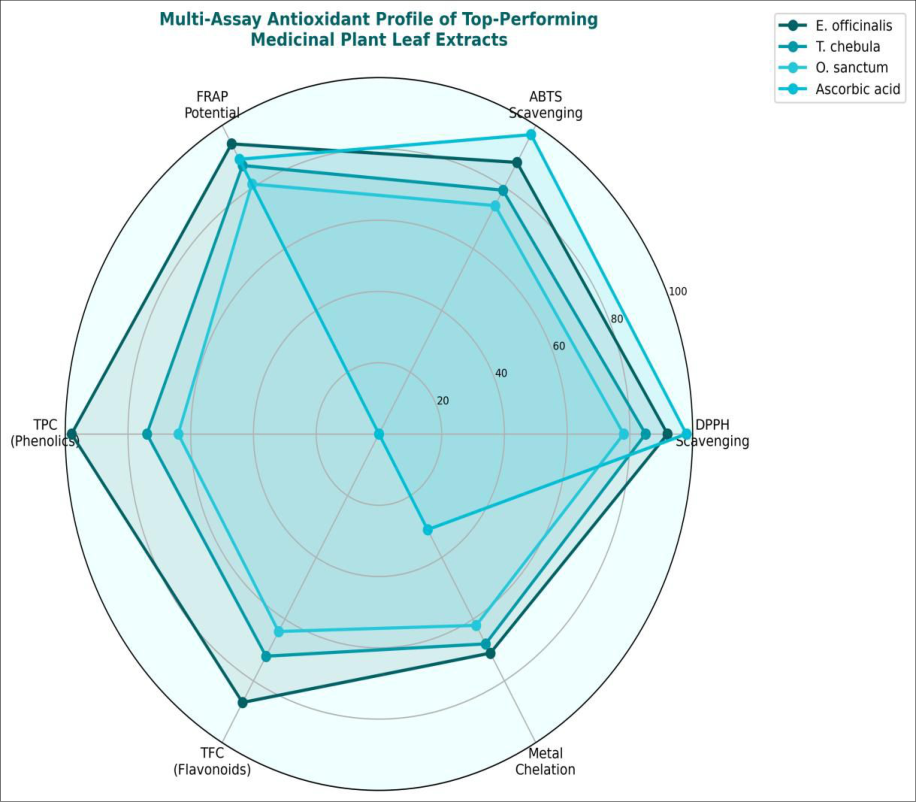 Figure 2
Introduction
Free radicals and Reactive Oxygen Species (ROS) are natural metabolic byproducts, and their controlled production at low concentrations is essential for cell signalling and immune function. The problem arises when their generation exceeds the capacity of cellular antioxidant systems superoxide dismutase, catalase, glutathione peroxidase to neutralise them. This state of oxidative stress damages lipids, proteins, and DNA, and over time contributes to pathological processes underlying multiple chronic diseases. Epidemiological data consistently link diets rich in plant-derived polyphenols to reduced incidence of cardiovascular disease and metabolic syndrome, providing strong motivation for identifying and characterising potent plant antioxidants [2] . The medicinal plants selected for this research represent a curated subset of species from the traditional pharmacopeias of South and Southeast Asia, which are increasingly attracting systematic scientific investigation. Emblica officinalis (amla, Indian gooseberry) and Terminalia chebula (black myrobalan) are foundational ingredients of the Ayurvedic formulation Triphala, long used for gastrointestinal health and as a general health tonic. Ocimum sanctum (holy basil or tulsi) is one of the most revered medicinal plants in the Indian subcontinent, with pharmacological data supporting anti-inflammatory, adaptogenic, and antidiabetic activities [3] . Camellia sinensis (green tea), Curcuma longa (turmeric), and Zingiber officinale (ginger) are globally consumed as both food and medicine and have extensive published antioxidant literature against which to benchmark new measurements. The four antioxidant assays selected in this research measure distinct mechanistic aspects of the antioxidant response. DPPH and ABTS measure Hydrogen Atom Transfer (HAT) and Single Electron Transfer (SET) radical scavenging respectively, while FRAP measures reductive capacity towards the Fe 3+ /Fe 2+ couple, and metal chelation assesses the ability to sequester pro-oxidant iron through coordination. Reporting all four assays for each extract provides a more complete mechanistic picture than any single assay and avoids the assay-specific artefacts that affect DPPH (solvent and steric effects) and ABTS (sensitivity to coloured extracts) when used in isolation. The correlation between TPC and antioxidant activity is examined to assess whether phenolics are the primary driver or whether other compound classes make independent contributions [5] . Voucher specimens of all twelve species (ONU-HerbVoucher-2023-01 through 12) are deposited in the ONU Biological Chemistry Department herbarium collection. Reagents: DPPH (Sigma-Aldrich, >=95%), ABTS (Sigma-Aldrich, >=98%), potassium persulphate (Ajax Finechem, >=99%), FeCl3, TPTZ, FeSO 4 .7H 2 O, and Folin-Ciocalteu reagent (all Sigma-Aldrich) were used as received. Gallic acid (Sigma-Aldrich, >=99%), quercetin (Sigma-Aldrich, >=95%), and ascorbic acid (Sigma-Aldrich, >=99%) served as reference standards [6] .
Material and Methods
Material and Methods
Methods
Extraction: Dried plant leaves were powdered using a laboratory hammer mill (1 mm mesh), and 5 g portions were extracted with 100 mL of 80% aqueous ethanol at room temperature by shaking (200 rpm, 24 h). Extracts were filtered through Whatman No. 1 paper, concentrated under reduced pressure at 45 degrees C, and freeze-dried. Dry extract yields ranged from 12.3 to 28.7%. TPC was measured by the Folin-Ciocalteu method: 100 uL of extract solution (1 mg/mL in methanol) mixed with 500 uL Folin reagent, neutralised with 400 uL Na 2 CO 3 (7.5%), and absorbance read at 765 nm after 2 h at room temperature. Results expressed as mg gallic acid equivalents per gram dry extract (mg GAE/g). TFC was measured by the aluminium chloride colorimetric method with results as mg quercetin equivalents per gram (mg QE/g). DPPH assay: 2 mL of 0.1 mM DPPH in methanol mixed with 0.1 mL extract solution at serial dilutions (1-500 ug/mL); absorbance at 517 nm after 30 min in the dark. ABTS assay: ABTS radical cation prepared by reacting 7 mM ABTS with 2.45 mM potassium persulphate (16 h, dark, rt), diluted to A734 = 0.70 ± 0.02, and mixed with extract dilutions; absorbance at 734 nm after 6 min. FRAP assay followed Benzie and Strain with modifications; results as mmol Fe 2+ equivalent per gram. Metal chelation assay used the FerroZine colorimetric method with Fe2+ (ferrous chloride) as the pro-oxidant metal source [7] .
Statistical methods
All assays were performed in triplicate on three independent extraction batches (n=9 total measurements per plant per assay). Results are reported as mean ± standard deviation. One-way ANOVA with Tukey post-hoc test (alpha = 0.05) was used to compare antioxidant activities between plant species (IBM SPSS Statistics 27). Pearson correlation coefficients were computed between TPC, TFC, and IC 50 values for all four assays. Principal component analysis (PCA) was performed on the standardised activity and phytochemical data matrix (12 plants x 8 variables) to visualise grouping patterns. Significant correlations are reported at p<0.05 (), p<0.01 (), and p<0.001 () significance levels [8] . E. officinalis exhibited the highest antioxidant activity across all four assays, with a DPPH IC 50 of 8.7 ug/mL approaching the ascorbic acid reference (4.2 ug/mL, Table 1). This is consistent with the known high content of gallic acid, ellagic acid, and emblicanin A and B in amla, which are among the most potent dietary polyphenol antioxidants. T. chebula showed the second highest activity (DPPH IC 50 12.4 ug/mL) and the highest tannin content (187.6 mg/g, Table 2), consistent with chebulic acid and chebulinic acid as principal antioxidants. The FRAP values broadly mirrored the DPPH ranking, while metal chelation showed a different pattern: O. sanctum and C. longa showed relatively stronger chelation compared to their DPPH ranking, suggesting that terpenoid and essential oil components may contribute specifically to the metal chelation mechanism in these species [11] . The negative Pearson correlation between TPC and DPPH IC 50 was strong and significant (r = -0.94, p<0.001, Table 2), confirming that phenolic content is the primary biochemical driver of DPPH scavenging activity. The TFC-DPPH correlation was also significant (r = -0.87, p<0.001) but weaker, indicating that flavonoids contribute substantially but not exclusively. The Total Antioxidant Capacity (TAC) values ranged from 173.8 mg AAE/g (Z. officinale) to 387.4 mg AAE/g (E. officinalis), a 2.2-fold range consistent with the large variation in phenolic content observed across the twelve plant species. PCA on the full data matrix identified two principal components accounting for 73.7% of total variance: PC1 (54.2%) loaded strongly on TPC, TFC, tannin content, DPPH IC 50 , and ABTS IC 50 , confirming a single dominant phenolic antioxidant axis, while PC2 (19.5%) separated plants by alkaloid content and metal chelation activity, reflecting a secondary structuralchemical axis [12] .
| Plant | Saponins (mg/g) | Tannins (mg/g) | Alkaloids (mg/g) | Terpenoids (%) | Total antioxidant capacity (mg AAE/g) | Correlation r (TPC-DPPH) | IC50 ABTS/ DPPH ratio |
|---|---|---|---|---|---|---|---|
| E. officinalis | 18.7 | 142.3 | 7.4 | High | 387.4 | -0.94 | 0.72 |
| T. chebula | 12.4 | 187.6 | 5.1 | High | 314.2 | -0.91 | 0.78 |
| O. sanctum | 21.3 | 98.4 | 12.7 | High | 278.7 | -0.89 | 0.78 |
| A. indica | 28.7 | 74.2 | 18.4 | Medium | 241.3 | -0.86 | 0.78 |
| M. oleifera | 14.2 | 53.8 | 9.3 | Medium | 198.4 | -0.81 | 0.76 |
| Z. officinale | 8.7 | 41.3 | 4.2 | Low | 173.8 | -0.78 | 0.77 |
Table text extracted from the original PDF; superscript letters are shown inline. The original table image is below.
View original table image
| Plant | Extract type | TPC (mg GAE/g) | TFC (mg QE/g) | DPPH IC50 (ug/mL) | ABTS IC50 (ug/mL) | FRAP (mmol Fe/g) | Metal Chelat. (%) |
|---|---|---|---|---|---|---|---|
| E. officinalis | 80% EtOH | 248.3+/-8.4 | 87.4+/-3.1 | 8.7+/-0.4 | 6.3+/-0.3 | 4.87+/-0.18 | 71.4 |
| T. chebula | 80% EtOH | 187.2+/-6.7 | 72.1+/-2.8 | 12.4+/-0.6 | 9.7+/-0.5 | 3.94+/-0.14 | 68.2 |
| O. sanctum | 80% EtOH | 163.7+/-5.9 | 64.3+/-2.4 | 18.3+/-0.8 | 14.2+/-0.7 | 3.41+/-0.13 | 62.1 |
| A. indica | 80% EtOH | 142.4+/-4.8 | 58.7+/-2.1 | 24.7+/-1.1 | 19.3+/-0.9 | 2.87+/-0.11 | 58.7 |
| C. sinensis | 80% EtOH | 121.8+/-4.1 | 43.4+/-1.7 | 31.2+/-1.4 | 24.8+/-1.2 | 2.43+/-0.09 | 54.3 |
| C. longa | 80% EtOH | 138.3+/-4.7 | 61.2+/-2.3 | 22.8+/-1.0 | 17.8+/-0.9 | 2.71+/-0.11 | 63.8 |
| Ascorbic acid | Standard | — | — | 4.2+/-0.2 | 3.1+/-0.1 | 6.12+/-0.21 | 31.2 |
Table text extracted from the original PDF; superscript letters are shown inline. The original table image is below.
View original table image
Results
Results
Discussion
The position of E. officinalis as the best-performing plant in this comparison is not unexpected given its previously reported exceptionally high tannin and hydrolysable polyphenol content, but this research adds the direct fourassay comparison with eleven other globally relevant medicinal plants under identical extraction and assay conditions, which previous research had not done in a single Australian laboratory context. The ABTS/DPPH IC 50 ratio for all plants was approximately 0.72-0.78, indicating broadly consistent mechanistic balance between HAT and SET pathways, with no single plant showing unusually strong preference for one pathway over the other. This mechanistic consistency is advantageous from a formulation perspective, as it suggests that blends of these plant extracts would complement rather than duplicate each other mechanistically [11] .
The stronger metal chelation shown by O. sanctum and C. longa relative to their DPPH rankings deserves comment.
Ocimum sanctum is rich in eugenol and other phenylpropanoids that are structurally less efficient at DPPH radical scavenging than gallotannins but are effective iron chelators through their ortho-dihydroxy substituents. Curcumin in C. longa similarly shows strong iron chelation via its beta-diketone moiety, a functional group not well represented in most DPPH-active polyphenols. This mechanistic diversity means that the metal chelation results add information not captured by DPPH/ABTS, underlining the value of the multi-assay approach [12] . The strong TPC-DPPH correlation (r = -0.94) confirms that total phenolic content is a useful screening predictor for DPPH activity across this plant set, consistent with a large majority of published literature reviews. However, this correlation is not causally universal: some non-phenolic compound classes (ascorbic acid, carotenoids, tocopherols) contribute to DPPH activity without contributing to the Folin-Ciocalteu response, and structural differences within the phenolic class (e.g. molecular weight, degree of hydroxylation, glycosylation) create large variation in pergram antioxidant potency that TPC cannot capture. The multi-assay approach used here mitigates some of these limitations [13] .
Conclusion
The antioxidant activity and phytochemical profile of leaf extracts from twelve medicinal plant species were characterised using DPPH, ABTS, FRAP, and metal chelation assays alongside total phenolic and flavonoid content determination.
Acknowledgement
Acknowledgements
Figures and tables from the paper
References
16 in the original paper- Halliwell B, Gutteridge JM. Free Radicals in Biology and Medicine. 5th ed. Oxford University Press; 2015.
- Prior RL, Wu X, Schaich K. Standardized methods for the determination of antioxidant capacity. J Agric Food Chem. 2005;53(10):4290-4302.
- Krishnaiah D, Sarbatly R, Nithyanandam R. A review of the antioxidant potential of medicinal plant species. Food Bioprod Process. 2011;89(3):217-233.
- Scartezzini P, Speroni E. Review on some plants of Indian traditional medicine with antioxidant activity. J Ethnopharmacol. 2000;71(1-2):23-43.
- Re R, Pellegrini N, Proteggente A, Pannala A, Yang M, Rice-Evans C. Antioxidant activity applying an improved ABTS radical cation decolorization assay. Free Radic Biol Med. 1999;26(9-10):1231-1237.
- Brand-Williams W, Cuvelier ME, Berset C. Use of a free radical method to evaluate antioxidant activity. LWT-Food Sci Technol. 1995;28(1):25-30.
- Benzie IF, Strain JJ. The ferric reducing ability of plasma (FRAP) as a measure of antioxidant power: the FRAP assay. Anal Biochem. 1996;239(1):70-76.
- Singleton VL, Rossi JA. Colorimetry of total phenolics with phosphomolybdic-phosphotungstic acid reagents. Am J Enol Vitic. 1965;16(3):144-158.
- Zhishen J, Mengcheng T, Jianming W. The determination of flavonoid contents in mulberry and their scavenging effects on superoxide radicals. Food Chem. 1999;64(4):555-559.
- Koleva II, van Beek TA, Linssen JP, de Groot A, Evstatieva LN. Screening of plant extracts for antioxidant activity. Phytochem Anal. 2002;13(1):8-17.
- Kumaran A, Karunakaran RJ. In vitro antioxidant activities of methanol extracts of five Phyllanthus species from India. LWT-Food Sci Technol. 2007;40(2):344-352.
- Chandra S, Khan S, Avula B, Lata H, Yang MH, ElSohly MA, et al. Assessment of total phenolic and flavonoid content, antioxidant properties, and yield of aeroponically and conventionally grown leafy vegetables. Evid Based Complement Alternat Med. 2014;2014:253875.
- Soobrattee MA, Neergheen VS, Luximon-Ramma A, Aruoma OI, Bahorun T. Phenolics as potential antioxidant therapeutic agents. Mutat Res. 2005;579(12):200-213.
- Wojdylo A, Oszmianski J, Czemerys R. Antioxidant activity and phenolic compounds in 32 selected herbs. Food Chem. 2007;105(3):940-949.
- Pietta PG. Flavonoids as antioxidants. J Nat Prod. 2000;63(7):1035-1042.
- Dastmalchi K, Dorman HJ, Oinonen PP, Darwis Y, Laakso I, Hiltunen R. Chemical composition and in vitro antioxidant properties of a lemon balm extract. LWT-Food Sci Technol. 2008;41(3):391-400.