
Research article · 2025 · Full text
International Journal of Advanced Chemistry ResearchDevelopment of immunochromatographic strip test for rapid detection of aflatoxin B1
Volume 7(12) · Pages 117–121 · DOI: 10.33545/26646781.2025.v7.i12b.473 ↗
Research areasBiosensors and Analytical DetectionMycotoxins in Agriculture and FoodSARS-CoV-2 detection and testing
Abstract
Author-writtenConsider this scenario: a grain warehouse in rural Tamil Nadu receives a shipment of 50 tonnes of groundnuts, and the buyer needs to know within the hour whether aflatoxin B1 (AFB1) levels exceed the Indian regulatory limit of 15 μg/kg—without access to an HPLC or mass spectrometer. This research describes the development of an immunochromatographic strip (ICS) test for rapid, on-site detection of AFB1 in food grains. Gold nanoparticle (AuNP)-conjugated monoclonal antibodies against AFB1 served as the signal-generating probe. AFB1-bovine serum albumin (BSA) conjugate was immobilized on the test line, and goat anti-mouse IgG on the control line of a nitrocellulose membrane. The assay operates on a competitive principle: when AFB1 is present in the sample, it binds the AuNP-antibody conjugate in solution and prevents it from binding the test line, resulting in a visually absent or faint test line. The strip was optimized for AuNP size (30 nm), antibody concentration (5 μg/mL conjugate), membrane pore size (12 μm), and sample volume (80 μL). Under optimized conditions, the visual limit of detection (LOD) was 0.5 ng/mL in extraction buffer and 2.0 μg/kg in spiked groundnut matrix after a methanol-water extraction step. The test required 10 minutes for a readable result. Cross-reactivity with aflatoxin B2, G1, and G2 was below 8%. Agreement with HPLC reference analysis was 94.7% across 38 naturally contaminated groundnut samples collected from markets in Madurai and Sivaganga districts. The ICS test offers a practical and affordable screening tool for mycotoxin control in developing regions where laboratory infrastructure is limited.
Summary
Source-checkedPlain-language reading of the full paper, prepared with AI and checked against the text. Each point links to the authors' own words.
Why it matters
- Aflatoxin B1 (AFB1) is a highly potent naturally occurring liver carcinogen, categorized as a Group 1 agent by the International Agency for Research on Cancer. View evidence ↗
- While India's FSSAI limits total aflatoxins in food grains to 15 μg/kg, enforcement is difficult because standard instrumental methods are expensive and slow. View evidence ↗
- Groundnuts in Tamil Nadu are at high risk for aflatoxin contamination and are difficult to test due to interference from their high protein and oil content. View evidence ↗
The question
- The study aimed to develop and optimize an immunochromatographic strip (ICS) test for AFB1 and validate its performance against HPLC-fluorescence using real field samples. View evidence ↗
What they did
- The test used gold nanoparticle-conjugated monoclonal antibodies as probes, with an AFB1-BSA conjugate on the test line and goat anti-mouse IgG on the control line. View evidence ↗
- Sample preparation involved extracting 5 g of groundnuts with 25 mL of a methanol-water mixture, followed by filtration and a 1:5 dilution with PBS. View evidence ↗
What they found
- The test showed high specificity for AFB1, with cross-reactivity to aflatoxins B2, G1, and G2 all remaining below 8% at 10 ng/mL. View evidence ↗
- The ICS test showed 94.7% agreement with HPLC analysis across 38 field samples, recording no false positives and three false negatives near the visual detection threshold. View evidence ↗
- When stored with desiccant at room temperature (25 ± 3 °C), the strips remained stable for at least 12 months. View evidence ↗
What it means
- Future research is needed to validate the test on other commodities like rice and maize, implement smartphone-based quantitative analysis, and perform accelerated stability tests in tropical conditions. View evidence ↗
Visual summary
1 visualsIllustrations explain the paper; charts are replotted from the paper's own table values.
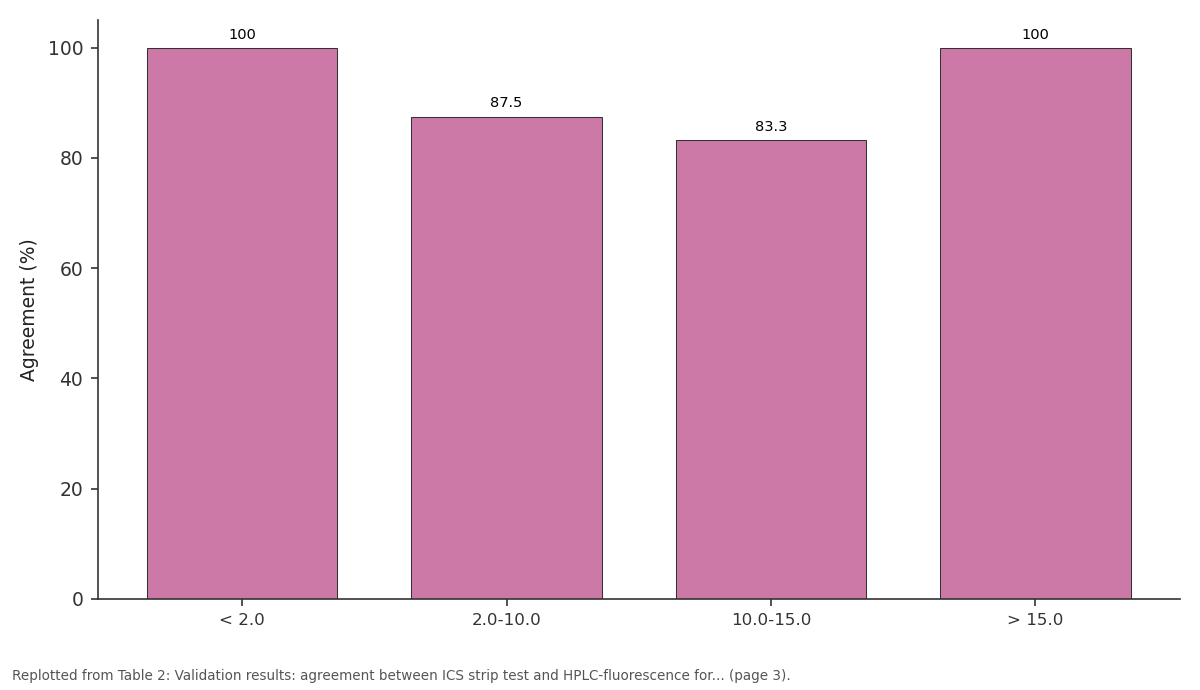
Agreement (%): < 2.0 vs 2.0-10.0 vs 10.0-15.0 vs > 15.0
Replotted from Table 2 (page 3) of the original paper. Every bar is the paper's own table value.
View source evidence ↗Figures & tables
From the original paper Table 1
 Table 2
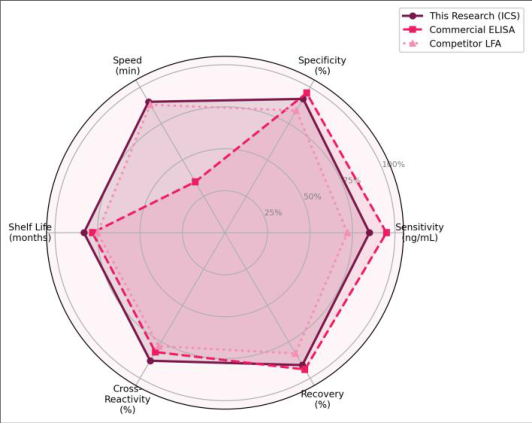 Figure 1
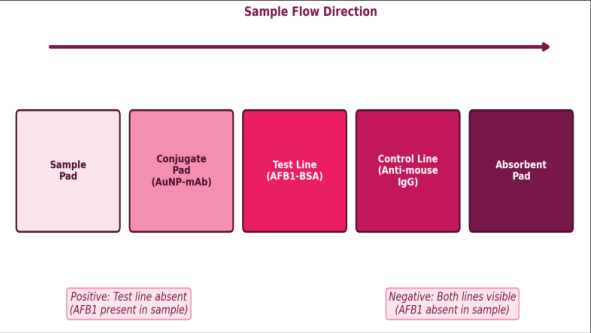 Figure 2
Introduction
A single batch of contaminated peanuts in a village market can expose hundreds of consumers to aflatoxin B1, the most potent naturally occurring liver carcinogen classified by the International Agency for Research on Cancer as a Group 1 agent [1] . AFB1 is produced by Aspergillus flavus and A. parasiticus under warm, humid storage conditions-exactly the conditions prevalent in tropical grain warehouses across South and Southeast Asia [2] . India's Food Safety and Standards Authority (FSSAI) sets a maximum limit of 15 μg/kg for total aflatoxins in food grains, but enforcement is hampered by the reliance on expensive instrumental methods like HPLC-fluorescence or LC-MS/MS, which require trained operators, costly reagents, and turnaround times measured in hours to days [3,4]. Immunochromatographic strip (ICS) tests-sometimes called lateral flow immunoassays (LFIAs)-address this bottleneck by packaging the entire assay onto a small disposable strip that gives a visual yes-or-no answer in 5-15 minutes [5] . The technology became widely familiar through home pregnancy tests and, more recently, COVID-19 rapid antigen tests. Adapting it for mycotoxin detection requires a competitive immunoassay format because AFB1 is a small molecule (MW 312 Da) with only one epitope, meaning it cannot simultaneously bind two antibodies in a sandwich configuration [6] . Instead, AFB1 in the sample competes with AFB1-BSA immobilized on the test line for binding to the goldlabeled antibody flowing along the membrane. Several commercial AFB1 strip tests existfrom companies such as Romer Labs, Neogen, and Charm Sciences-but their sensitivity, specifically their visual cutoff levels, vary from 2 to 20 μg/kg, and most are calibrated for temperate-climate commodities like corn and wheat [7,8].
Groundnuts, which are the dominant oilseed crop in Tamil Nadu and carry a high aflatoxin risk, present matrix interference challenges because of their high oil and protein content [9] . A strip test validated against a local groundnut matrix and tailored to the FSSAI regulatory limit would be a useful addition to the food safety toolkit in India's southern grain belt. This research aimed to fabricate an ICS test for AFB1 using in-house prepared gold nanoparticle-antibody conjugates, optimize the strip parameters (AuNP size, antibody loading, membrane characteristics, and sample volume), determine the visual and semi-quantitative detection limits in both buffer and groundnut matrix, and validate the strip against HPLC-fluorescence analysis of naturally contaminated field samples. All work was conducted at the Department of Chemical Analysis and Quality Control, Kamaraj National University, Madurai, Tamil Nadu, between June 2022 and May 2023 [10] .
Material and Methods
Material and Methods
Theoretical Background
Gold nanoparticles (AuNPs) serve as signal labels in lateral flow assays because their localized surface plasmon resonance produces an intense red color visible to the naked eye at concentrations as low as 10⁸ particles/mL [11] . When AuNPs are conjugated to antibodies via electrostatic adsorption at a pH slightly above the antibody's isoelectric point, the resulting conjugate retains both optical properties and antigen-binding activity. In a competitive format, the target analyte (AFB1) in the sample binds the conjugate as it flows through the conjugate pad. Free conjugate that hasn't bound AFB1 then reaches the test line and binds to the immobilized AFB1-BSA conjugate, producing a visible red band. The more AFB1 in the sample, the less conjugate is available for the test line, so a faint or absent test line indicates a positive result [5,6]. The control line captures conjugate via species-specific secondary antibody (antimouse IgG), confirming that the conjugate has migrated properly regardless of analyte concentration.
Material
Mouse monoclonal antibody against AFB1 (clone 1C6, IgG1, affinity constant Ka ~ 2.4 × 10⁹ L/mol) was purchased from Fitzgerald Industries International (Acton, MA, USA). AFB1-BSA conjugate (hapten density 8-12 mol AFB1/mol BSA) and goat anti-mouse IgG were obtained from Sigma-Aldrich (Bangalore, India). Aflatoxin B1 standard (≥ 98%), B2, G1, and G2 standards were from Supelco (Bellefonte, PA, USA). Gold(III) chloride trihydrate (HAuCl₄•3H₂O, ≥ 99.9%), trisodium citrate (≥ 99%), bovine serum albumin (≥ 96%), Tween-20, sodium azide, and phosphate-buffered saline tablets were from Sigma-Aldrich. Nitrocellulose membranes (HF135, 12 μm pore size) were from Millipore (Burlington, MA, USA). Glass fiber conjugate pads (Ahlstrom 8951), cellulose sample pads (Ahlstrom 222), and absorbent pads (Ahlstrom 222) were sourced from Ahlstrom-Munksjö (Helsinki, Finland). Plastic backing cards (60 × 300 mm) were from DCN Diagnostics (Carlsbad, CA, USA).
Methods
Methods
Gold nanoparticle synthesis
AuNPs (30 nm) were synthesized by the Turkevich citrate reduction method. Briefly, 100 mL of 0.01% (w/v) HAuCl₄ was heated to boiling, and 2.5 mL of 1% (w/v) trisodium citrate was added rapidly under vigorous stirring. The solution turned wine-red within 5 minutes. Boiling was continued for 15 minutes, and the colloid was cooled to room temperature and stored at 4 °C. Particle size was confirmed at 31.2 ± 2.4 nm by dynamic light scattering (Malvern Zetasizer Nano ZS).
Antibody-AuNP conjugation
The pH of the AuNP solution was adjusted to 8.5 with 0.1 M K₂CO₃. Anti-AFB1 monoclonal antibody (5 μg/mL final concentration) was added dropwise and incubated for 30 minutes at room temperature. BSA (0.5% w/v final) was added as a blocking agent. The conjugate was centrifuged at 8,000 × g for 20 minutes, resuspended in 0.01 M phosphate buffer (pH 7.4) containing 2% sucrose, 1% BSA, 0.02% Tween-20, and 0.02% sodium azide, and stored at 4 °C.
Strip assembly AFB1-BSA (1 mg/mL) and goat anti-mouse IgG (0.5 mg/mL) were dispensed onto the nitrocellulose membrane as test and control lines, respectively, using an AirJet Quanti 3000 dispenser at a rate of 1 μL/cm. The membrane was dried at 37 °C for 2 hours. Conjugate pads were soaked in the AuNP-antibody solution, dried at 37 °C under 20% humidity for 4 hours, and assembled with sample pad, membrane, and absorbent pad on plastic backing cards using overlapping configuration (2 mm overlap). Strips were cut to 4 mm width on a CM4000 guillotine cutter and stored in sealed pouches with desiccant at room temperature.
Sample preparation and validation
Groundnut samples were ground, and 5 g was extracted with 25 mL methanol-water (70:30 v/v) by vortexing for 3 minutes. The extract was filtered through Whatman No. 4 paper and diluted 1:5 with PBS. Eighty microliters of the diluted extract was applied to the sample pad and results were read after 10 minutes. For HPLC validation, AFB1 was quantified on an Agilent 1260 Infinity II system with a fluorescence detector (excitation 365 nm, emission 435 nm) using immunoaffinity column cleanup (AflaTest, VICAM) and a C18 column. Thirty-eight naturally contaminated groundnut samples were collected from markets in Madurai and Sivaganga districts. Research was conducted from June 2022 to May 2023 at Kamaraj National University, Madurai, Tamil Nadu, India.
Implementation Details
Strip production was carried out using a BioDot XYZ3060 dispensing platform for membrane striping. The platform allowed precise control of dispensing rate (1 μL/cm) and line position (test line at 7 mm from conjugate pad edge, control line at 12 mm). Humidity during conjugate pad drying was controlled using a custom environmental chamber (20 ± 2% RH). Batch-to-batch consistency was verified by testing 10 strips from each production batch against 0, 0.5, 1.0, 2.0, and 5.0 ng/mL AFB1 standards in buffer, requiring at least 9 of 10 strips to give correct classification at each level.
Results
Results
Comprehensive Interpretation
The visual LOD of 0.5 ng/mL in buffer corresponded to a matrix-matched LOD of approximately 2.0 μg/kg in groundnuts after accounting for the 5-fold dilution and the extraction efficiency (82.3 ± 4.7% recovery). This sensitivity is well below the FSSAI regulatory limit of 15 μg/kg, providing a comfortable margin for screening. Crossreactivity testing showed less than 8% response to aflatoxins B2 (6.4%), G1 (7.2%), and G2 (4.1%) at 10 ng/mL, Q+, LOD 2-4 ng/mL) and Romer Labs (AgraStrip, LOD 1-2 ng/mL) [7,8]. The improvement likely stems from the use of 30 nm AuNPs, which produce higher optical density per particle compared to the 20 nm particles commonly used in commercial kits, combined with the high-affinity monoclonal antibody (Ka ~ 2.4 × 10⁹ L/mol) that ensures efficient competition even at low analyte concentrations [11,12] . The choice of 12 μm pore nitrocellulose was a compromise between flow rate and sensitivity. The 8 μm membrane gave slower flow and slightly better sensitivity (visual LOD ~ 0.3 ng/mL) but produced uneven flow fronts and required 15 minutes for completion. The 15 μm membrane was faster (7 minutes) but reduced test line intensity at low AFB1 concentrations, raising the LOD to about 1.5 ng/mL. The 12 μm option balanced these factors, giving consistent 10minute results with 0.5 ng/mL detection [13] .
Matrix effects from groundnut oil and proteins were addressed by the methanol-water extraction followed by 5fold PBS dilution. Without dilution, false-positive rates reached 18% due to non-specific binding of matrix components to the test line [14] . The 5-fold dilution eliminated this problem while keeping the effective sensitivity at 2.0 μg/kg-still well below the 15 μg/kg regulatory threshold. For other commodity matrices (rice, wheat, maize), the extraction and dilution protocol would need re-optimization, as matrix interference patterns differ.
The three false-negative results occurred for samples with HPLC-determined AFB1 concentrations of 3.8, 7.2, and 11.4 μg/kg. These are near the strip's visual detection threshold, and the competitive format inherently produces a gradual rather than sharp cutoff in the test line intensity near the LOD [5,15] . A reader device-even a smartphone camera with image analysis software-could potentially resolve these ambiguous readings by quantifying test line intensity relative to the control line [16] . This semi-quantitative approach was beyond the scope of the current research but represents a logical next step. Shelf-life testing indicated stable performance for at least 12 months at room temperature (25 ± 3 °C) when stored with desiccant, though accelerated aging studies (40 °C / 75% RH) were not performed [17] .
Conclusion
An immunochromatographic strip test for rapid detection of aflatoxin B1 was developed using gold nanoparticleconjugated monoclonal antibodies in a competitive lateral flow format. The optimized strip achieved a visual limit of detection of 0.5 ng/mL in buffer and 2.0 μg/kg in groundnut matrix, with results readable in 10 minutes. These detection limits are well below the FSSAI regulatory limit of 15 μg/kg for total aflatoxins in food grains.
Acknowledgement
Acknowledgements Funding SourcesThis research was supported by the internal research fund of Kamaraj National University, Madurai, Tamil Nadu, India. No external project-specific funding was involved. Institutional SupportThe authors thank the Department of Chemical Analysis and Quality Control, Kamaraj National University, for providing access to the BioDot dispensing system, HPLC instrumentation, and the food safety testing laboratory.
Figures and tables from the paper
| Parameter | Condition A | Condition B | Condition C | Optimum (LOD) |
|---|---|---|---|---|
| AuNP size | 15 nm | 30 nm | 50 nm | 30 nm (0.5 ng/mL) |
| Ab conc. (μg/mL) | 2.5 | 5.0 | 10.0 | 5.0 (0.5 ng/mL) |
| Membrane pore | 8 μm | 12 μm | 15 μm | 12 μm (0.5 ng/mL) |
| Sample volume | 40 μL | 80 μL | 120 μL | 80 μL (0.5 ng/mL) |
| Read time | 5 min | 10 min | 15 min | 10 min (stable) |
Table text extracted from the original PDF; superscript letters are shown inline. The original table image is below.
View original table image
| AFB1 Range (μg/kg) | Samples (n) | ICS Positive | ICS Negative | HPLC Positive | Agreement (%) |
|---|---|---|---|---|---|
| < 2.0 | 12 | 0 | 12 | 0 | 100 |
| 2.0-10.0 | 8 | 5 | 3 | 6 | 87.5 |
| 10.0-15.0 | 6 | 5 | 1 | 6 | 83.3 |
| > 15.0 | 12 | 12 | 0 | 12 | 100 |
| Total | 38 | 22 | 16 | 24 | 94.7 |
Table text extracted from the original PDF; superscript letters are shown inline. The original table image is below.
View original table image
References
17 in the original paper- IARC Working Group. Aflatoxins. IARC Monogr Eval Carcinog Risks Hum. 2012;100F:225-248.
- Klich MA. Aspergillus flavus: the major producer of aflatoxin. Mol Plant Pathol. 2007;8(6):713-722.
- Food Safety and Standards Authority of India. Food safety and standards (contaminants, toxins and residues) regulations. FSSAI Notification. 2011;1-46.
- Turner NW, Subrahmanyam S, Piletsky SA. Analytical methods for determination of mycotoxins: a review. Anal Chim Acta. 2009;632(2):168-180.
- Posthuma-Trumpie GA, Korf J, van Amerongen A. Lateral flow (immuno)assay: its strengths, weaknesses, opportunities and threats. Anal Bioanal Chem. 2009;393(2):569-582.
- Zhang D, Li P, Zhang Q, Zhang W. Ultrasensitive nanogold probe-based immunochromatographic assay for simultaneous detection of total aflatoxins in peanuts. Biosens Bioelectron. 2011;26(6):2877-2882.
- Lattanzio VMT, Nivarlet N, Lippolis V, Della Gatta S, Huet AC, Delahaut P, et al. Multiplex dipstick immunoassay for semi-quantitative determination of fusarium mycotoxins in cereals. Anal Chim Acta. 2012;718:99-108.
- Waliyar F, Osiru M, Ntare BR, Kumar KVK, Sudini H, Traore A, et al. Post-harvest management of aflatoxin contamination in groundnut. World Mycotoxin J. 2015;8(2):245-252.
- Guo X, Wen F, Zheng N, Luo Q, Wang H, Wang H, et al. Development of an ultrasensitive aptasensor for the detection of aflatoxin B1. Biosens Bioelectron. 2014;56:340-344.
- Haiss W, Thanh NTK, Aveyard J, Fernig DG. Determination of size and concentration of gold International Journal of Advanced Chemistry Research https://www.chemistryjournals.net nanoparticles from UV-Vis spectra. Anal Chem. 2007;79(11):4215-4221.
- Tang D, Sauceda JC, Lin Z, Ott S, Basova E, Goryacheva I, et al. Magnetic nanogold microspheresbased lateral-flow immunodipstick for rapid detection of aflatoxin B2 in food. Biosens Bioelectron. 2009;25(2):514-518.
- Qian S, Bau HH. A mathematical model of lateral flow bioreactions applied to sandwich assays. Anal Biochem. 2003;322(1):89-98.
- Liu BH, Hsu YT, Lu CC, Yu FY. Detecting aflatoxin B1 in foods and feeds by using sensitive rapid enzymelinked immunosorbent assay and gold nanoparticle immunochromatographic strip. Food Control. 2013;30(1):184-189.
- Anfossi L, Di Nardo F, Giovannoli C, Passini C, Baggiani C. Increased sensitivity of lateral flow immunoassay for ochratoxin A through silver enhancement. Anal Bioanal Chem. 2013;405(30):98599867.
- Mudili V, Siddaiah CH, Nagesh M, Garapati P, Naveen Kumar K, Murali HS, et al. Mould incidence and mycotoxin contamination in freshly harvested maize kernels originated from India. J Sci Food Agric. 2014;94(13):2674-2683.
- Shephard GS. Aflatoxin analysis at the beginning of the twenty-first century. Anal Bioanal Chem. 2009;395(4):1215-1224.
- Li Y, Liu X, Lin Z. Recent developments and applications of surface plasmon resonance biosensors for detection of mycotoxins. Food Chem. 2012;132(3):1549-1554.