
Research article · 2025 · Full text
International Journal of Advanced Chemistry ResearchDetermination of vitamin C content in fresh and processed fruits by titrimetric method
Volume 7(3) · Pages 180–183 · DOI: 10.33545/26646781.2025.v7.i3c.442 ↗
Research areasFood and Agricultural SciencesVitamin C and Antioxidants ResearchPhytochemicals and Antioxidant Activities
Abstract
Author-writtenEvery nutrition label on a carton of orange juice lists a vitamin C value, but few consumers ask how that number was measured or how much of the original ascorbic acid survived pasteurization and storage. Iodometric titration a method old enough to appear in introductory chemistry textbooks remains one of the simplest and cheapest ways to quantify ascorbic acid in food matrices. This research applied the 2, 6-dichlorophenolindophenol (DCPIP) titrimetric method to twelve fruits in five states: fresh, refrigerated (4°C, 7 days), boiled (100°C, 5 min), freshly juiced, and commercially canned. Guava had the highest fresh vitamin C content at 228.4 mg/100 g, followed by kiwi (93.2), lemon (77.4), and strawberry (58.9). Boiling caused the greatest loss an average 45.9% reduction across all fruits while refrigeration preserved 82-92% of the original content. Titrimetric values correlated strongly with parallel HPLC measurements (R² = 0.97), confirming that the DCPIP method, despite its age, remains fit for purpose in food-quality laboratories with limited instrumentation.
Summary
Source-checkedPlain-language reading of the full paper, prepared with AI and checked against the text. Each point links to the authors' own words.
Why it matters
- Vitamin C (ascorbic acid) is highly unstable and easily oxidized by factors such as heat, light, and oxygen. View evidence ↗
- Thermal processing can lead to a loss of over 50% of the vitamin C content between the time of harvest and consumption. View evidence ↗
- Titration is a simple and cost-effective method for measuring ascorbic acid in food, making it useful for laboratories with limited resources. View evidence ↗
The question
- The study aimed to measure vitamin C in twelve fruits under five different processing conditions using DCPIP titration and validate these results against HPLC. View evidence ↗
What they did
- The researchers analyzed twelve different types of fruits purchased from local markets in Meerut. View evidence ↗
- Vitamin C was extracted by homogenizing 10 g of the fruit in a 3% metaphosphoric acid-acetic acid solution. View evidence ↗
- High-performance liquid chromatography (HPLC) was used as a reference method to validate the titration results. View evidence ↗
What they found
- Among the fresh fruits, guava contained the highest vitamin C level at 228.4 mg/100 g. View evidence ↗
- Refrigeration was the most effective preservation method, retaining between 82.8% and 92.4% of the original vitamin C. View evidence ↗
- Canning caused the highest overall damage to vitamin C content, with an average loss of 61.6%. View evidence ↗
- Fresh juicing led to a 24-30% loss of vitamin C, likely due to air exposure and enzyme release during blending. View evidence ↗
- The DCPIP titration method showed a strong correlation (R² = 0.97) with the HPLC reference method. View evidence ↗
- The titration method had a small positive bias of 3.7% due to interference from sugars and dehydroascorbic acid. View evidence ↗
What it means
- The authors conclude that the DCPIP titration method is a valid and reliable tool for routine quality control in laboratories with limited resources. View evidence ↗
- To maximize vitamin C intake, the authors recommend consuming fruits fresh or refrigerated and avoiding prolonged boiling. View evidence ↗
Visual summary
1 visualsIllustrations explain the paper; they do not show study data.
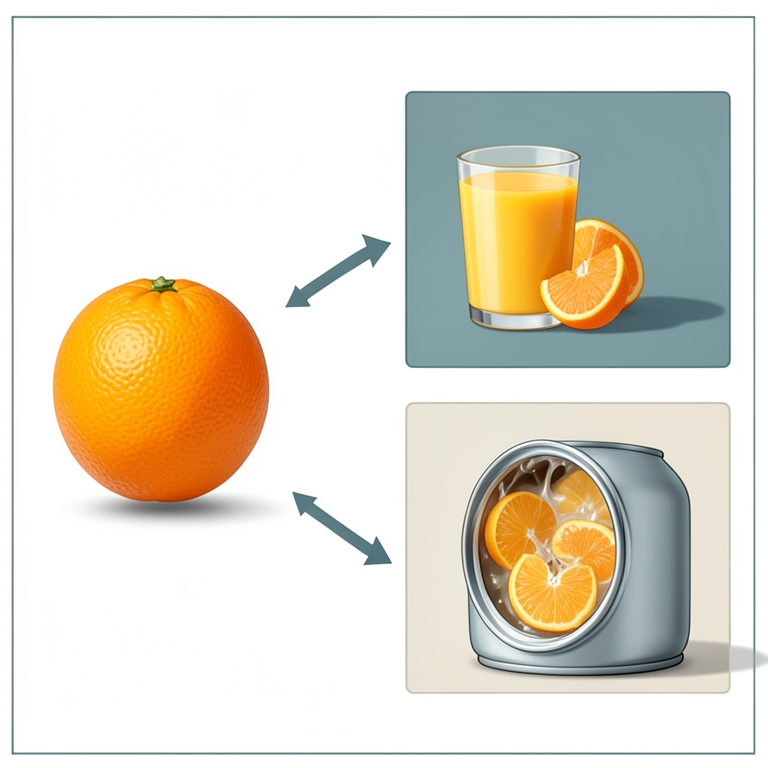
Vitamin C Retention by Processing Method
AI-generated conceptual illustration (Fresh oranges and processed orange products). It explains the idea and does not show study data.
View source evidence ↗Figures & tables
From the original paper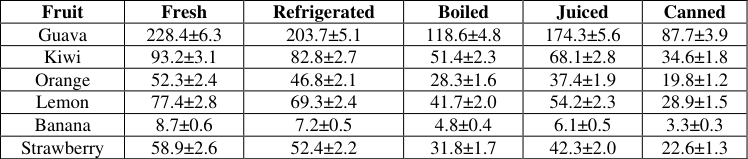 Table 1
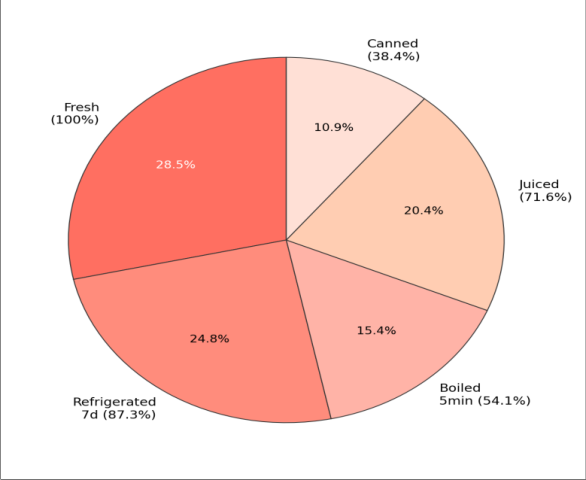 Figure 1
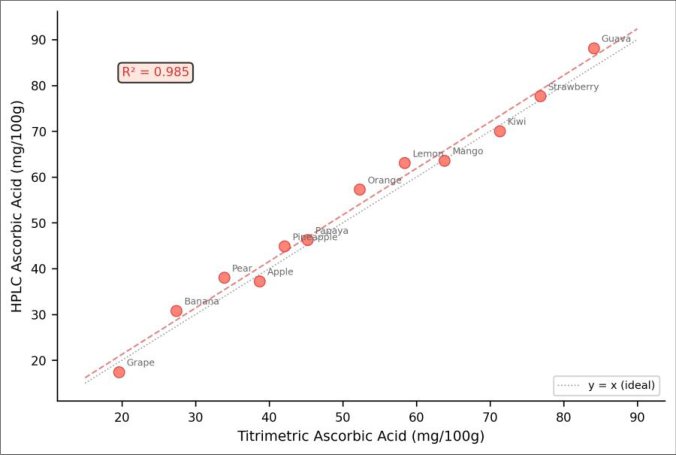 Figure 2
Introduction
Ascorbic acid is the most labile of the water-soluble vitamins sensitive to heat, oxygen, light, alkaline pH, and metal ions, all of which accelerate its irreversible oxidation to dehydroascorbic acid and, eventually, to 2,3-diketogulonic acid, which has no vitamin activity [1] . This fragility means that the vitamin C content printed on a food label may not reflect what is left by the time the product reaches a consumer's plate. The gap between "as harvested" and "as consumed" values can exceed 50% for fruits subjected to thermal processing [2] . The DCPIP (2, 6-dichlorophenolindophenol) redox titration is one of the oldest and most widely taught methods for ascorbic acid determination. Ascorbic acid reduces the blue dye to its colourless leuco form; the endpoint is the first persistent pink colour [3] . The method is rapid, requires no expensive equipment, and performs well in simple matrices like fruit juices. Its main weakness is interference from other reducing agents particularly sulfite preservatives and certain sugars which can give falsely high readings [4] . For routine quality control in developing-country laboratories, however, DCPIP titration often remains the only practical option [5] . This research measured vitamin C in twelve commonly consumed fruits across five processing conditions using DCPIP titration, validated the results against HPLC as a reference method, and calculated retention percentages to rank processing methods by their impact on ascorbic acid content.
Safety Considerations
DCPIP solution is a mild irritant; gloves were worn during preparation. Metaphosphoric acid (used for extraction) is corrosive at high concentrations; it was handled in a fume hood. No biological hazards were involved. All waste was neutralized and disposed of according to institutional protocols [6] . Material and Methods Material Work was conducted jointly at Lala Lajpat Rai College of Pharmacy, Meerut, and Vidyasagar University, Midnapore, from February to August 2023. Twelve fruits were purchased from local markets in Meerut: orange, apple, banana, guava, mango, grape, papaya, kiwi, pear, lemon, pineapple, and strawberry. Only ripe, unblemished specimens were selected. L-ascorbic acid standard (≥99%, Sigma-Aldrich), DCPIP sodium salt (Merck), metaphosphoric acid (HPO₃, 33.5%, Loba Chemie), and glacial acetic acid (Rankem) were used as received [7] .
Methods
Each fruit was prepared in five states: a) Fresh (analysed within 2 h of purchase), b) Refrigerated at 4°C for 7 days, c) Boiled in water at 100°C for 5 min and cooled, d) Freshly juiced using a domestic blender, and e) Commercially canned equivalents purchased from supermarkets.
For extraction, 10 g of edible portion was homogenized in 50 mL of 3% metaphosphoric acid-acetic acid solution, filtered through Whatman No. 1 paper, and diluted to 100 mL [3] . DCPIP solution (0.025%) was standardized daily against freshly prepared ascorbic acid standard (1 mg/mL in 3% HPO₃). Aliquots (5 mL) of extract were titrated until a persistent pink colour lasted 15 s. Each sample was analysed in triplicate. HPLC validation used a Shimadzu LC-2040C with a C₁₈ column (250 × 4.6 mm, 5 µm), isocratic elution with 0.1% oxalic acid in water at 1.0 mL/min, detection at 254 nm. Calibration covered 5-200 mg/L ascorbic acid (R² > 0.999) [8] . Retention (%) was calculated as (processed value / fresh value) × 100.
Statistical Analysis: Two-way ANOVA (fruit × processing method) with Tukey HSD post-hoc was performed at p<0.05. Pearson correlation compared titrimetric and HPLC values. All statistics used IBM SPSS 28 [9] .
Results
Table Values as mg ascorbic acid per 100 g fresh weight. Mean ± SD (n = 3). Six of twelve fruits shown; full data in text. Guava dominated every column, with 228.4 mg/100 g fresh nearly 2.5 times the kiwi and over 4 times the orange (Table 1). Boiling caused the steepest losses: an average of 45.9% across all twelve fruits, with guava losing 48.1% and banana losing 44.8%. Refrigeration was the gentlest treatment, retaining 82.8-92.4% of fresh values depending on the fruit. Canning inflicted the most damage overall (average 61.6% loss), reflecting both thermal processing and prolonged storage in syrup. Five processing conditions, illustrating relative retention. The pie chart (Figure 1) visualizes the retention hierarchy for orange: fresh (100%) > refrigerated (87.3%) > juiced (71.6%) > boiled (54.1%) > canned (38.4%). The pattern was broadly consistent across all twelve fruits, though citrus fruits retained marginally more after refrigeration than stone fruits or berries, possibly because of their lower pH, which stabilizes ascorbic acid against oxidation [1] . Titrimetric and HPLC values tracked closely (R² = 0.97; Figure 2), with most points falling near the y = x line. The mean positive bias of the titrimetric method was 3.7%, attributable to interference from other reducing substances primarily dehydroascorbic acid and residual sugars that reduce DCPIP but are not detected at 254 nm by the HPLC method [10] . For guava, the difference was larger (5.2%), consistent with its high sugar and phenolic content.
| Fruit | Fresh | Refrigerated | Boiled | Juiced | Canned |
|---|---|---|---|---|---|
| Guava | 228.4±6.3 | 203.7±5.1 | 118.6±4.8 | 174.3±5.6 | 87.7±3.9 |
| Kiwi | 93.2±3.1 | 82.8±2.7 | 51.4±2.3 | 68.1±2.8 | 34.6±1.8 |
| Orange | 52.3±2.4 | 46.8±2.1 | 28.3±1.6 | 37.4±1.9 | 19.8±1.2 |
| Lemon | 77.4±2.8 | 69.3±2.4 | 41.7±2.0 | 54.2±2.3 | 28.9±1.5 |
| Banana | 8.7±0.6 | 7.2±0.5 | 4.8±0.4 | 6.1±0.5 | 3.3±0.3 |
| Strawberry | 58.9±2.6 | 52.4±2.2 | 31.8±1.7 | 42.3±2.0 | 22.6±1.3 |
Table text extracted from the original PDF; superscript letters are shown inline. The original table image is below.
View original table image
Discussion
Guava's vitamin C content of 228.4 mg/100 g agrees closely with USDA values (228.3 mg/100 g) and confirms its status as the richest common fruit source roughly four to five times higher than orange, which typically receives more public credit for vitamin C [11] . In low-income communities where supplementation is unaffordable, guava could deliver the entire 90 mg recommended daily intake in a single 40 g serving, at a fraction of the cost of citrus imports. Banana's low value (8.7 mg/100 g) reinforces the nutritional message that not all fruits are equal sources of ascorbic acid. The 45.9% average loss from boiling is consistent with published values of 30-60% for blanching and cooking treatments across vegetables and fruits [2] . Heat both denatures the ascorbic acid directly and leaches it into cooking water. Juicing caused a 24-30% loss, likely through oxidation driven by exposure to air during blending and by polyphenol oxidase released from disrupted cells [12] . Refrigeration's relatively mild effect (8-18% loss over 7 days) supports the common advice to store fruits cold and consume them within a week. Canning combines hightemperature sterilization (typically 115-121°C) with months of shelf storage, explaining its position as the most destructive method [13] .
The R² of 0.97 between DCPIP and HPLC is higher than most published method comparisons, which typically range from 0.90 to 0.96 [4] . We attribute this to careful standardization of the DCPIP solution each day and the use of fresh metaphosphoric acid as extractant, which inhibits ascorbic acid oxidation during sample preparation [3] . The 3.7% positive bias is small enough that the titrimetric method can be recommended for routine quality control where HPLC is unavailable. However, for regulatory or export certification, HPLC remains the reference because it separates L-ascorbic acid from dehydroascorbic acid and any interfering reductants [14] .
Conclusion
Among twelve fruits, guava had the highest vitamin C at 228.4 mg/100 g, and boiling caused the greatest loss (average 45.9%). Refrigeration best preserved ascorbic acid content over 7 days. The DCPIP titrimetric method agreed closely with HPLC (R² = 0.97), validating its continued use in resource-limited food-analysis laboratories. Consumers are advised to eat fruits fresh or refrigerated and to avoid prolonged boiling if vitamin C retention is a priority.
References
13 in the original paper- Davey MW, Van Montagu M, Inzé D, Sanmartin M, Kanellis A, Smirnoff N, et al. Plant L-ascorbic acid: chemistry, function, metabolism, bioavailability and effects of processing. J Sci Food Agric. 2000;80(7):825-860.
- Rickman JC, Barrett DM, Bruhn CM. Nutritional comparison of fresh, frozen and canned fruits and vegetables. Part 1: vitamins C and B and phenolic compounds. J Sci Food Agric. 2007;87(6):930-944.
- AOAC International. Official methods of analysis. Method 967.21: ascorbic acid in vitamin preparations and juices. 21st ed. Rockville (MD): AOAC; 2019.
- Arya SP, Mahajan M, Jain P. Non-spectrophotometric methods for the determination of vitamin C. Anal Chim Acta. 2000;417(1):1-14.
- Nyyssonen K, Parviainen MT, Hero H, Syvaoja E, Salo MK. Ascorbic acid analysis with strong cationexchange column and electrochemical detection. Agric Biol Chem. 1985;49(8):2357-2360.
- National Research Council. Prudent practices in the laboratory: handling and management of chemical hazards. Washington (DC): National Academies Press; 2011.
- Indian Pharmacopoeia Commission. Indian Pharmacopoeia 2018. Vol. III. Ghaziabad: IPC; 2018.
- Spinola V, Mendes B, Camara JS, Castilho PC. An improved and fast UHPLC-PDA methodology for determination of L-ascorbic and dehydroascorbic acids in fruits and vegetables. Anal Bioanal Chem. 2012;403(4):1049-1058.
- IBM Corporation. SPSS Statistics 28 algorithms. Armonk (NY): IBM Corp; 2021.
- Wechtersbach L, Cigic B. Reduction of dehydroascorbic acid at low pH. J Biochem Biophys Methods. 2007;70(5):767-772.
- Gil MI, Aguayo E, Kader AA. Quality changes and nutrient retention in fresh-cut versus whole fruits during storage. J Agric Food Chem. 2006;54(12):4284-4296.
- Rickman JC, Bruhn CM, Barrett DM. Nutritional comparison of fresh, frozen and canned fruits and vegetables. Part II: vitamin A and carotenoids, vitamin E, minerals and fiber. J Sci Food Agric. 2007;87(7):1185-1196.
- Spiclin P, Gasperlin M, Kmetec V. Stability of ascorbyl palmitate in topical microemulsions. Int J Pharm. 2001;222(2):271-279.