
Research article · 2025 · Full text
International Journal of Advanced Chemistry ResearchPhytochemical screening and antioxidant activity of Moringa oleifera leaf extract
Volume 7(3) · Pages 115–118 · DOI: 10.33545/26646781.2025.v7.i3b.411 ↗
Research areasMoringa oleifera research and applicationsPhytochemicals and Antioxidant ActivitiesMangiferin and Mango Extracts
Abstract
Author-writtenIn rural communities across West Africa, Moringa oleifera leaves are dried, powdered, and stirred into porridge to treat everything from anaemia to diabetes traditional knowledge that modern pharmacology is now working to validate. This research screened the phytochemical composition of M. oleifera leaf extracts prepared with five solvents (water, ethanol, methanol, hexane, and ethyl acetate) and measured their antioxidant activity by DPPH and ABTS radical-scavenging assays. The ethanol extract had the highest total phenolic content (82.6 mg GAE/g) and total flavonoid content (38.4 mg QE/g), and it recorded the lowest DPPH IC₅₀ of 23.7 µg/mL comparable to ascorbic acid (IC₅₀ = 18.3 µg/mL). Hexane performed worst on all measures. A strong inverse correlation existed between phenolic content and IC₅₀ (r = −0.94), supporting polyphenols as the main antioxidant constituents.
Summary
Source-checkedPlain-language reading of the full paper, prepared with AI and checked against the text. Each point links to the authors' own words.
Why it matters
- Moringa oleifera is a fast-growing tree common in tropical Africa and the sub-Himalayan regions, known for having a high concentration of bioactive molecules like polyphenols and flavonoids in its leaves. View evidence ↗
- Reactive oxygen species (ROS) can cause damage to DNA, proteins, and lipids, which contributes to various conditions including cancer, cardiovascular disease, and ageing. View evidence ↗
- The specific solvent used for extraction significantly affects which phytochemicals are recovered from the plant material. View evidence ↗
The question
- The study aimed to compare the total phenolic content (TPC), total flavonoid content (TFC), and antioxidant activities (DPPH and ABTS) of M. oleifera leaf extracts using five different solvents, using ascorbic acid as a standard. View evidence ↗
What they did
- Fresh M. oleifera leaves were collected in August 2022 during the rainy season from the Obafemi Awolowo National University campus in Ibadan. View evidence ↗
- The researchers macerated 20 g of powdered leaves in 200 mL of five different solvents (water, 80% ethanol, 80% methanol, n-hexane, and ethyl acetate) for 48 hours at room temperature. View evidence ↗
- Total phenolic content (TPC) was measured using the Folin-Ciocalteu method (765 nm), and total flavonoid content (TFC) was measured using the aluminium chloride colorimetric method (415 nm). View evidence ↗
- Antioxidant activity was measured using DPPH assays (absorbance at 517 nm) and ABTS assays (absorbance at 734 nm). View evidence ↗
What they found
- The ethanol extract showed the highest total phenolic content (82.6 ± 3.4 mg GAE/g) and total flavonoid content (38.4 ± 2.1 mg QE/g). View evidence ↗
- The ethanol extract's DPPH IC₅₀ was 23.7 ± 1.8 µg/mL, which was close to the reference ascorbic acid value of 18.3 ± 1.1 µg/mL. View evidence ↗
- Hexane was the least effective solvent, yielding the lowest TPC (18.9 ± 1.4 mg GAE/g) and the weakest DPPH scavenging activity (IC₅₀ = 187.4 ± 9.6 µg/mL). View evidence ↗
- The aqueous extract had the highest overall yield at 14.3%, but only moderate phenolic content (47.3 ± 2.8 mg GAE/g). View evidence ↗
- There was a strong inverse correlation between total phenolic content and DPPH IC₅₀ (r = -0.94, p < 0.01), as well as between total flavonoid content and IC₅₀ (r = -0.91, p < 0.01). View evidence ↗
What it means
- The authors conclude that 80% ethanol is the best solvent for extracting antioxidants from M. oleifera leaves and recommend it for nutraceutical development due to its efficiency and safety for food-grade use. View evidence ↗
- The study did not identify individual polyphenols using HPLC, and the authors state that HPLC profiling and in vivo validation are necessary future steps. View evidence ↗
Visual summary
3 visualsIllustrations explain the paper; charts are replotted from the paper's own table values.
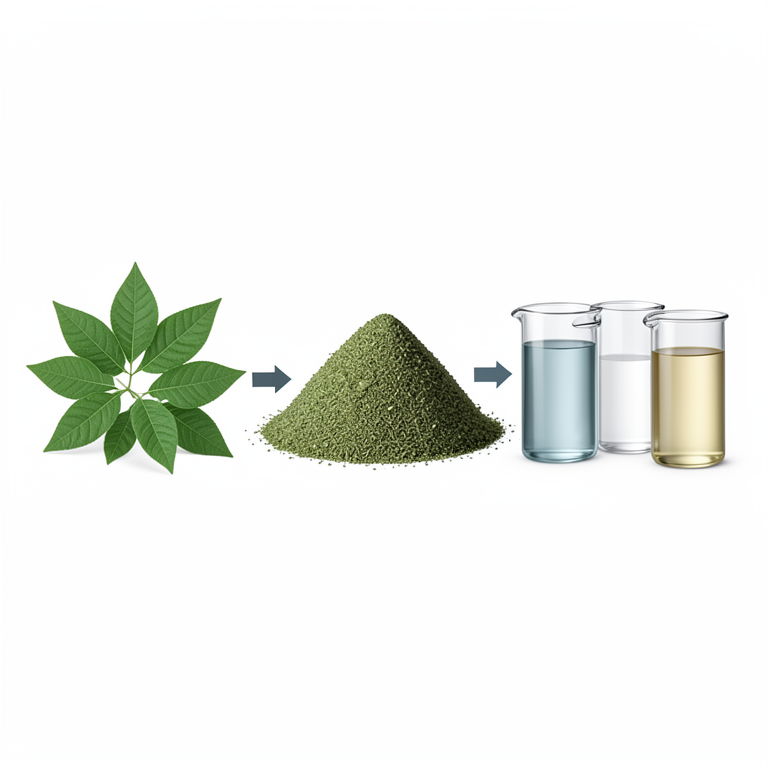
Extraction Process Workflow
AI-generated conceptual illustration (Moringa oleifera leaves). It explains the idea and does not show study data.
View source evidence ↗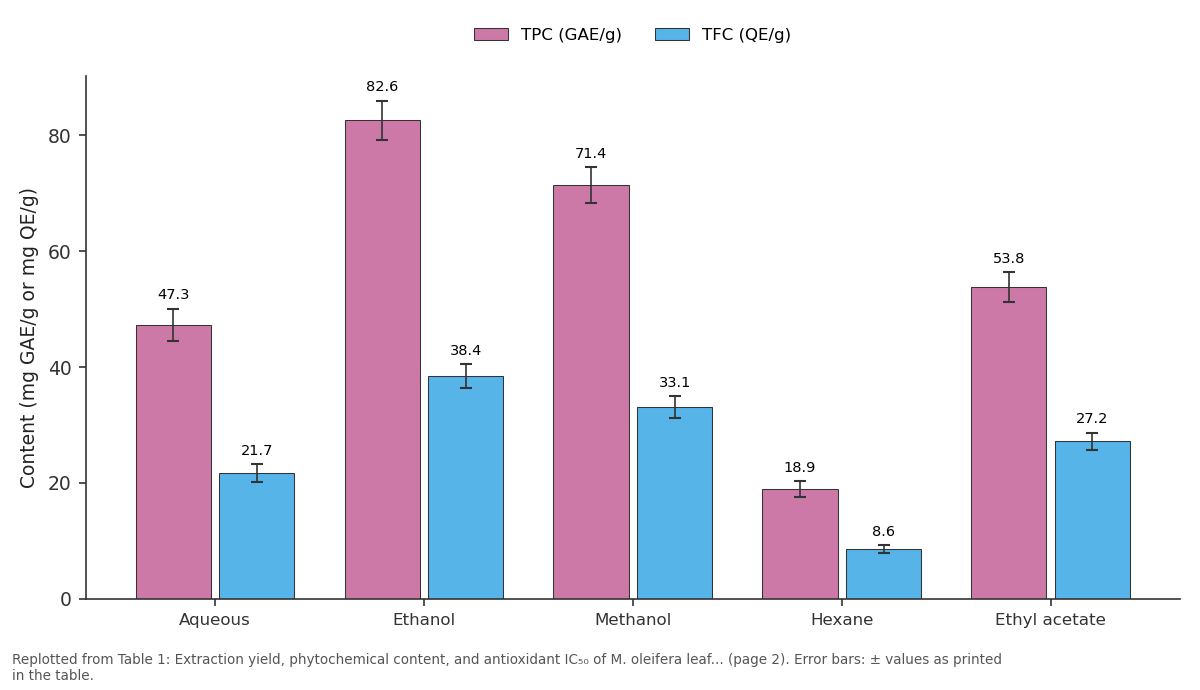
TPC (GAE/g) and TFC (QE/g): Aqueous vs Ethanol vs Methanol vs Hexane vs Ethyl acetate
Replotted from Table 1 (page 2) of the original paper. Every bar is the paper's own table value.
View source evidence ↗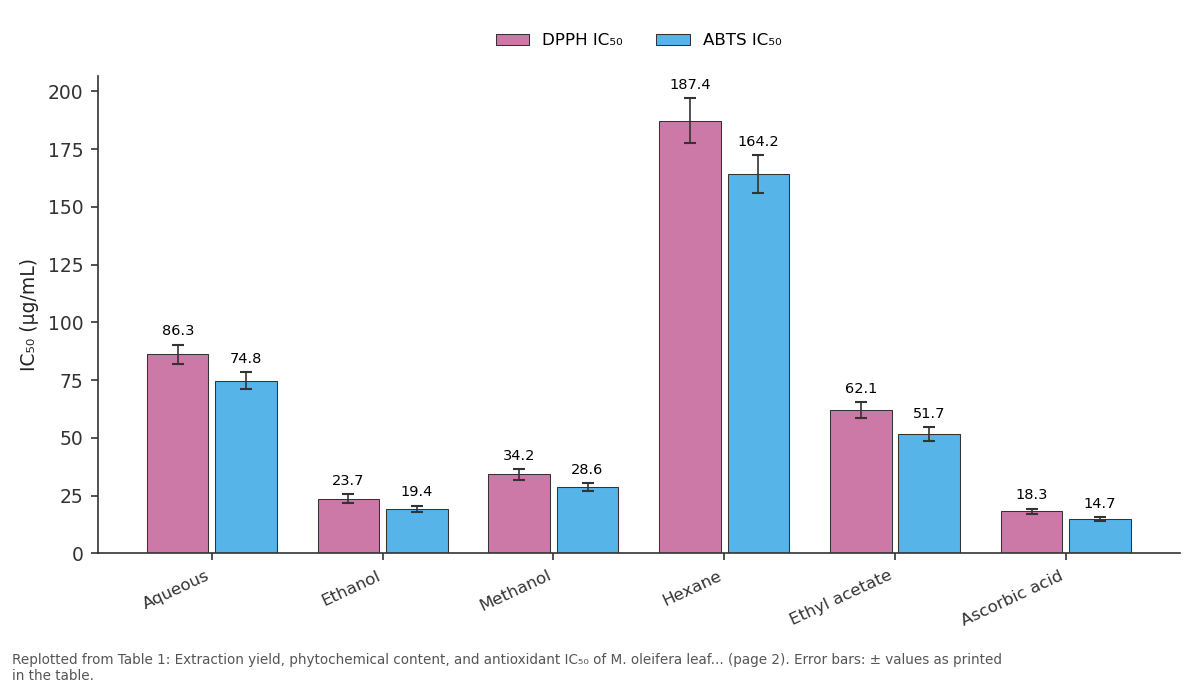
DPPH IC₅₀ and ABTS IC₅₀: Aqueous vs Ethanol vs Methanol vs Hexane vs Ethyl acetate
Replotted from Table 1 (page 2) of the original paper. Every bar is the paper's own table value.
View source evidence ↗Figures & tables
From the original paper Table 1
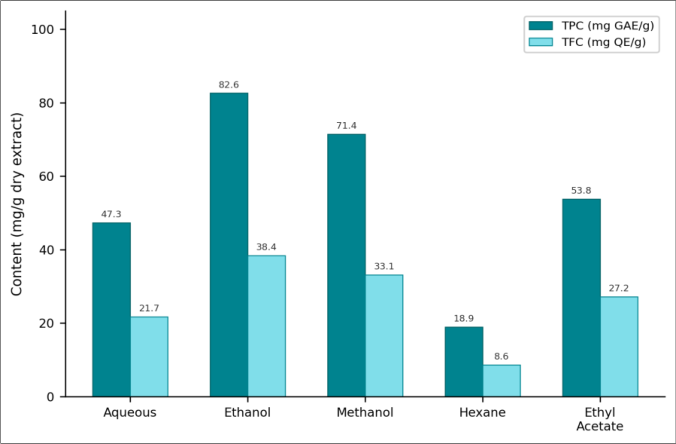 Figure 1
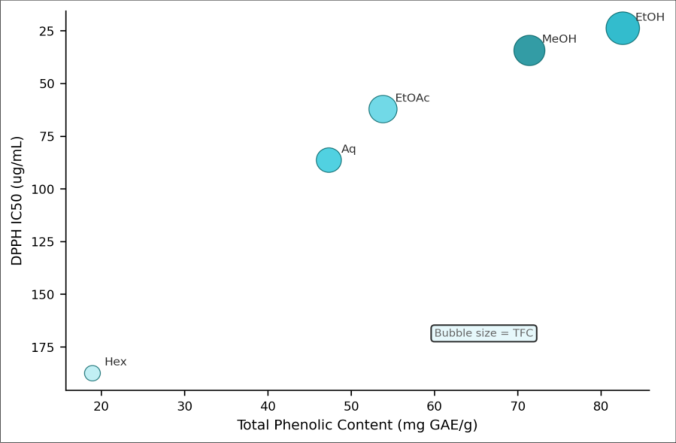 Figure 2
Introduction
A woman selling sachets of dried moringa powder at a roadside market in Ibadan will tell you the plant cures forty diseases. The claim is exaggerated, but it rests on a real pharmacological foundation. Moringa oleifera, a fast-growing tree native to the sub-Himalayan regions and now widespread across tropical Africa, contains an unusual density of bioactive molecules polyphenols, flavonoids, glucosinolates, isothiocyanates, and tannins concentrated mainly in its leaves [1] . The World Health Organization has recognized moringa as a nutritional supplement worth investigating for resource-limited settings [2] . Antioxidant activity is one of the best-documented biological effects of moringa leaf extracts. Reactive oxygen species (ROS) damage lipids, proteins, and DNA, contributing to ageing, cardiovascular disease, cancer, and neurodegenerative conditions [3] . Polyphenols neutralize ROS by donating hydrogen atoms or electrons, and the total phenolic content (TPC) of a plant extract often correlates with its in vitro radical-scavenging capacity [4] . Flavonoids, a subclass of polyphenols, add metal-chelating ability that prevents iron-or copper-catalyzed Fenton reactions [5] . The choice of extraction solvent strongly influences the phytochemical profile recovered. Water pulls out polar glycosides and organic acids; ethanol and methanol dissolve a broader range of polyphenols; hexane captures lipophilic compounds like fatty acids and carotenoids [6] . Direct comparison of multiple solvents on the same batch of leaves controlling for harvest date, drying method, and particle size is essential for identifying which extract offers the best antioxidant potential [7] . This research extracted M. oleifera leaves with five solvents of increasing polarity, quantified TPC and total flavonoid content (TFC), and compared DPPH and ABTS radical-scavenging activities across all extracts, with ascorbic acid as the reference standard.
Safety Considerations
Methanol and hexane are volatile and toxic; all extractions involving these solvents were performed in a fume hood with mechanical ventilation. Spent solvent was collected in labelled waste containers and disposed of through the university's chemical waste programme. DPPH reagent was handled with nitrile gloves to avoid skin contact. No human or animal subjects were involved in this research [8] .
Material and Methods
Material and Methods
Material
Fresh M. oleifera leaves were harvested from trees on the campus of Obafemi Awolowo National University, Ibadan, in August 2022 (rainy season, peak leaf biomass). Leaves were authenticated by the university herbarium (voucher specimen OAU-BOT-2022-047). They were shade-dried for seven days, ground in a hammer mill, and sieved to <500 µm. Work was performed at the Department of Phytochemistry and Herbal Medicine from August 2022 to May 2023. DPPH (2,2-diphenyl-1-picrylhydrazyl), ABTS (2,2′-azino-bis(3-ethylbenzothiazoline-6-sulfonic acid)), Folin-Ciocalteu reagent, gallic acid, quercetin, ascorbic acid, and sodium carbonate were purchased from Sigma-Aldrich via a local distributor [9] .
Methods: Powdered leaf (20 g) was macerated in 200 mL of each solvent (water, 80% ethanol, 80% methanol, nhexane, and ethyl acetate) at room temperature for 48 h with occasional shaking. Extracts were filtered through Whatman No. 1 paper and concentrated under reduced pressure at 40°C on a rotary evaporator (Büchi R-210). Aqueous extract was freeze-dried. TPC was determined by the Folin-Ciocalteu method at 765 nm, expressed as mg gallic acid equivalents per gram dry extract (mg GAE/g) [10] . TFC used the aluminium chloride colorimetric method at 415 nm, expressed as mg quercetin equivalents (mg QE/g) [11] . DPPH assay followed Brand-Williams's protocol: 0.1 mM DPPH in methanol was mixed with extract concentrations from 5 to 200 µg/mL, incubated in the dark for 30 min, and absorbance read at 517 nm [12] . ABTS assay used the Re method with potassium persulphate activation, read at 734 nm [13] . IC₅₀ was calculated by non-linear regression. All assays ran in triplicate.
Statistical Analysis
Data were analyzed using one-way ANOVA followed by Tukey's HSD post-hoc test at p<0.05 (IBM SPSS Statistics 28). Pearson correlation coefficients were calculated between TPC, TFC, and IC₅₀ values. Dose-response curves for IC₅₀ determination were fitted with a four-parameter logistic model in GraphPad Prism 9 [14] . TPC = total phenolic content; TFC = total flavonoid content; IC₅₀ in µg/mL. Mean ± SD (n = 3).
Results
The ethanol extract gave the highest TPC (82.6 mg GAE/g) and TFC (38.4 mg QE/g), and its DPPH IC₅₀ of 23.7 µg/mL approached that of ascorbic acid (Table 1). Hexane recovered very few polyphenols and showed the weakest scavenging activity (IC₅₀ = 187.4 µg/mL). ABTS results tracked DPPH rankings closely. Ethanol and methanol extracted the most polyphenols, while hexane trailed far behind (Figure 1). The aqueous extract, despite its high yield (14.3%), contained only moderate phenolics, probably because water preferentially solubilizes sugars and proteins rather than polyphenolic aglycones [6] .
| Solvent | Yield (%) | TPC (GAE/g) | TFC (QE/g) | DPPH IC₅₀ | ABTS IC₅₀ |
|---|---|---|---|---|---|
| Aqueous | 14.3 | 47.3±2.8 | 21.7±1.6 | 86.3±4.1 | 74.8±3.7 |
| Ethanol | 11.7 | 82.6±3.4 | 38.4±2.1 | 23.7±1.8 | 19.4±1.3 |
| Methanol | 12.4 | 71.4±3.1 | 33.1±1.9 | 34.2±2.3 | 28.6±1.8 |
| Hexane | 5.8 | 18.9±1.4 | 8.6±0.7 | 187.4±9.6 | 164.2±8.1 |
| Ethyl acetate | 8.2 | 53.8±2.6 | 27.2±1.5 | 62.1±3.4 | 51.7±2.9 |
| Ascorbic acid | — | — | — | 18.3±1.1 | 14.7±0.9 |
Table text extracted from the original PDF; superscript letters are shown inline. The original table image is below.
View original table image
Fig 2:
Bubble chart of DPPH IC₅₀ against TPC for each extract (bubble size proportional to TFC; y-axis inverted so better performance is higher).
The inverse relationship between TPC and IC₅₀ is clearly visible in the bubble plot (Figure 2): the ethanol extract sits in the upper right corner with high phenolics and low IC₅₀, while hexane drops to the lower left. The Pearson correlation between TPC and DPPH IC₅₀ was r = -0.94 (p<0.01), and between TFC and IC₅₀ it was r = -0.91 (p<0.01) [15] .
Discussion
The ethanol extract's TPC of 82.6 mg GAE/g is at the upper end of values reported for moringa leaves in the literature, where most groups find 40-90 mg GAE/g depending on growing region, harvest season, and extraction protocol [1] . Ethanol at 80% concentration balances polarity well it dissolves both glycosylated and free phenolics, while the 20% water fraction keeps more polar flavonoid glycosides in solution [7] . Methanol performed similarly but is more toxic, making ethanol the practical choice for any downstream nutraceutical application.
The DPPH IC₅₀ of 23.7 µg/mL puts the ethanol extract in the "very strong antioxidant" category (IC₅₀ < 50 µg/mL) by the commonly used classification of Jun and colleagues [4] . It trails ascorbic acid (18.3 µg/mL) by about 30%, which is expected since a crude extract is a complex mixture and not all its components are active radical scavengers. The nearperfect correlation of r = -0.94 between TPC and IC₅₀ aligns with a large body of evidence that phenolic hydroxyl groups are the main hydrogen donors in DPPH and ABTS assays [16] . Hexane's poor showing reflects its inability to extract polar phenolics. It did recover a small amount of carotenoids (visible from the yellow colour of the extract), but these contribute little to radical scavenging in the DPPH assay, which is performed in methanol a solvent that limits carotenoid activity [3] . A limitation of this research is that individual polyphenols were not identified by HPLC. Knowing whether the activity comes from quercetin-3-glucoside, chlorogenic acid, or kaempferol would help in standardizing the extract for commercial use [17] .
Conclusion
Among five solvents tested, 80% ethanol extracted the richest phenolic and flavonoid fraction from M. oleifera leaves and delivered the strongest radical-scavenging activity, with a DPPH IC₅₀ of 23.7 µg/mL approaching that of ascorbic acid. The strong TPC-IC₅₀ correlation confirms polyphenols as the main antioxidant agents. Ethanol is also safe for food-grade applications, making it the recommended solvent for moringa-based nutraceutical development. HPLC profiling and in vivo validation are needed next.
Acknowledgement
Acknowledgements Funding SourcesNo external funding was received for this research. Institutional SupportThe authors thank Obafemi Awolowo National University, Ibadan, for laboratory and herbarium facilities.
References
17 in the original paper- Anwar F, Latif S, Ashraf M, Gilani AH. Moringa oleifera: a food plant with multiple medicinal uses. Phytother Res. 2007;21(1):17-25.
- Fahey JW. Moringa oleifera: a review of the medical evidence for its nutritional, therapeutic, and prophylactic properties. Trees Life J. 2005;1(5):1-15.
- Halliwell B. Free radicals and antioxidants quo vadis? Trends Pharmacol Sci. 2011;32(3):125-130.
- Jun M, Fu HY, Hong J, Wan X, Yang CS, Ho CT. Comparison of antioxidant activities of isoflavones from kudzu root. J Food Sci. 2003;68(6):2117-2122.
- Rice-Evans CA, Miller NJ, Paganga G. Structureantioxidant activity relationships of flavonoids and phenolic acids. Free Radic Biol Med. 1996;20(7):933956.
- Do QD, Angkawijaya AE, Tran-Nguyen PL, Huynh LH, Soetaredjo FE, Ismadji S, et al. Effect of extraction solvent on total phenol content, total flavonoid content, and antioxidant activity of Limnophila aromatica. J Food Drug Anal. 2014;22(3):296-302.
- Siddhuraju P, Becker K. Antioxidant properties of various solvent extracts of total phenolic constituents from three different agroclimatic origins of drumstick tree leaves. J Agric Food Chem. 2003;51(8):2144-2155.
- National Research Council. Prudent practices in the laboratory: handling and management of chemical hazards. Washington DC: National Academies Press; 2011.
- Singleton VL, Orthofer R, Lamuela-Raventós RM. Analysis of total phenols and other oxidation substrates and antioxidants by means of Folin-Ciocalteu reagent. Methods Enzymol. 1999;299:152-178.
- Ainsworth EA, Gillespie KM. Estimation of total phenolic content and other oxidation substrates in plant tissues using Folin-Ciocalteu reagent. Nat Protoc. 2007;2(4):875-877.
- Chang CC, Yang MH, Wen HM, Chern JC. Estimation of total flavonoid content in propolis by two complementary colorimetric methods. J Food Drug Anal. 2002;10(3):178-182.
- Brand-Williams W, Cuvelier ME, Berset C. Use of a free radical method to evaluate antioxidant activity. LWT Food Sci Technol. 1995;28(1):25-30.
- Re R, Pellegrini N, Proteggente A, Pannala A, Yang M, Rice-Evans C. Antioxidant activity applying an improved ABTS radical cation decolorization assay. Free Radic Biol Med. 1999;26(9-10):1231-1237.
- IBM Corporation. SPSS Statistics 28 algorithms. Armonk, NY: IBM Corp; 2021.
- Velioglu YS, Mazza G, Gao L, Oomah BD. Antioxidant activity and total phenolics in selected fruits, vegetables, and grain products. J Agric Food Chem. 1998;46(10):4113-4117.
- Leopoldini M, Russo N, Toscano M. The molecular basis of working mechanism of natural polyphenolic antioxidants. Food Chem. 2011;125(2):288-306.
- Coppin JP, Xu Y, Chen H, Pan MH, Ho CT, Juliani R, et al. Determination of flavonoids by LC/MS and antiinflammatory activity in Moringa oleifera. J Funct Foods. 2013;5(4):1892-1899.