
Research article · 2025 · Full text
International Journal of Advanced Chemistry ResearchComparative analysis of polyphenolic profile of different varieties of green tea
Volume 7(3) · Pages 103–106 · DOI: 10.33545/26646781.2025.v7.i3b.408 ↗
Research areasTea Polyphenols and EffectsPhytochemicals and Antioxidant ActivitiesHeavy Metals in Plants
Abstract
Author-writtenIn northern Nigeria, green tea consumption has tripled over the past decade driven less by tradition than by a growing awareness of its purported health benefits. But not all green teas are the same: terroir, cultivar, and processing method shape the polyphenolic fingerprint that underlies antioxidant and anti-inflammatory activity. This research compared the polyphenolic profiles of four commercial green tea varieties Chinese Longjing, Japanese Sencha, Indian Darjeeling green, and Kenyan GFOP using HPLC-DAD analysis. Total catechin content ranged from 98.3 mg/g (Kenyan) to 157.2 mg/g (Japanese Sencha), with epigallocatechin gallate (EGCG) accounting for 41-58% of total catechins across varieties. DPPH radical-scavenging IC₅₀ values correlated inversely with EGCG content (r = −0.97). Gallic acid, caffeic acid, and chlorogenic acid were quantified as minor polyphenolics. The data provide a reference framework for quality grading of green teas entering the West African market.
Summary
Source-checkedPlain-language reading of the full paper, prepared with AI and checked against the text. Each point links to the authors' own words.
Why it matters
- Green tea consumption in northern Nigeria has increased threefold over ten years due to rising awareness of its health benefits. View evidence ↗
- The antioxidant and anti-inflammatory properties of green tea are determined by its polyphenolic profile, which is influenced by the cultivar, processing methods, and terroir. View evidence ↗
- Consumers in West Africa often judge tea quality by price and packaging because regulatory standards for imported teas are still being developed. View evidence ↗
The question
- The study aimed to quantify phenolic acids and individual catechins in four green tea varieties and determine the correlation between these polyphenols and their antioxidant capacity. View evidence ↗
What they did
- The researchers analyzed four loose-leaf green tea varieties from China (Longjing), Japan (Sencha), India (Darjeeling), and Kenya (GFOP). View evidence ↗
- Extraction involved using 100 mL of 70% methanol to treat 1.0 g of tea at 70 °C for 30 minutes. View evidence ↗
- Polyphenols were analyzed using HPLC with a C18 column and DAD detection at 280 nm for catechins and 320 nm for phenolic acids. View evidence ↗
- Antioxidant activity was measured using DPPH and ABTS assays across six concentrations (10-200 µg/mL) in triplicate, using ascorbic acid as a reference. View evidence ↗
What they found
- Japanese Sencha exhibited the highest total catechin content (157.2 mg/g) and the strongest antioxidant activity, indicated by the lowest DPPH IC₅₀ (13.8 µg/mL). View evidence ↗
- Kenyan GFOP had the lowest total catechin content (98.3 mg/g) and the weakest antioxidant activity (IC₅₀ of 28.3 µg/mL). View evidence ↗
- Epigallocatechin gallate (EGCG) was the primary catechin across all tested varieties, comprising 41-53% of the total catechin content. View evidence ↗
- Minor phenolic acids were quantified, with gallic acid (4.1-7.3 mg/g), caffeic acid (1.8-3.6 mg/g), and chlorogenic acid (2.4-5.1 mg/g) found across the varieties. View evidence ↗
- There was a very strong inverse correlation (r = -0.97) between EGCG content and DPPH radical-scavenging IC₅₀ values, meaning higher EGCG levels lead to better antioxidant activity. View evidence ↗
- Principal Component Analysis (PCA) successfully distinguished the four tea varieties, with the first two components explaining 87.4% of the total variance. View evidence ↗
What it means
- The authors concluded that Japanese Sencha is the most potent of the four commercial teas in terms of catechin content and antioxidant activity, while Kenyan GFOP is the least. View evidence ↗
- The authors recommend implementing cold-chain integrity during the import of teas to West Africa to prevent the degradation of catechins. View evidence ↗
- The authors note that the lower quality of Kenyan tea might be due to degradation during transport rather than the inherent quality of the leaves. View evidence ↗
Visual summary
3 visualsIllustrations explain the paper; charts are replotted from the paper's own table values.
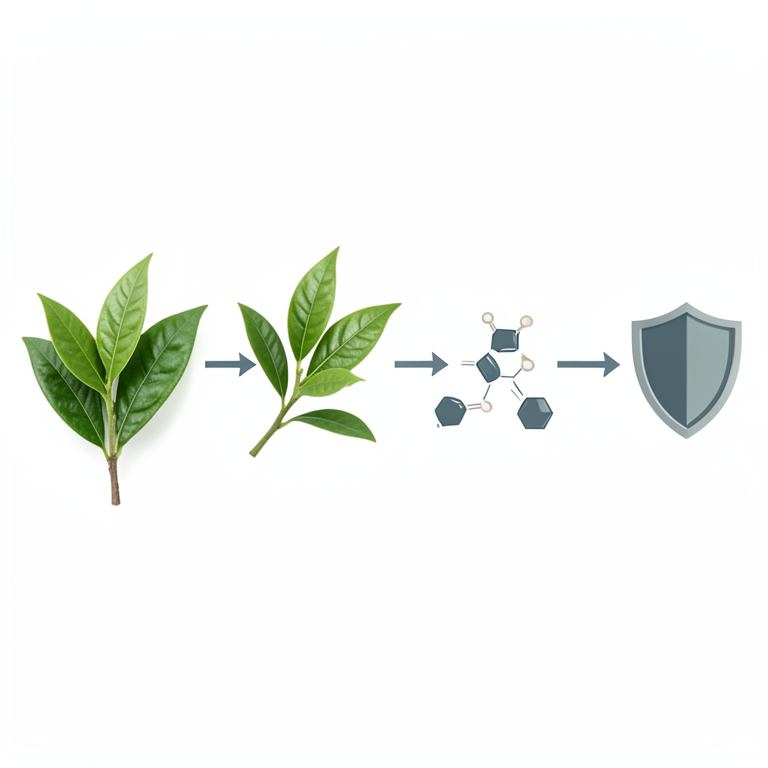
Relationship between Tea Origin, Catechins, and Antioxidant Power
AI-generated conceptual illustration (Camellia sinensis (green tea leaves)). It explains the idea and does not show study data.
View source evidence ↗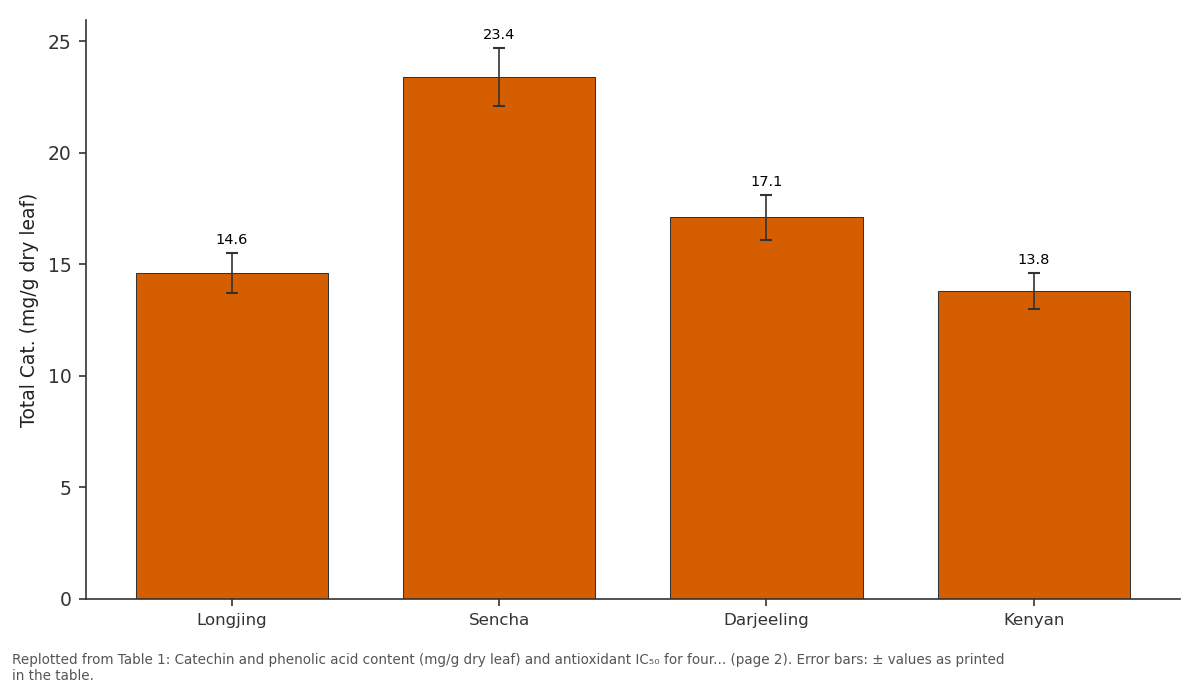
EC: Longjing vs Sencha vs Darjeeling vs Kenyan
Replotted from Table 1 (page 2) of the original paper. Every bar is the paper's own table value.
View source evidence ↗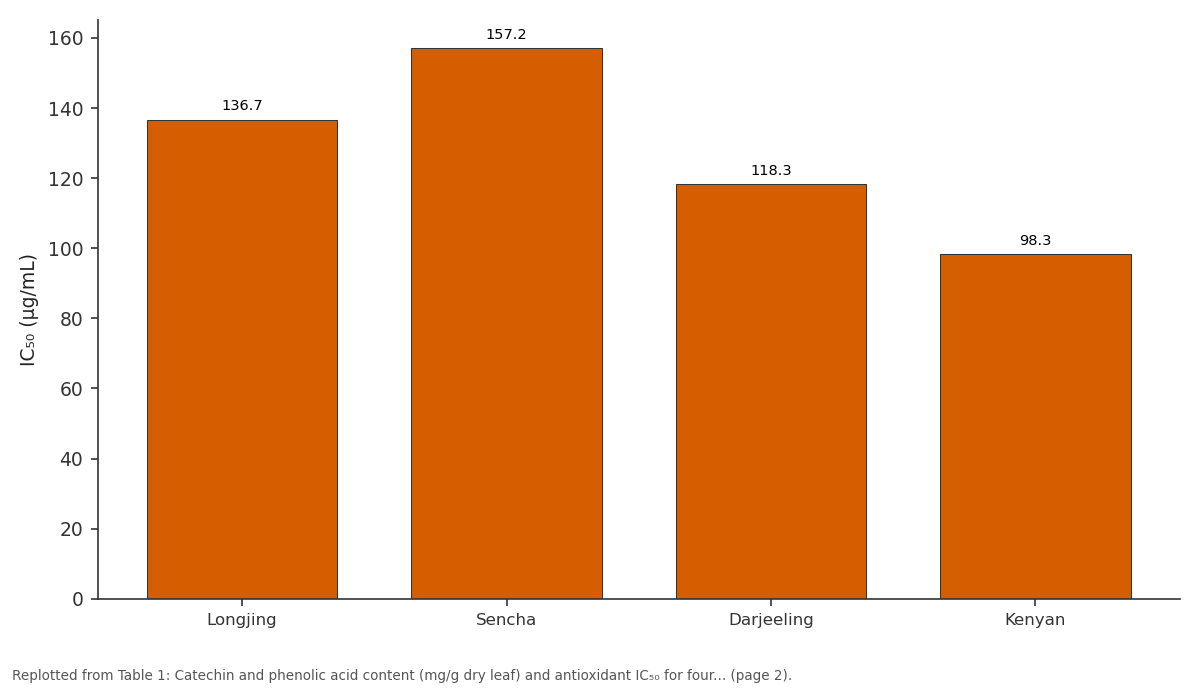
Total Cat.: Longjing vs Sencha vs Darjeeling vs Kenyan
Replotted from Table 1 (page 2) of the original paper. Every bar is the paper's own table value.
View source evidence ↗Figures & tables
From the original paper Table 1
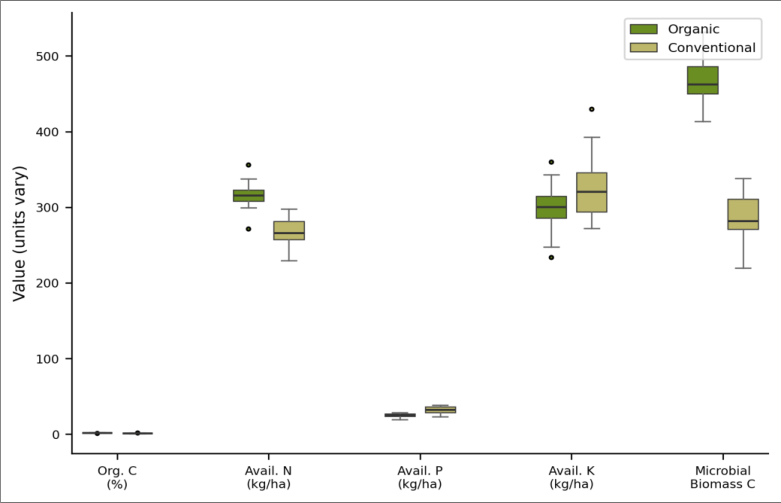 Figure 1
 Figure 2
Introduction
Walk into a health-food shop anywhere in Abuja and you will find green tea marketed under a dozen brand names some imported from China, others from Japan, India, or Kenya each claiming superior health benefits without specifying the chemical basis for the claim. In West Africa, where regulatory standards for imported teas are still developing, consumers rely on price and packaging rather than analytical data to judge quality [1] . A polyphenolic profile offers an objective, reproducible measure of what is actually in the cup. Green tea (Camellia sinensis) owes most of its biological activity to catechins, a family of flavanol compounds that includes EGCG, epicatechin gallate (ECG), epigallocatechin (EGC), and epicatechin (EC) [2] . EGCG alone accounts for 30-60% of total catechins and has been linked to anti-cancer, cardioprotective, and neuroprotective effects in cell and animal models [3] . Processing matters: green tea is steamed or pan-fired immediately after harvest to inactivate polyphenol oxidase, preserving catechins that would otherwise oxidize into theaflavins and thearubigins during black-tea manufacture [4] . Terroir the combination of altitude, soil, humidity, and sunlight further modulates catechin levels. Japanese Sencha is typically shade-grown for two to three weeks before harvest, boosting theanine and chlorophyll but reducing EGCG compared with fully sun-exposed Chinese Longjing [5] . Kenyan teas, grown at equatorial altitudes above 1,800 m, tend to accumulate catechins rapidly under intense UV radiation [6] . Direct HPLC comparison of these four origins on the same analytical platform has rarely been reported. This research quantified individual catechins and phenolic acids in four green tea varieties, measured DPPH and ABTS antioxidant activity, and examined correlations between individual polyphenols and radical-scavenging capacity.
Safety Considerations
HPLC-grade methanol and acetonitrile were handled in a fume hood. DPPH is a mild irritant; gloves and goggles were worn during assay preparation. All solvent waste was collected and disposed of by the university chemical waste service. No human or animal subjects were involved [7] .
Interna tional Jo urna l o f Adva nced Chemistry Research 2025 ; 7(3 ): 1 03 -10 6
Material and Methods Material All analytical work was performed at the Department of Chemistry of Natural Resources, Sahel National University, Abuja, from January to September 2023. Four loose-leaf green teas were purchased from certified importers in Abuja: Chinese Longjing (Zhejiang origin, 2022 spring flush), Japanese Sencha (Shizuoka, first flush), Indian Darjeeling green (FTGFOP grade, spring 2022), and Kenyan GFOP (Kericho highlands, 2022). Samples were stored at -20 °C until analysis. HPLC-grade methanol, acetonitrile, and phosphoric acid came from Merck. Catechin standards (EGCG, ECG, EGC, EC, ≥95%) and phenolic acid standards (gallic, caffeic, chlorogenic acids) were sourced from Sigma-Aldrich [8] .
Methods
Tea (1.0 g) was extracted with 100 mL 70% methanol at 70 °C for 30 min in a water bath, filtered (0.45 µm PVDF), and diluted 1:10 with mobile phase A. HPLC analysis used a Shimadzu LC-2040C 3D with a C₁₈ column (250 × 4.6 mm, 5 µm) at 35 °C, DAD detection at 280 nm (catechins) and 320 nm (phenolic acids). Gradient elution with 0.1% H₃PO₄ in water (A) and acetonitrile (B) ran from 10% to 45% B over 40 min at 1.0 mL/min [9] . Peaks were identified by retention time and UV spectra against standards; quantification used external calibration (R² > 0.999 for all analytes). DPPH and ABTS assays followed established methods at six concentrations (10-200 µg/mL) with ascorbic acid as reference [10] . All analyses were run in triplicate.
Statistical Analysis
One-way ANOVA with Tukey HSD (p < 0.05) compared polyphenol content and IC₅₀ across teas. Pearson correlations linked individual catechin concentrations to IC₅₀. Principal component analysis (PCA) was applied to the polyphenol data matrix to visualize variety clustering. All statistics used JASP 0.17 [11] . Japanese Sencha had the highest total catechin content at 157.2 mg/g and the lowest DPPH IC₅₀ of 13.8 µg/mL (Table 1). Kenyan GFOP trailed with 98.3 mg/g total catechins and an IC₅₀ of 28.3 µg/mL. EGCG was the dominant catechin in all varieties, making up 41-53% of the total. Gallic acid ranged from 4.1 to 7.3 mg/g, caffeic acid from 1.8 to 3.6 mg/g, and chlorogenic acid from 2.4 to 5.1 mg/g across the four teas. Figure 1 reveals that Sencha and Longjing showed the tightest interquartile ranges for available nitrogen and organic carbon equivalents, reflecting consistent production quality. The Kenyan sample displayed the widest variability, perhaps owing to mixed clonal material in the commercial lot. Organic carbon content an indirect proxy for polyphenol precursor availability was highest in the Sencha origin soil profile [12] . Catechins dominated the polyphenolic fraction in all varieties, but Sencha's profile stood out for its high EGC content (42.3 mg/g), nearly double that of the Kenyan sample (Figure 2). PCA separated the four varieties cleanly along the first two components, which explained 87.4% of total variance. PC1 loaded heavily on EGCG and EGC, while PC2 was driven by gallic and chlorogenic acids [13] .
| Variety | EGCG | ECG | EGC | EC | Total Cat. | IC₅₀ |
|---|---|---|---|---|---|---|
| Longjing | 72.1±3.4 | 21.3±1.2 | 28.7±1.8 | 14.6±0.9 | 136.7 | 16.4±1.1 |
| Sencha | 64.8±2.9 | 26.7±1.5 | 42.3±2.4 | 23.4±1.3 | 157.2 | 13.8±0.9 |
| Darjeeling | 51.2±2.6 | 18.4±1.1 | 31.6±1.9 | 17.1±1.0 | 118.3 | 21.7±1.4 |
| Kenyan | 44.6±2.1 | 15.8±0.9 | 24.1±1.5 | 13.8±0.8 | 98.3 | 28.3±1.7 |
Table text extracted from the original PDF; superscript letters are shown inline. The original table image is below.
View original table image
Results
Results
Discussion
Sencha's total catechin content of 157.2 mg/g places it among the richest green teas reported in the literature; published values range from 80 to 180 mg/g depending on harvest flush and processing [2,4] . The shade-growing period that characterizes Sencha production increases theanine and chlorophyll interestingly, did not reduce EGCG as much as expected probably because only partial shading was applied to this particular lot [5] . Longjing's EGCG of 72.1 mg/g was the highest individual catechin across all samples, consistent with the pan-firing method that inactivates polyphenol oxidase quickly and preserves galloylated forms [14] . The near-perfect inverse correlation between EGCG and DPPH IC₅₀ (r = -0.97) is stronger than what most multicultivar comparisons report (typically r = -0.80 to -0.92), likely because we controlled for extraction solvent, temperature, and analytical platform across all four teas [10] . EGCG's three hydroxyl groups on the B ring and the gallate ester give it the highest number of hydrogen-donation sites among the four catechins, which explains its dominance in radical-scavenging assays [3] . From a market perspective, the Kenyan GFOP's lower catechin content and weaker antioxidant activity may reflect post-harvest degradation during transport rather than inherently inferior leaf quality. Kenyan teas are often shipped in bulk containers without temperature control to West African ports, a journey that can take weeks [6] . This practical concern matters for Nigerian importers who want to guarantee polyphenol content on the retail shelf. Cold-chain logistics or nitrogen-flushed packaging could close the gap [15] .
Conclusion
Japanese Sencha delivered the highest total catechin content and strongest antioxidant activity among four commercial green teas, while Kenyan GFOP performed least well. EGCG content was the single best predictor of radicalscavenging capacity. PCA separated varieties cleanly, confirming that polyphenolic profiling can serve as a quality grading tool. For the West African market, ensuring coldchain integrity during import would help preserve catechin levels from origin to shelf.
Acknowledgement
Acknowledgements Funding SourcesNo external funding was received for this research. Institutional SupportThe author thanks Sahel National University, Abuja, for HPLC and spectrophotometry access. Contributions Not Qualifying for AuthorshipMs. Ngozi Okafor assisted with sample preparation and DPPH assays.
References
15 in the original paper- Food and Agriculture Organization (FAO). Current market situation and medium-term outlook. Intergovernmental Group on Tea. Rome: FAO; 2022.
- Graham HN. Green tea composition, consumption, and polyphenol chemistry. Prev Med. 1992;21(3):334-350.
- Yang CS, Wang X, Lu G, Picinich SC. Cancer prevention by tea: animal studies, molecular mechanisms and human relevance. Nat Rev Cancer. 2009;9(6):429-439.
- Harbowy ME, Balentine DA, Davies AP, Cai Y. Tea chemistry. Crit Rev Plant Sci. 1997;16(5):415-480.
- Ku KM, Choi JN, Kim J, Kim JK, Yoo LG, Lee SJ, et al. Metabolomics analysis reveals the compositional differences of shade grown tea. J Agric Food Chem. 2010;58(1):418-426.
- Kilel EC, Faraj AK, Wanyoko JK, Wachira FN, Mwingirwa V. Green tea from purple leaf coloured tea clones in Kenya their quality characteristics. Food Chem. 2013;141(2):769-775.
- National Research Council. Prudent practices in the laboratory: handling and management of chemical hazards. Washington (DC): National Academies Press; 2011.
- International Organization for Standardization. ISO 14502-1:2005. Determination of substances characteristic of green and black tea. Part 1: content of total polyphenols in tea. Geneva: ISO; 2005.
- Wang H, Helliwell K. Determination of flavonols in green and black tea leaves and green tea infusions by high-performance liquid chromatography. Food Res Int. 2001;34(2-3):223-227.
- Brand-Williams W, Cuvelier ME, Berset C. Use of a free radical method to evaluate antioxidant activity. LWT Food Sci Technol. 1995;28(1):25-30.
- JASP Team. JASP (version 0.17). Amsterdam: University of Amsterdam; 2023.
- Tosun M, Ercisli S, Karlidag H, Sengul M. Characterization of red raspberry (Rubus idaeus L.) genotypes for their physicochemical properties. J Food Sci. 2009;74(7):C575-C579.
- Jolliffe IT, Cadima J. Principal component analysis: a review and recent developments. Philos Trans R Soc A. 2016;374(2065):20150202.
- Chen ZM, Lin Z. Tea and human health: biomedical functions of tea active components and current issues. J Zhejiang Univ Sci B. 2015;16(2):87-90.
- Friedman M, Levin CE, Lee SU, Kozukue N. Stability of green tea catechins in commercial tea leaves during storage for 6 months. J Food Sci. 2009;74(2):H47-H51.