
Research article · 2026 · Full text
International Journal of Agriculture and NutritionA study on socio-economic status of organic & inorganic redgram growers in Karnataka
Volume 8(2) · Pages 29–33 · DOI: 10.33545/26646064.2026.v8.i2a.346 ↗
Research areasAgricultural Economics and PracticesLivestock Management and Performance ImprovementOrganic Food and Agriculture
Abstract
Author-writtenThe present study aims to analyse the Socio-economic status and Income levels, asset positions of organic and inorganic redgram production in Karnataka. The Kalaburagi and Bidar districts were selected for the study based on the highest area under redgram. The study was conducted in the year 2022. The data was collected from 120 respondents constituting organic and inorganic redgram producing farmers. The findings of the study revealed that the Socio-economic characteristics of the sample farmers indicated that majority of the organic and inorganic farmers (50 %) were between the age group of 30-50 years and had completed primary school education by organic farmers. Similarly, inorganic growers completed their secondary school. Further, the most of the organic farmers (52 %) are small farmers, with an average land holding of 5 acres. Similarly, in inorganic farmers majority of them have medium land holding (51.66%) and medium level farming experience between 8-12 years. The study also concludes that, the maximum number of organic and inorganic farmers was having income level ranging from Rs.2-3 lakh per annum and belonged to other backward classes and general category.
Summary
Source-checkedPlain-language reading of the full paper, prepared with AI and checked against the text. Each point links to the authors' own words.
Why it matters
- Food quality and safety have become critical concerns for the general public. View evidence ↗
- Conventional intensive farming is noted for its potential to introduce contaminants into the food chain. View evidence ↗
- Organic farming is defined as a system that maximizes the exclusion of chemical pesticides, fertilizers, and growth regulators. View evidence ↗
The question
- The study aims to analyze the income levels, asset positions, and socio-economic status of farmers producing redgram organically and inorganically in Karnataka. View evidence ↗
What they did
- The study sampled 120 farmers in total, split equally between 60 organic and 60 inorganic redgram growers. View evidence ↗
- Socio-economic data, including assets and income, were analyzed using percentages and raw numbers. View evidence ↗
What they found
- The most common age group for both organic (56.66%) and inorganic (48.33%) farmers was 30-50 years. View evidence ↗
- Educational attainment differed by group, with most organic farmers completing primary school (41.66%) and most inorganic farmers completing secondary school (43.33%). View evidence ↗
- Inorganic farmers had a higher average landholding of approximately 7 acres compared to 5 acres for organic farmers. View evidence ↗
- Organic farmers predominantly had low experience of up to 7 years (51.66%), while inorganic farmers mostly had medium experience of 8-12 years (60.00%). View evidence ↗
- The most frequent annual income range for both groups was 2-3 lakh rupees, reported by 33.33% of organic and 40.00% of inorganic farmers. View evidence ↗
- Backward classes were the most represented social category in both groups, comprising 45.00% of organic and 50.00% of inorganic farmers. View evidence ↗
- Organic farmers were found to possess a greater amount of livestock than inorganic farmers. View evidence ↗
What it means
- The authors conclude that organic farmers in the study area are more economically and socially sound than inorganic farmers. View evidence ↗
Visual summary
2 visualsIllustrations explain the paper; charts are replotted from the paper's own table values.
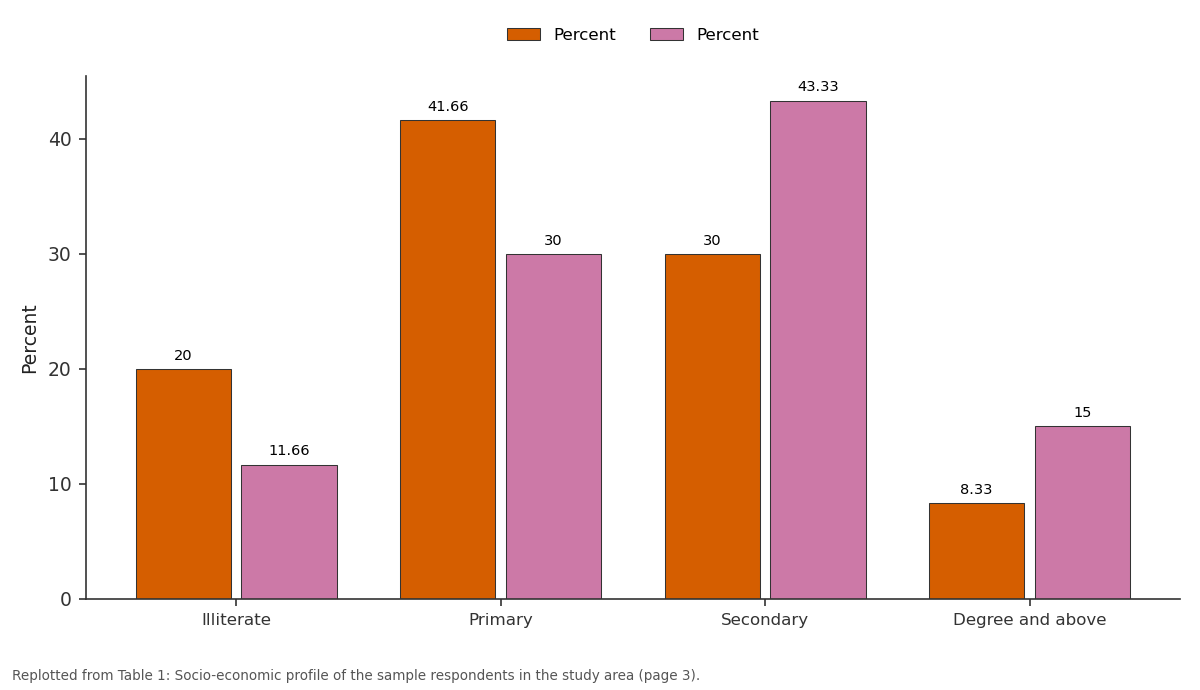
Percent and Percent: Illiterate vs Primary vs Secondary vs Degree and above
Replotted from Table 1 (page 3) of the original paper. Every bar is the paper's own table value.
View source evidence ↗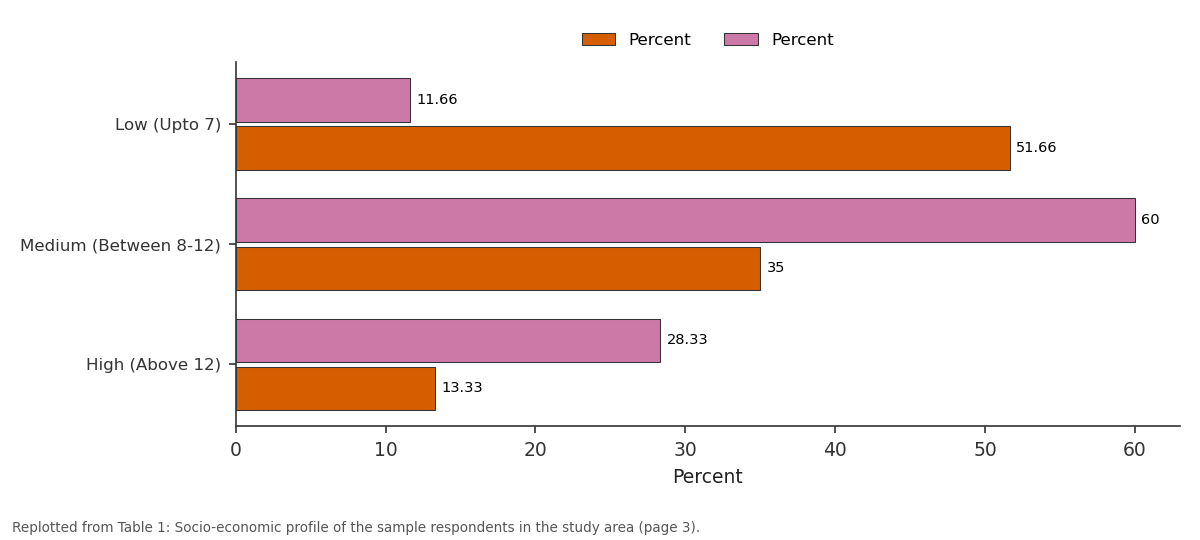
Percent and Percent: Low (Upto 7) vs Medium (Between 8-12) vs High (Above 12)
Replotted from Table 1 (page 3) of the original paper. Every bar is the paper's own table value.
View source evidence ↗Figures & tables
From the original paper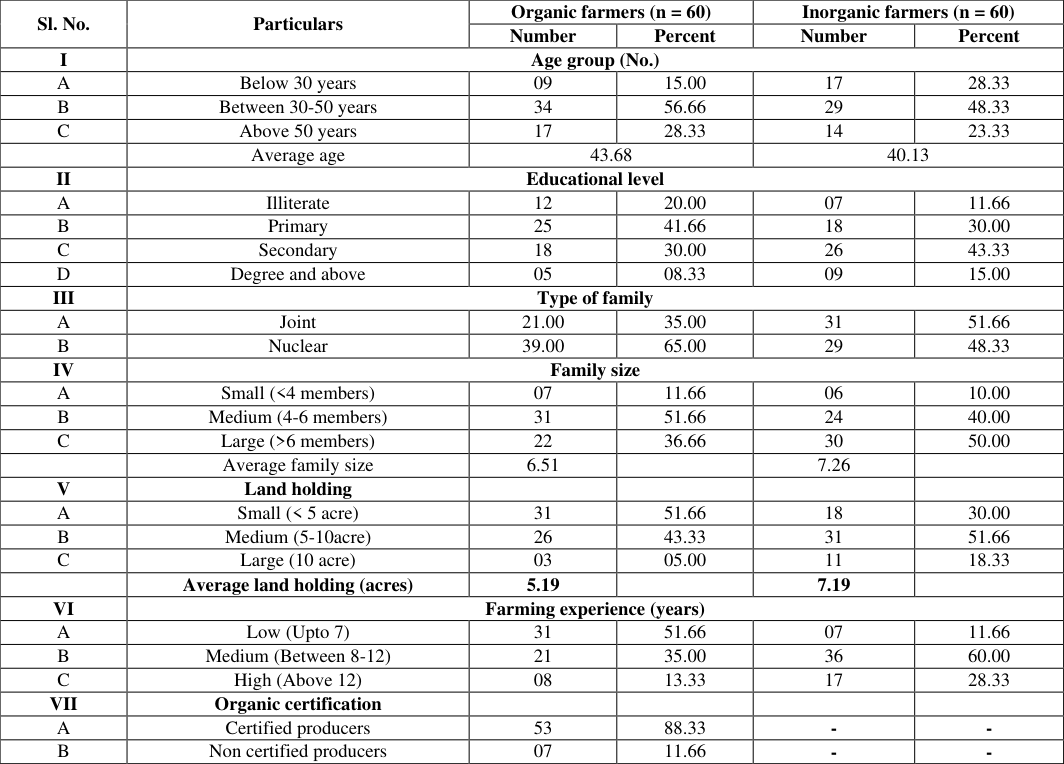 Table 1
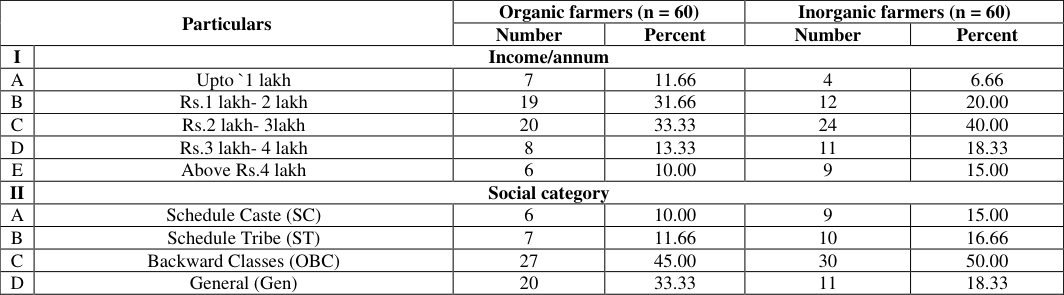 Table 2
 Table 3
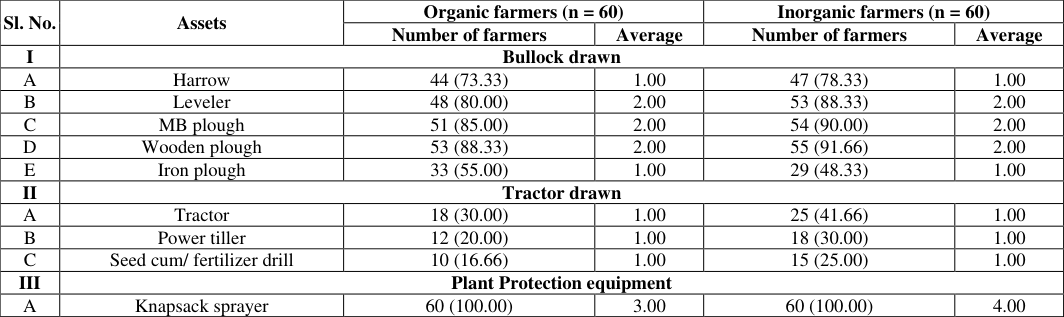 Table 4
Introduction
In the present scenario, food quality and safety are two vital factors that have attained constant attention among common people. Growing environmental awareness and several foods have substantially decreased the consumers' trust towards food quality in the last decades. Intensive conventional farming can add contamination to the food chain. For these reasons, consumers quest for safer and better foods that are produced more ecologically and authentically by local systems. Organically grown food and food products are believed to meet these demands (Rembialkowska, 2007) [3] . But agricultural production has now become stagnant and is not able to keep pace with the increasing population. So, these problems have made us think of some other alternative methods of increasing food production. In this context, organic farming has drawn the attention of agricultural scientists, farmers, and policymakers (Bhardwaj M and Dhiman M, 2019) [9] . Organically grown foods have become one of the best choices for both farmers and consumers in view of sustainability and also harvesting better yield in an eco-friendly environment (Ajayakumar, 2021) [1] . Organic farming is a production system that excludes the use of chemical fertilizers, pesticides, growth regulators, and livestock feed additives to the maximum extent possible and which promotes and enhances the health of the agro-ecosystem which includes biodiversity, biological cycles, and biological activities (Sharma A and Guled M B, 2011) [4] . Organic farming relies mainly on crop residues, animal manures, legumes, green manures, wastes, and biological pest control which aims at producing high-quality nutritional food with sustainable yield (Soumitra and Biswas, 2002, Akkamahadevi et al, 2018) [5,2] . As synthetically produced pesticides and chemical fertilizers are utilized in conventional farming, consumption of conventionally grown foods is discouraged, and for these reasons, the popularity of organic farming is increasing (Worthington, 2001) [8] . Against this backdrop, the present paper aims to study the socio-economic profile, economic and social composition.
Methodology
In this present study, Kalaburagi and Bidar districts of the Kalyana-Karnataka region were purposively selected based on the highest area under redgram crop and these are major organic redgram growing districts of the Kalyan-Karnataka region. The primary data relating to socio-economic status, information on income and economic status and asset position were also analysed for both organic and inorganic red gram production farmer's information were obtained using a pre-tested schedule. Random sampling technique was adopted for selecting appropriate sample respondents based on redgram production. Two taluks from each district were selected based on the highest area under redgram production. About thirty farmers practicing organic cultivation and thirty farmers practicing inorganic redgram cultivation were selected randomly from the taluks of selected districts. Since the area under organic redgram cultivation is limited, snowball technique was employed and interviewed using pre-determined questionnaires. In total, 120 samples constituting 60 farmers practicing organic cultivation, and 60 farmers practicing inorganic redgram cultivation were selected for the study.
Analytical Technique
Tabular presentation was employed to compile the data collected related to socio-economic condition from sample farmers. It is observed at the time of data collection that farmers of this region are more familiar with numbers as the unit of measuring the status and other variables. Hence, in this study, all calculations pertaining to the socio-economic data, income, and assets information were analysed in terms of numbers and percentages.
Results and Discussion
Results and Discussion
Socio-economic profile of sample respondents in the study area
The general socio-economic features of the sample respondents pertaining to age, educational status, family composition, and farming experience are summarized and presented in Table 1.
| Sl. No. | Particulars | Organic farmers (n = 60) | — | Inorganic farmers (n = 60) | — |
|---|---|---|---|---|---|
| Number | Percent | Number | Percent | ||
| I | Age group (No.) | ||||
| A | Below 30 years | 09 | 15.00 | 17 | 28.33 |
| B | Between 30-50 years | 34 | 56.66 | 29 | 48.33 |
| C | Above 50 years | 17 | 28.33 | 14 | 23.33 |
| Average age | 43.68 | 40.13 | |||
| II | Educational level | ||||
| A | Illiterate | 12 | 20.00 | 07 | 11.66 |
| B | Primary | 25 | 41.66 | 18 | 30.00 |
| C | Secondary | 18 | 30.00 | 26 | 43.33 |
| D | Degree and above | 05 | 08.33 | 09 | 15.00 |
| III | Type of family | ||||
| A | Joint | 21.00 | 35.00 | 31 | 51.66 |
| B | Nuclear | 39.00 | 65.00 | 29 | 48.33 |
| IV | Family size | ||||
| A | Small (<4 members) | 07 | 11.66 | 06 | 10.00 |
| B | Medium (4-6 members) | 31 | 51.66 | 24 | 40.00 |
| C | Large (>6 members) | 22 | 36.66 | 30 | 50.00 |
| Average family size | 6.51 | 7.26 | |||
| V | Land holding | ||||
| A | Small (< 5 acre) | 31 | 51.66 | 18 | 30.00 |
| B | Medium (5-10acre) | 26 | 43.33 | 31 | 51.66 |
| C | Large (10 acre) | 03 | 05.00 | 11 | 18.33 |
| Average land holding (acres) | 5.19 | 7.19 | |||
| VI | Farming experience (years) | ||||
| A | Low (Upto 7) | 31 | 51.66 | 07 | 11.66 |
| B | Medium (Between 8-12) | 21 | 35.00 | 36 | 60.00 |
| C | High (Above 12) | 08 | 13.33 | 17 | 28.33 |
| VII | Organic certification | ||||
| A | Certified producers | 53 | 88.33 | - | - |
| B | Non certified producers | 07 | 11.66 | - | - |
Table text extracted from the original PDF; superscript letters are shown inline. The original table image is below.
View original table image
From the table, it could be seen that the majority of sample respondents belonged to middle aged between 30-50 years in organic farmers (56.66%) and inorganic farmers (48.33%) with an average age of 43.68 years in organic farmers and 40.13 years in inorganic farmers. With regard to educational status, most of the organic farmers have completed their primary school (41.66%), followed by secondary school (30.00%), 8.33% went to a college degree and above, and 20.00% were illiterates. Among inorganic farmers most of the sample farmers have completed secondary school (43.33%), followed by primary school (30.00%), 15.00% have completed their college degree and above, and only 11.66% were illiterates which include school dropouts. It could be seen that among organic farmers 35.00% of them have a joint family and 65.00% belong to a nuclear family. Similarly, inorganic farmers have a joint family of about 51.66% and 48.33% belong to a nuclear family. The average family size of the sample respondents was about 6 members for organic farmers and 7 members for inorganic farmers. Wherein, the majority (51.66%) of the families were medium size with 4-6 members followed by large size (36.66%) with more than 6 members, and small size family (11.66%) consisting of less than 4 members for organic farmers. In the case of inorganic farmers, the majority (50.00%) belong to a large size with more than 6 members, followed by medium size (40.00%) with 4-6 members and small size (10.00%) with less than 4 members. The average size of the landholding of the organic farmers was about 5 acres and inorganic farmers of about 7 acres in the study area, and the majority (51.66%) of sample respondents belong to a small land holding group with less than 5 acres of land followed by medium land holding (43.33%) with 5 to 10 acres and the large holding (5.00%) with more than 10 acres of land in organic cultivation. Similarly, in the case of inorganic cultivation majority were from medium (51.66%) land holding with 5 to 10 acres, followed by small land holding group (30.00%) with less than 5 acres and the large holding (18.33%) with more than 10 acres in the study area. The table also showed that the majority of organic farmers have less (51.66%) experience up to 7 years, followed by medium experience (35.00%) with 8-12 years and more experience (13.33%) with more than 12 years. Wherein, inorganic farmers majority have medium (60.00%) experience with 8-12, followed by more experience (28.33%) with more than 12 years and less experience (11.66%) up to 7 years. Table 1 also showed that majority of the organic farmers were certified (88.33%) in the study area.
Economic status and social composition of sample respondents in the study area
The economic status and social composition of sample organic and inorganic respondents are presented in Table 2. The study indicated that majority of organic farmers (33.33%) were having annual income ranging from `2-3 lakh/annum. Similarly, the majority of inorganic farmers (40.00%) were having annual income ranging from `2-3 lakh/annum. This indicated that majority of the respondents in both organic and inorganic were having annual income of `2-3 lakh. The Table 2 also shows that, the majority of the organic farmers belonged to backward classes (45.00%), followed by the general category (33.33%), Scheduled Tribe (11.66%), and Scheduled Caste (10.00%). Similarly, among inorganic farmers majority of them belonged to backward classes (50.00%), followed by the general category (18.33%), Schedule Tribe (16.66%), and Schedule Caste (15.00%) in the study area. In general, the majority of organic farmers were illiterate and belong to the middle age group with an annual income ranging from Rs.2-3 lakh and have an average family size of 4-6 members. Similarly, the majority of the sample farmers are small landholders (< 5acre land) and have low experience of farming (46.66%) up to 7 years. These findings were in line with Maraddi et al., who reported in their study that study that half of the respondents (49.17%) possessed less farming experience followed by medium (31.67%) and more (19.17%) experience category. The majority of organic farmers are certified and belong to a backward community followed by the general category. The study indicated that middle aged farmers adopt organic production and have awareness of the harmful effects of chemical pesticides on human health which lead to soil degradation. This kind of age group helps the nation/state to promote organic farming on a very large scale and it helps in increasing yield and maximizing profit without affecting soil properties in the long run.
| Particulars | — | Organic farmers (n = 60) | — | Inorganic farmers (n = 60) | — |
|---|---|---|---|---|---|
| Number | Percent | Number | Percent | ||
| I | Income/annum | ||||
| A | Upto `1 lakh | 7 | 11.66 | 4 | 6.66 |
| B | Rs.1 lakh- 2 lakh | 19 | 31.66 | 12 | 20.00 |
| C | Rs.2 lakh- 3lakh | 20 | 33.33 | 24 | 40.00 |
| D | Rs.3 lakh- 4 lakh | 8 | 13.33 | 11 | 18.33 |
| E | Above Rs.4 lakh | 6 | 10.00 | 9 | 15.00 |
| II | Social category | ||||
| A | Schedule Caste (SC) | 6 | 10.00 | 9 | 15.00 |
| B | Schedule Tribe (ST) | 7 | 11.66 | 10 | 16.66 |
| C | Backward Classes (OBC) | 27 | 45.00 | 30 | 50.00 |
| D | General (Gen) | 20 | 33.33 | 11 | 18.33 |
Table text extracted from the original PDF; superscript letters are shown inline. The original table image is below.
View original table image
Livestock status of sample respondents in the study area
The Table 3 shows the number of respondents who owned livestock in the study area. The table depicted that among organic farmers 49 farmers had cows with an average of 2 cows per sample farmer, followed by 46 farmers have sheep with an average of 2 sheep per farmer, 40 farmers were having buffalo with an average of 1 per farmer, 36 farmers have goats and 33 farmers have poultry birds with an average of 2 animals per farmer in the study area. Whereas among inorganic farmers, 37 farmers have cows with an average of 2 per farmer, 35 farmers have sheep with an average of 2 per farmer, 34 farmers have poultry birds with an average of 2 per farmer, and 31 farmers have buffalo with an average of 1 per farmer and 27 farmers have goat with an average of 2 per farmer in the study area. The study showed that organic farmers possessed more livestock than inorganic farmers in the study area. Overall, the respondents of organic farmers are socially as well as economically sound in comparison with the respondents of inorganic farmers.
| Sl. No. | Livestock | Organic farmers (n = 60) | — | Inorganic farmers (n = 60) | — |
|---|---|---|---|---|---|
| No. of farmers | Average | No. of farmers | Average | ||
| 1 | Cow | 49 (81.66) | 2.00 | 37 (61.66) | 2.00 |
| 2 | Buffalo | 40 (66.66) | 1.00 | 31 (51.66) | 1.00 |
| 3 | Sheep | 46 (76.66) | 2.00 | 35 (58.33) | 2.00 |
| 4 | Goat | 36 (60.00) | 1.00 | 27 (45.00) | 2.00 |
| 5 | Poultry birds | 33 (55.00) | 2.00 | 34 (56.66) | 2.00 |
Table text extracted from the original PDF; superscript letters are shown inline. The original table image is below.
View original table image
Asset possession of sample respondents in the study area
The information related to asset possession presented in Table 4. The table showed that among organic farmers in bullock drawn implements 53 farmers have wooden plough with an average of 2 per farmer, 51 farmers have MB plough with an average of 2 per farmer, and 48 farmers have levelers with an average of 2 per farmer. These 3 assets among bullock drawn were mainly owned by farmers. In tractor drawn implements, 18 farmers owned tractors with an average of 1 per farmer, followed by 12 farmers owned power tiller with an average of 1 per farmer and 10 farmers have seed cum fertilizer drills with an average of 1 per farmer. In protection equipment category, 60 farmers owned knapsack sprayers with an average of 3 per farmer in the study area. Similarly, among inorganic farmers, 55 farmers have wooden plough with an average of 2 per farmer, 54 farmers have MB plough with an average of 2 per farmer, and 53 farmers have levelers with an average of 2 per farmer. These 3 assets among bullock drawn were mainly owned by farmers. In tractor drawn implements, 25 farmers owned tractor with an average of 1 per farmer, followed by 18 farmers owned power tiller with an average of 1 per farmer and 15 farmers have seed cum fertilizer drills with an average of 1 per farmer. In the protection equipment category, 60 farmers owned knapsack sprayers with an average of 4 per farmer in the study area.
| Sl. No. | Assets | Organic farmers (n = 60) | — | Inorganic farmers (n = 60) | — |
|---|---|---|---|---|---|
| Number of farmers | Average | Number of farmers | Average | ||
| I | Bullock drawn | ||||
| A | Harrow | 44 (73.33) | 1.00 | 47 (78.33) | 1.00 |
| B | Leveler | 48 (80.00) | 2.00 | 53 (88.33) | 2.00 |
| C | MB plough | 51 (85.00) | 2.00 | 54 (90.00) | 2.00 |
| D | Wooden plough | 53 (88.33) | 2.00 | 55 (91.66) | 2.00 |
| E | Iron plough | 33 (55.00) | 1.00 | 29 (48.33) | 1.00 |
| II | Tractor drawn | ||||
| A | Tractor | 18 (30.00) | 1.00 | 25 (41.66) | 1.00 |
| B | Power tiller | 12 (20.00) | 1.00 | 18 (30.00) | 1.00 |
| C | Seed cum/ fertilizer drill | 10 (16.66) | 1.00 | 15 (25.00) | 1.00 |
| III | Plant Protection equipment | ||||
| A | Knapsack sprayer | 60 (100.00) | 3.00 | 60 (100.00) | 4.00 |
Table text extracted from the original PDF; superscript letters are shown inline. The original table image is below.
View original table image
Conclusion
The Socio-economic characteristics of the sample farmers indicated that majority of the organic and inorganic farmers (50%) were between the age group of 30-50 years and had completed primary school education by organic farmers. Similarly, inorganic growers completed their secondary school. Most of the families were nuclear with a family size of less than 6 members in an organic and joint family in the case of inorganic farmers with a family size of more than 6 members. Further, most of the organic farmers (52%) are small farmers, with an average land holding of 5 acres. Majority of the sample farmers have low level farming experience of about 7 years and are certified producers. Similarly, among inorganic farmers, majority of them have medium land holding (51.66%) and medium level farming experience between 8-12 years. The study also concludes that, the maximum number of organic and inorganic farmers was having income level ranging from Rs.2-3 lakh per annum and belonged to other backward classes and general category. Whereas, in case of asset position the sample respondent in both organic and inorganic owned cows with an average of 2 per farmer and have wooden plough in bullock drawn implements as a major asset with an average of 2 per farmer. Majority of organic and inorganic farmers have participated in extension activities and also attended many training programmes.
References
9 in the original paper- Ajayakumar. Comparative economics of pigeonpea varieties developed by University of Agricultural Sciences, Raichur in Kalyana-Karnataka region [MSc (Agri) thesis]. Raichur (Karnataka): University of Agricultural Sciences, Raichur; 2021.
- Akkamahadevi Naik, Sreenivasalu M, Sreenivasa Rao, Mahesh Lankati. A study on knowledge level of farmers on organic redgram cultivation practices in dryland areas of Karnataka, India. International Journal of Current Microbiology and Applied Sciences. 2018;7(3):435-440.
- Rembialkowska E. Quality of plant products from organic agriculture. Journal of the Science of Food and Agriculture. 2007;87(15):2757-2762.
- Sharma A, Guled MB. Effect of set-furrow cultivation in pigeonpea + pearlmillet and pigeonpea + sesame intercropping systems in shallow black soil under International Journal of Agriculture and Nutrition https://www.agriculturejournal.net rainfed conditions. Karnataka Journal of Agricultural Sciences. 2011;24(5):643-650.
- Das S, Biswas BC. Organic farming prospects and problems. Fertilizer News. 2002;47(12):105-118.
- Yu TY, Kang HJ. An analysis of factors affecting rice production efficiency in Myanmar. Journal of East Asian Economic Integration. 2015;19(2):167-188.
- Uma S, Shantanu K, Deka CK, Pandey NK. Farmers' preferences for selected attributes of potato in East Khasi district of Meghalaya. Potato Journal. 2005;32(34):225-226.
- Worthington V. Nutritional quality of organic versus conventional fruits, vegetables, and grains. Journal of Alternative and Complementary Medicine. 2001;7(2):161-173.
- Bhardwaj M, Dhiman M. Growth and performance of organic farming in India: what could be the future prospects. Growth. 2019 Jan;20(01).