
Research article · 2026 · Full text
International Journal of Horticulture and Food ScienceThe Effect of Plant Spacing and Crop Geometry on Growth, Yield and Quality of Potato Cultivars (Solanum tuberosum L.)
Volume 8(2) · Pages 25–28 · DOI: 10.33545/26631067.2026.v8.i2a.480 ↗
Research areasPotato Plant ResearchLeaf Properties and Growth MeasurementCrop Yield and Soil Fertility
Abstract
Author-writtenA field experiment entitled "The Effect of Plant Spacing and Crop Geometry on Growth, Yield and Quality of Potato Cultivars (Solanum tuberosum L.)" was conducted at the Instructional Farm of the School of Agricultural Sciences, Dabok, Janardan Rai Nagar Rajasthan Vidyapeeth (Deemed-to-be University), Udaipur, Rajasthan, during the Rabi season of 2024-25.The experiment was laid out in a split-plot design with four plant spacing treatments as main plots and six potato varieties as sub-plots, replicated three times.The main plot treatments included four plant spacing: 45 cm 20 cm (S), 45 cm 25 cm (S), 60 cm 20 cm (S), and 60 cm 25 cm (S).The sub-plot treatments included six potato varieties: Kufri Atlantis (V), Kufri Frysona (V), Kufri Manik (V), Kufri Sukhyati (V), Kufri Pushkar (V), and Kufri Lima (V).The results revealed that plant spacing of 60 cm 25 cm (S) recorded the maximum plant height (58.3 cm), number of leaves per plant (32.5), leaf length (14.8 cm), leaf width (8.9 cm), number of stolons per plant (8.7), tuber diameter (6.8 cm), tuber length (9.4 cm), weight of tuber per plant (585.4 g), total soluble solids (5.8 Brix), dry matter content (21.8%), and benefit-cost ratio (4.53).However, plant spacing of 60 cm 20 cm (S) recorded the maximum yield per plot (16.2 kg), yield per hectare (243.2 q), gross returns ( 364,800 ha), and net returns ( 279,600 ha).Among the varieties, Kufri Lima (V) recorded the maximum plant height (60.2 cm), number of leaves per plant (33.8), leaf length (15.5 cm), leaf width (9.3 cm), number of stolons per plant (9.2), tuber diameter (7.1 cm), tuber length (9.8 cm), weight of tuber per plant (598.2g), yield per plot (17.9 kg), yield per hectare (268.9 q), total soluble solids (6.0 Brix), dry matter content (22.5%),net returns ( 318,850 ha), and benefit-cost ratio (4.71).
Summary
Source-checkedPlain-language reading of the full paper, prepared with AI and checked against the text. Each point links to the authors' own words.
Why it matters
- The potato is a globally significant food crop valued for its starchy tubers. View evidence ↗
- Planting distance is a critical factor for managing disease and ensuring optimal tuber size and growth. View evidence ↗
What they did
- The researchers used a split-plot design with three replications, testing four plant spacing treatments and six potato varieties. View evidence ↗
- The four spacing treatments tested were 45 cm × 20 cm, 45 cm × 25 cm, 60 cm × 20 cm, and 60 cm × 25 cm. View evidence ↗
- The six potato varieties evaluated were Kufri Atlantis, Kufri Frysona, Kufri Manik, Kufri Sukhyati, Kufri Pushkar, and Kufri Lima. View evidence ↗
- The experiment took place from November 2024 to March 2025 in Udaipur, India. View evidence ↗
What they found
- The 60 cm × 25 cm spacing (S₄) resulted in the best growth attributes, including a maximum plant height of 58.3 cm and 32.5 leaves per plant. View evidence ↗
- The 60 cm × 20 cm spacing (S₃) achieved the highest yield per hectare (243.2 q) and the highest net returns (₹ 279,600 ha⁻¹). View evidence ↗
- The 60 cm × 25 cm spacing (S₄) produced the best tuber quality and individual plant weight, with a tuber weight of 585.4 g and a benefit-cost ratio of 4.53. View evidence ↗
- Kufri Lima (V₆) was the top-performing variety across almost all metrics, including the highest yield per hectare (268.9 q) and the highest benefit-cost ratio (4.71). View evidence ↗
What it means
- The authors conclude that the combination of 60 cm × 25 cm spacing and the Kufri Lima variety is preferable for maximizing growth, yield, and quality. View evidence ↗
- The study is limited by the use of data from only one growing season. View evidence ↗
Visual summary
3 visualsIllustrations explain the paper; charts are replotted from the paper's own table values.
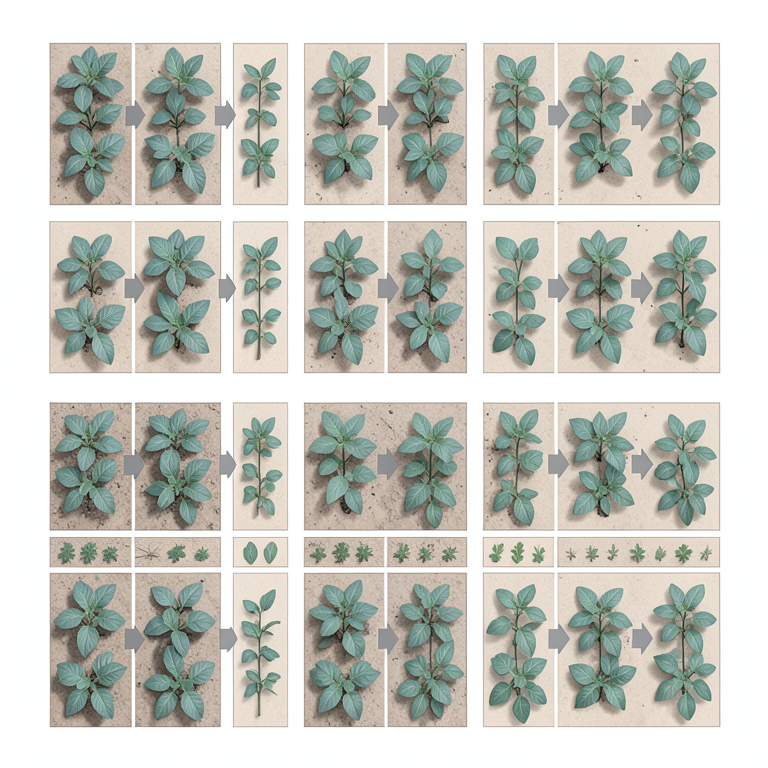
Experimental Layout Concept
AI-generated conceptual illustration (potato plants (Solanum tuberosum L.) in an agricultural field). It explains the idea and does not show study data.
View source evidence ↗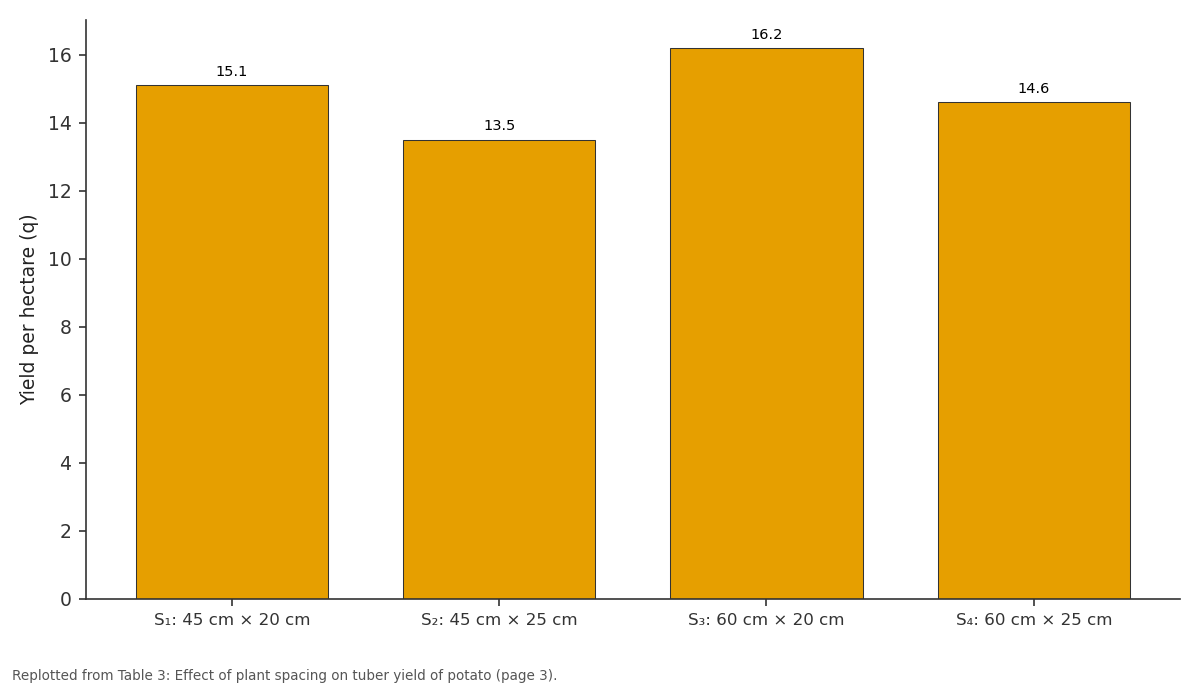
Yield per plot (kg): S₁: 45 cm × 20 cm vs S₂: 45 cm × 25 cm vs S₃: 60 cm × 20 cm vs S₄: 60 cm × 25 cm
Replotted from Table 3 (page 3) of the original paper. Every bar is the paper's own table value.
View source evidence ↗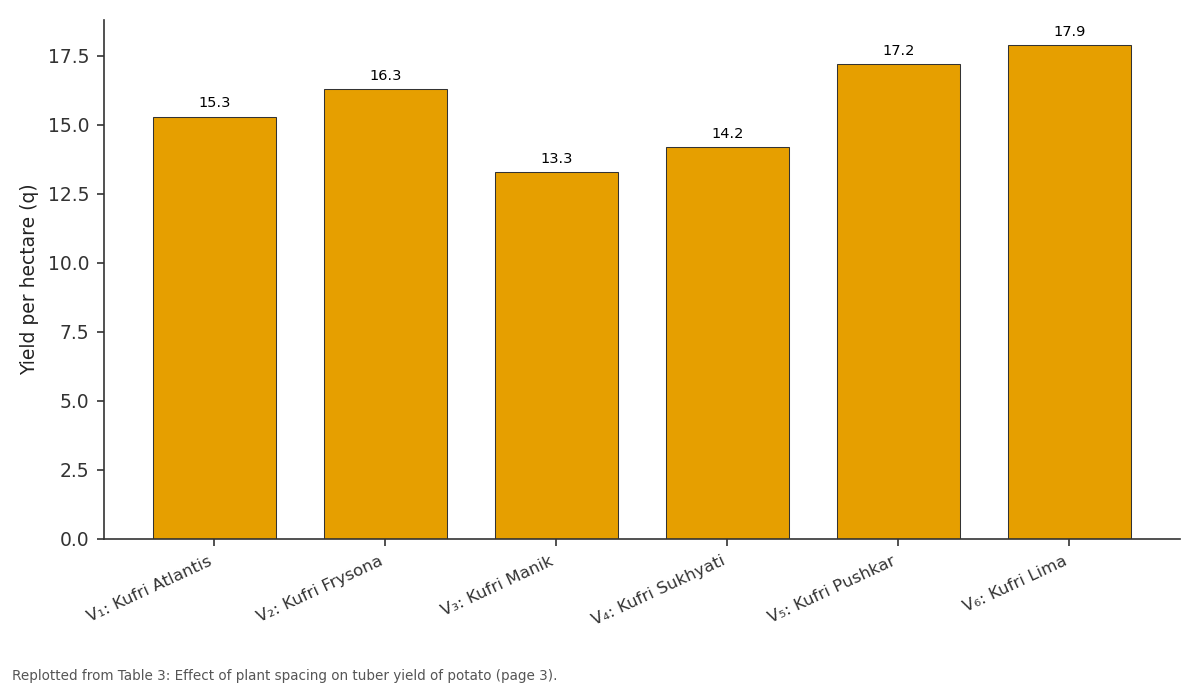
Yield per plot (kg): V₁: Kufri Atlantis vs V₂: Kufri Frysona vs V₃: Kufri Manik vs V₄: Kufri Sukhyati vs V₅: Kufri Pushkar
Replotted from Table 3 (page 3) of the original paper. Every bar is the paper's own table value.
View source evidence ↗Figures & tables
From the original paper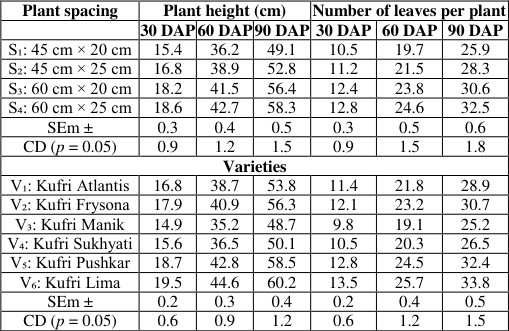 Table 1
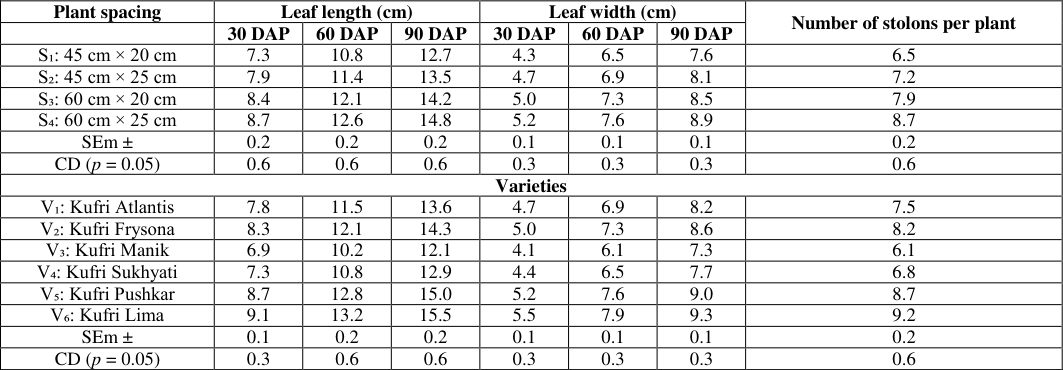 Table 2
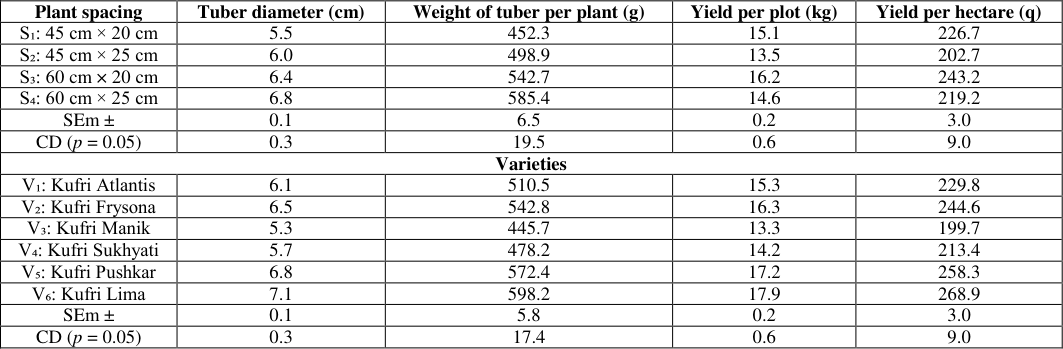 Table 3
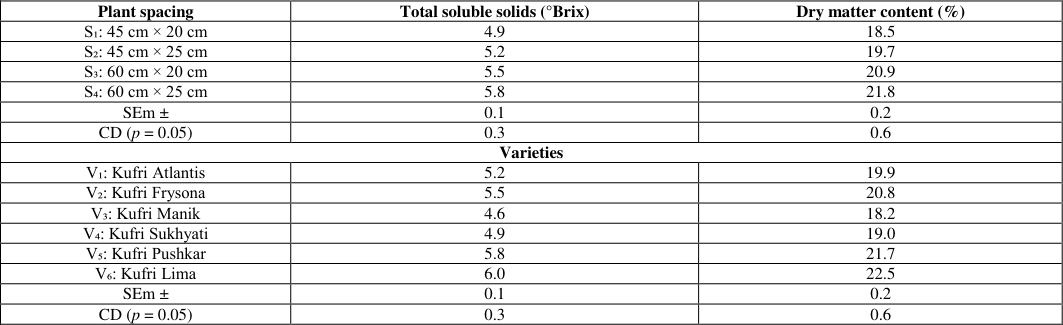 Table 4
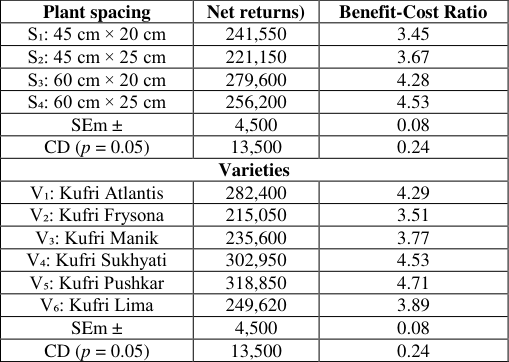 Table 5
Introduction
The potato (Solanum tuberosum) is a starchy tuber and one of the most important food crops in the world, originating in the Andes mountains of South America. It belongs to the nightshade family, Solanaceae, which includes tomatoes, eggplants, and peppers. Native to the Andean region of South America, particularly modern-day Peru and Bolivia, the potato has become one of the world's most widely cultivated crops. It is grown for its starchy underground tubers, which serve as a major source of carbohydrates. Potatoes are typically grown as annuals, although they are naturally perennial plants. They thrive in cool climates, preferring temperatures between 15-20 °C, and are sensitive to frost and excessive heat. The plant requires well-drained loamy or sandy soils with a slightly acidic pH range of 5.0-6.5. Potatoes are propagated through "seed potatoes," which are tuber pieces containing buds or "eyes" that sprout and develop into new plants. The crop is ready for harvest within 75-150 days, depending on the variety and growing conditions. India's potato production for the 2023-2024 period is estimated to be around 567.62 lakh tonnes, reflecting a significant decrease from the previous year's production of 601.42 lakh tonnes. This drop is primarily attributed to lower yields in key producing states such as Bihar and West Bengal, where adverse weather conditions impacted harvests. Despite this, potatoes remain a vital crop in India (Anonymous, 2024) [1] . The planting distance for potatoes varies depending on the variety, tuber size, growth habit, and purpose of cultivation.
Compact or small-tuber varieties, such as Kufri Ashoka and Kufri Chandramukhi, are typically planted at a spacing of 50 cm between rows and 20-25 cm between plants. Medium-sized tuber varieties, like Kufri Pukhraj and Kufri Jyoti, require 60 cm between rows and 25-30 cm between plants, making them ideal for general table or processing purposes. Large-tuber or vigorous varieties, such as Kufri Bahar and Kufri Badshah, benefit from wider spacing of 70-75 cm between rows and 30-40 cm between plants to accommodate robust growth and ensure high yields. Spacing also depends on cultivation goals, with seed potato production using closer spacing and marketable tuber production requiring wider spacing. Factors such as soil fertility, mechanization, and regional practices further influence planting distances, which play a critical role in ensuring optimal growth, tuber size, and disease management (Banjade et al., 2019) [2] .
Materials and Methods
The field experiment was carried out during November, 2024 to March, 2025 at the Horticulture farm, Department of Horticulture, School of Agricultural Sciences, Dabok, Udaipur. Geographically, Udaipur is located at 24° 34' N latitude and 73° 42' E longitude at an elevation of 582.17 meters above mean sea level (MSL). This particular part of India falls under agro climatic zone IV a i.e. "Sub-Humid Southern Plain and Aravalli Hills" of Rajasthan state. Certified seed tubers of six potato varieties (Kufri Atlantis, Kufri Frysona, Kufri Manik, Kufri Sukhyati, Kufri Pushkar, and Kufri Lima) were obtained from the Agriculture University, Kota. Medium-sized tubers (40-50 g) were selected and cut into pieces of approximately 25-30 g each, ensuring that each piece contained at least 2-3 eyes. The cut seed pieces were treated with Mancozeb @ 0.25% solution for 10 minutes to prevent fungal diseases and then air-dried in shade for 24 hours before planting. Planting was done on November. The seed pieces were placed on the ridges at specified spacing as per the treatments (20 cm and 25 cm between plants) with eyes facing upward and covered with soil to a depth of 5-7 cm.
Results and Discussion
Results and Discussion
Effect of Plant Spacing Growth attributes
Data examine in Table 1 and 2 indicate that spacing of potato recorded significant variation in growth parameters as viz., Plant height, number of leaves per plant, leaf length, leaf width, number of stolons per plant. The maximum plant height (18.6, 42.7 and 58.3 cm), number of leaves per plant (12.8, 24.6 and 32.5) leaf length (8.7, 12.6 and 14.8 cm) leaf width (5.2, 7.6 and 8.9 cm) at 30, 60 and 90 DAP, and umber of stolons per plant (8.7) was recorded with the spacing of 60 cm × 25 cm (S₄). This could be attributed to the fact that wider spacing provided more space for root development, better light interception, and reduced competition for nutrients and moisture, resulting in better vegetative growth. This could be attributed to better utilization of space, light, and nutrients by plants at wider spacing, resulting in increased leaf production and better light interception, reduced competition for nutrients and moisture, and better photosynthetic activity at wider spacing, resulting in increased leaf size Kumar et al. (2020) [6] .
| Plant spacing | Plant height (cm) | — | — | Number of leaves per plant | — | — |
|---|---|---|---|---|---|---|
| 30 DAP | 60 DAP | 90 DAP | 30 DAP | 60 DAP | 90 DAP | |
| S₁: 45 cm × 20 cm | 15.4 | 36.2 | 49.1 | 10.5 | 19.7 | 25.9 |
| S₂: 45 cm × 25 cm | 16.8 | 38.9 | 52.8 | 11.2 | 21.5 | 28.3 |
| S₃: 60 cm × 20 cm | 18.2 | 41.5 | 56.4 | 12.4 | 23.8 | 30.6 |
| S₄: 60 cm × 25 cm | 18.6 | 42.7 | 58.3 | 12.8 | 24.6 | 32.5 |
| SEm ± | 0.3 | 0.4 | 0.5 | 0.3 | 0.5 | 0.6 |
| CD (p = 0.05) | 0.9 | 1.2 | 1.5 | 0.9 | 1.5 | 1.8 |
| Varieties | ||||||
| V₁: Kufri Atlantis | 16.8 | 38.7 | 53.8 | 11.4 | 21.8 | 28.9 |
| V₂: Kufri Frysona | 17.9 | 40.9 | 56.3 | 12.1 | 23.2 | 30.7 |
| V₃: Kufri Manik | 14.9 | 35.2 | 48.7 | 9.8 | 19.1 | 25.2 |
| V₄: Kufri Sukhyati | 15.6 | 36.5 | 50.1 | 10.5 | 20.3 | 26.5 |
| V₅: Kufri Pushkar | 18.7 | 42.8 | 58.5 | 12.8 | 24.5 | 32.4 |
| V₆: Kufri Lima | 19.5 | 44.6 | 60.2 | 13.5 | 25.7 | 33.8 |
| SEm ± | 0.2 | 0.3 | 0.4 | 0.2 | 0.4 | 0.5 |
| CD (p = 0.05) | 0.6 | 0.9 | 1.2 | 0.6 | 1.2 | 1.5 |
Table text extracted from the original PDF; superscript letters are shown inline. The original table image is below.
View original table image
Yield attributes and yield
A glance of the data represented in Table 3 clearly revealed in yield parameter. Tuber diameter, tuber length, weight of tuber per plant, yield per plot and yield per hectare Significantly increase in yield of spacing and varieties and. The maximum tuber diameter (6.8 cm), tuber length (9.4 cm), tuber per plant (585.4 g), yield per plot (16.2 kg), yield per hectare (243.2 q). This could be attributed to better root development, reduced competition for nutrients and moisture, and better photosynthetic activity at wider spacing, resulting in increased tuber size. Similar results were reported by Raj et al. (2016) [10] in Kufri Alankar and Poudel et al. (2018) [9] in Kufri Jyoti, who observed that tuber diameter and length increased with wider spacing. Reduced competition for nutrients and moisture, and better photosynthetic activity at wider spacing, resulting in increased tuber size and weight. Similar results were reported by Fetena (2017) [3] in Kufri Jyoti, who observed that the optimum spacing for maximum yield was a balance between the number of plants per unit area and the weight of tubers per plant.
| Plant spacing | Tuber diameter (cm) | Weight of tuber per plant (g) | Yield per plot (kg) | Yield per hectare (q) |
|---|---|---|---|---|
| S₁: 45 cm × 20 cm | 5.5 | 452.3 | 15.1 | 226.7 |
| S₂: 45 cm × 25 cm | 6.0 | 498.9 | 13.5 | 202.7 |
| S₃: 60 cm × 20 cm | 6.4 | 542.7 | 16.2 | 243.2 |
| S₄: 60 cm × 25 cm | 6.8 | 585.4 | 14.6 | 219.2 |
| SEm ± | 0.1 | 6.5 | 0.2 | 3.0 |
| CD (p = 0.05) | 0.3 | 19.5 | 0.6 | 9.0 |
| Varieties | ||||
| V₁: Kufri Atlantis | 6.1 | 510.5 | 15.3 | 229.8 |
| V₂: Kufri Frysona | 6.5 | 542.8 | 16.3 | 244.6 |
| V₃: Kufri Manik | 5.3 | 445.7 | 13.3 | 199.7 |
| V₄: Kufri Sukhyati | 5.7 | 478.2 | 14.2 | 213.4 |
| V₅: Kufri Pushkar | 6.8 | 572.4 | 17.2 | 258.3 |
| V₆: Kufri Lima | 7.1 | 598.2 | 17.9 | 268.9 |
| SEm ± | 0.1 | 5.8 | 0.2 | 3.0 |
| CD (p = 0.05) | 0.3 | 17.4 | 0.6 | 9.0 |
Table text extracted from the original PDF; superscript letters are shown inline. The original table image is below.
View original table image
Quality parameters
The data regarding the effect of spacing and varieties on total soluble solids and dry matter in tuber of potato have been presented in Table . The maximum TSS (5.8 °Brix), dry matter content (21.8%) were found in treatment spacing of 60 cm × 25 cm (S₄). This could be attributed to better root development, reduced competition for nutrients and moisture, and better photosynthetic activity at wider spacing, resulting in increased accumulation of sugars and other soluble solids in the tubers. Similar results were reported by Singh et al. Kufri Bahar, who observed that total soluble solids content increased with wider spacing. This could be attributed to better root development, reduced competition for nutrients and moisture, and better photosynthetic activity at wider spacing, resulting in increased accumulation of carbohydrates and other dry matter components in the tubers. Similar results were reported by Caldiz.
Economics
A keen observation of data Table 5 revealed that the spacing on economics. The maximum net returns (₹ 279,600 ha⁻¹) and benefit-cost ratio (4.28) were recorded with the spacing of 60 cm × 20 cm (S₃).
| Plant spacing | Net returns) | Benefit-Cost Ratio |
|---|---|---|
| S₁: 45 cm × 20 cm | 241,550 | 3.45 |
| S₂: 45 cm × 25 cm | 221,150 | 3.67 |
| S₃: 60 cm × 20 cm | 279,600 | 4.28 |
| S₄: 60 cm × 25 cm | 256,200 | 4.53 |
| SEm ± | 4,500 | 0.08 |
| CD (p = 0.05) | 13,500 | 0.24 |
| Varieties | ||
| V₁: Kufri Atlantis | 282,400 | 4.29 |
| V₂: Kufri Frysona | 215,050 | 3.51 |
| V₃: Kufri Manik | 235,600 | 3.77 |
| V₄: Kufri Sukhyati | 302,950 | 4.53 |
| V₅: Kufri Pushkar | 318,850 | 4.71 |
| V₆: Kufri Lima | 249,620 | 3.89 |
| SEm ± | 4,500 | 0.08 |
| CD (p = 0.05) | 13,500 | 0.24 |
Table text extracted from the original PDF; superscript letters are shown inline. The original table image is below.
View original table image
Effect of Varieties Growth attributes
The plant height was significantly influenced by different potato varieties at all the growth stages (Table 1 and2). At 30 DAP, the maximum plant height (19.5, 44.6 and60.2 cm), number of leaves per plant (13.5, 25.7 and 33.8), leaf length (9.1, 13.2 and 15.5 cm), leaf width (5.5, 7.9 and 9.3 cm) at 30, 60 and 90 DAP and number of stolons per plant (9.2) was recorded in Kufri Lima (V₆). The variation in the number of leaves per plant among the varieties could be attributed to their genetic makeup and growth characteristics. Similar varietal differences in the growth of plant were observed by Khan (2018) [5] in different potato varieties.
Yield attributes and yield
Among the varieties, Kufri Lima (V₆) recorded the maximum yield like tuber diameter (7.1 cm), tuber length (9.8 cm), weight of tuber per plant (598.2 g), yield per plot (17.9 kg), yield per hectare (268.9 q). The variation in yield among the varieties could be attributed to their genetic makeup, growth characteristics, and adaptation to the local environment. Similar varietal differences in yield were observed by Lavanya et al. (2017) [7] in different potato varieties.
Quality parameters
Total soluble solids (6.0 °Brix), dry matter content (22.5%), gross returns (₹ 403,350 ha⁻¹). The variation in total soluble solids content among the varieties could be attributed to their genetic makeup and physiological characteristics. Similar varietal differences in total soluble solids content were observed by Singh et al. in different potato varieties. The variation in dry matter content among the varieties could be attributed to their genetic makeup and physiological characteristics. Similar varietal differences in dry matter content were observed by Linta et al. (2018) [8] in different potato varieties.
Economics
Among the varieties, Kufri Lima (V₆) recorded the maximum net returns, and benefit-cost ratio net returns (₹ 318,850 ha⁻¹), and benefit-cost ratio (4.71). The variation in economic parameters among the varieties could be attributed to their yield potential and market value. Similar varietal differences in economic parameters were observed by Khalafalla et al. (2001) [4] in different potato varieties.
Conclusion
On the basis of present investigation entitled "The Effect of Plant Spacing and Crop Geometry on Growth, Yield and Quality of Potato Cultivars (Solanum tuberosum L.)" it may be concluded that treatment results of the present investigation.
It may be concluded that for higher growth, yield and quality of potato was recorded with the spacing of 60 cm × 25 cm (S₄) and Kufri Lima (V₆) should prefer over other combination.
The observations are based on one season data, to get more precise information, it is suggested that the experiment.
Acknowledgement
AcknowledgementAuthors are grateful to the department of Horticulture, School of Agricultural Sciences, JRNRV University, Udaipur for providing facility during research work.
Figures and tables from the paper
| Plant spacing | Leaf length (cm) | — | — | Leaf width (cm) | — | — | Number of stolons per plant |
|---|---|---|---|---|---|---|---|
| 30 DAP | 60 DAP | 90 DAP | 30 DAP | 60 DAP | 90 DAP | ||
| S₁: 45 cm × 20 cm | 7.3 | 10.8 | 12.7 | 4.3 | 6.5 | 7.6 | 6.5 |
| S₂: 45 cm × 25 cm | 7.9 | 11.4 | 13.5 | 4.7 | 6.9 | 8.1 | 7.2 |
| S₃: 60 cm × 20 cm | 8.4 | 12.1 | 14.2 | 5.0 | 7.3 | 8.5 | 7.9 |
| S₄: 60 cm × 25 cm | 8.7 | 12.6 | 14.8 | 5.2 | 7.6 | 8.9 | 8.7 |
| SEm ± | 0.2 | 0.2 | 0.2 | 0.1 | 0.1 | 0.1 | 0.2 |
| CD (p = 0.05) | 0.6 | 0.6 | 0.6 | 0.3 | 0.3 | 0.3 | 0.6 |
| Varieties | |||||||
| V₁: Kufri Atlantis | 7.8 | 11.5 | 13.6 | 4.7 | 6.9 | 8.2 | 7.5 |
| V₂: Kufri Frysona | 8.3 | 12.1 | 14.3 | 5.0 | 7.3 | 8.6 | 8.2 |
| V₃: Kufri Manik | 6.9 | 10.2 | 12.1 | 4.1 | 6.1 | 7.3 | 6.1 |
| V₄: Kufri Sukhyati | 7.3 | 10.8 | 12.9 | 4.4 | 6.5 | 7.7 | 6.8 |
| V₅: Kufri Pushkar | 8.7 | 12.8 | 15.0 | 5.2 | 7.6 | 9.0 | 8.7 |
| V₆: Kufri Lima | 9.1 | 13.2 | 15.5 | 5.5 | 7.9 | 9.3 | 9.2 |
| SEm ± | 0.1 | 0.2 | 0.2 | 0.1 | 0.1 | 0.1 | 0.2 |
| CD (p = 0.05) | 0.3 | 0.6 | 0.6 | 0.3 | 0.3 | 0.3 | 0.6 |
Table text extracted from the original PDF; superscript letters are shown inline. The original table image is below.
View original table image
| Plant spacing | Total soluble solids (°Brix) | Dry matter content (%) |
|---|---|---|
| S₁: 45 cm × 20 cm | 4.9 | 18.5 |
| S₂: 45 cm × 25 cm | 5.2 | 19.7 |
| S₃: 60 cm × 20 cm | 5.5 | 20.9 |
| S₄: 60 cm × 25 cm | 5.8 | 21.8 |
| SEm ± | 0.1 | 0.2 |
| CD (p = 0.05) | 0.3 | 0.6 |
| Varieties | ||
| V₁: Kufri Atlantis | 5.2 | 19.9 |
| V₂: Kufri Frysona | 5.5 | 20.8 |
| V₃: Kufri Manik | 4.6 | 18.2 |
| V₄: Kufri Sukhyati | 4.9 | 19.0 |
| V₅: Kufri Pushkar | 5.8 | 21.7 |
| V₆: Kufri Lima | 6.0 | 22.5 |
| SEm ± | 0.1 | 0.2 |
| CD (p = 0.05) | 0.3 | 0.6 |
Table text extracted from the original PDF; superscript letters are shown inline. The original table image is below.
View original table image
References
10 in the original paper- Anonymous. National Horticulture Board, Dept. of Agri. Coop. & Farmers Welfare, Government of India. 2024.
- Banjade S, Shrestha SM, Pokharel N, Pandey D, Rana M. Evaluation of growth and yield attributes of commonly grown potato (Solanum tuberosum L.) varieties at Kavre, Nepal. International Journal of Scientific and Research Publications. 2019;9(11):134142.
- Fetena S, Eshetu B. Evaluation of potato (Solanum tuberosum L.) varieties for yield attributes. Journal of Biology, Agriculture and Healthcare. 2017;7(21):1-?.
- Khalafalla AM. Effect of plant density and seed size on growth and yield of Solanum tuberosum in Khartoum State, Sudan. African Crop Science Journal. 2001;9(1):77-82.
- Khan A. Evaluation of potato (Solanum tuberosum L.) genotypes for yield and phenotypic quality traits under subtropical climate. Journal of Agricultural Research. 2018;6(4):79-85.
- Kumar V, Malik A, Sharma S, Rai DV. Effect of nitrogen and potassium on the growth, yield and quality of potato crop (Solanum tuberosum L.). Int J Sci & Engineering Res. 2020;8(7):68-76.
- Lavanya KS, Srinivasa V, Devaraju D, Lakshmana, Ali, Shahid K, Kadian MS, Archana R, Nandini KS. Performance of potato (Solanum tuberosum L.) genotypes under hill zone of Karnataka. Res Environ Life Sci. 2017;10(8):677-679.
- Linta A, Ahmad H, Jahan MR, Islam MS, Uddin AFM. Evaluation of growth and yield characteristics of twenty two potato germplasm at Sher-e-Bangla Agricultural University. Journal of Bioscience and Agriculture Research. 2018;16(1):1324-1329.
- Poudel K, Shah MK, Prasai HK, Upadhyay KP. Performance of different genotypes of potatoes (Solanum tuberosum L.) under eastern mid hills conditions. Journal of Nepal Agricultural Research Council. 2018;3:92-95.
- Raj K, Jaiswal RK, Asati KP, Mishra VK, Prajapati H, Maheshwari A, Dhurwey JS. Performance of potato varieties for morphological and yield characters under Malwa region of Madhya Pradesh. Annals of Plant and Soil Research. 2016;18(3):270-274.