
Research article · 2026 · Full text
International Journal of Horticulture and Food ScienceStudies on performance of Onion (Allium cepa L.) Genotypes for Growth, Yield, Quality and Pest Incidence during Rabi 2024-25
Volume 8(1) · Pages 101–107 · DOI: 10.33545/26631067.2026.v8.i1b.461 ↗
Research areasGarlic and Onion StudiesAgricultural Practices and Plant GeneticsShallot Cultivation and Analysis
Abstract
Author-writtenOnion (Allium cepa L.) is a vital vegetable crop in India, with significant economic importance. This study evaluated 50 onion genotypes for growth, yield, bulb quality and pest incidence during the rabi season of 2024-25 at Dharwad, Karnataka. Analysis of variance (ANOVA) revealed significant genotypic differences for all traits. High-performing genotypes including NHRDF Red-2 (50.89 t/ha bulb yield), NHRDF Red-4 (47.72 t/ha) and Bhima Raj (46.42 t/ha). Genotypes like Telagi-L exhibited thin neck thickness (0.52 cm), while DOGR-1771 showed high dry matter content (18.42 g). Low pest incidence was observed in NHRDF Red-4 (0% purple blotch) and Arakera local (0.51 thrips/plant). These findings identify superior genotypes for cultivation and hybridization in similar agro-climatic zones.
Summary
Source-checkedPlain-language reading of the full paper, prepared with AI and checked against the text. Each point links to the authors' own words.
Why it matters
- Onion is a critical vegetable crop in India and holds significant economic value. View evidence ↗
- Indian onion productivity is lower than that of the USA, which reaches 55.95 t/ha, largely because of a lack of hybrids. View evidence ↗
- Because the performance of different onion genotypes varies by region, it is necessary to evaluate them for stability. View evidence ↗
The question
- The study aimed to assess the performance of 50 onion genotypes during the Rabi 2024-25 season in Dharwad. View evidence ↗
What they did
- The experiment used a randomized complete block design with two replications, with seeds sown in October 2024 and transplanted in November into raised beds. View evidence ↗
- The study measured various growth, yield, and quality traits, as well as the incidence of purple blotch and thrips. View evidence ↗
What they found
- Statistical analysis showed that there were significant differences between the genotypes for every trait measured. View evidence ↗
- Bulb yield varied significantly across genotypes, ranging from a low of 30.94 t/ha for W-405 to a high of 50.89 t/ha for NHRDF Red-2. View evidence ↗
- In terms of growth, Bhima Raj had the maximum plant height at 54.75 cm, whereas Bhima Light Red had the minimum at 38.00 cm. View evidence ↗
- The genotype Telagi-L exhibited the thinnest neck at 0.52 cm, which is a desirable trait for storage. View evidence ↗
- Quality traits varied, with DOGR-1771 showing high dry matter (18.42 g) and GJWO-3 having the highest total soluble solids (15.59 °Brix). View evidence ↗
- Resistance to pests varied, with NHRDF Red-4 and NHRDF Red-2 showing 0% purple blotch, and Arakera local having the lowest thrips incidence at 0.51 per plant. View evidence ↗
What it means
- The authors concluded that NHRDF Red-2, NHRDF Red-4, Bhima Raj, and Balichakra-R are the best performing genotypes for yield and quality. View evidence ↗
- Genotypes such as Telagi-L and Arakera local are recommended for breeding programs due to their thin necks, low bolting, and pest tolerance. View evidence ↗
- The authors state that further trials across multiple locations are necessary to ensure stability. View evidence ↗
Visual summary
3 visualsIllustrations explain the paper; charts are replotted from the paper's own table values.
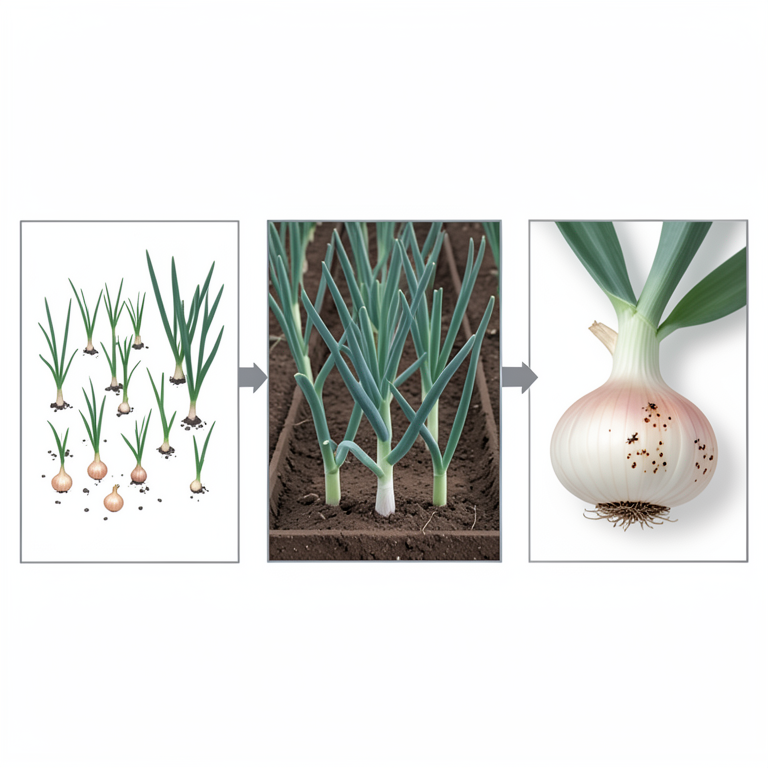
Experimental Workflow
AI-generated conceptual illustration (Onion plants (Allium cepa L.)). It explains the idea and does not show study data.
View source evidence ↗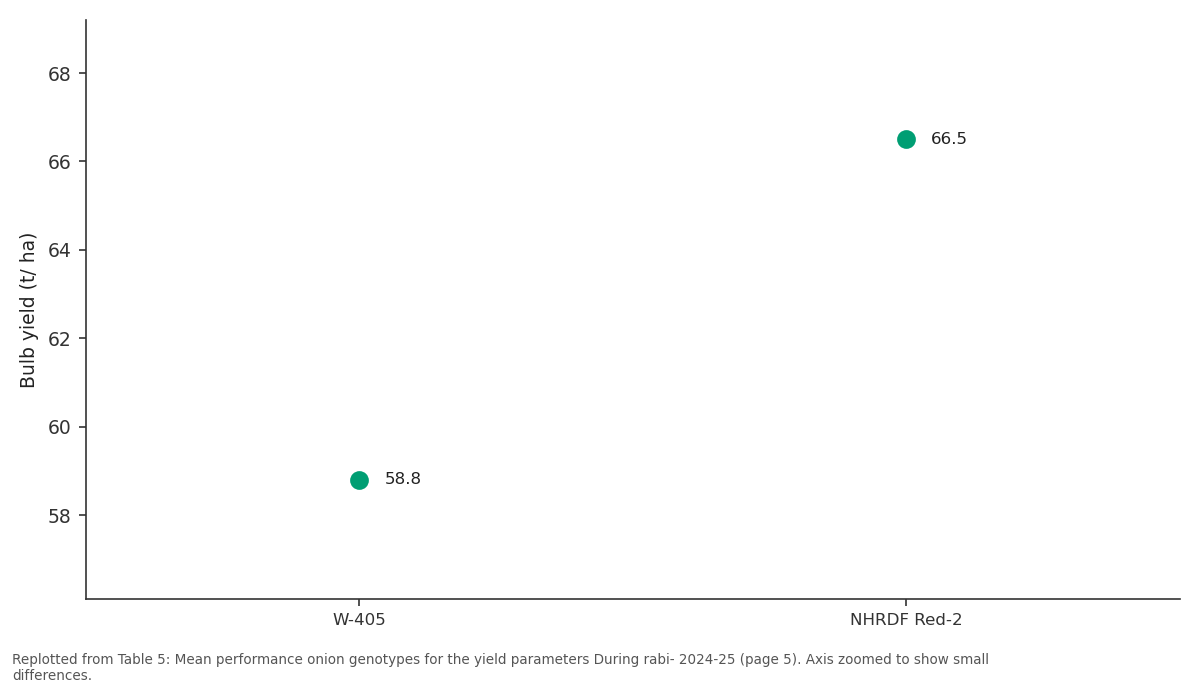
Average weight of bulb: W-405 vs NHRDF Red-2
Replotted from Table 5 (page 5) of the original paper. Every bar is the paper's own table value.
View source evidence ↗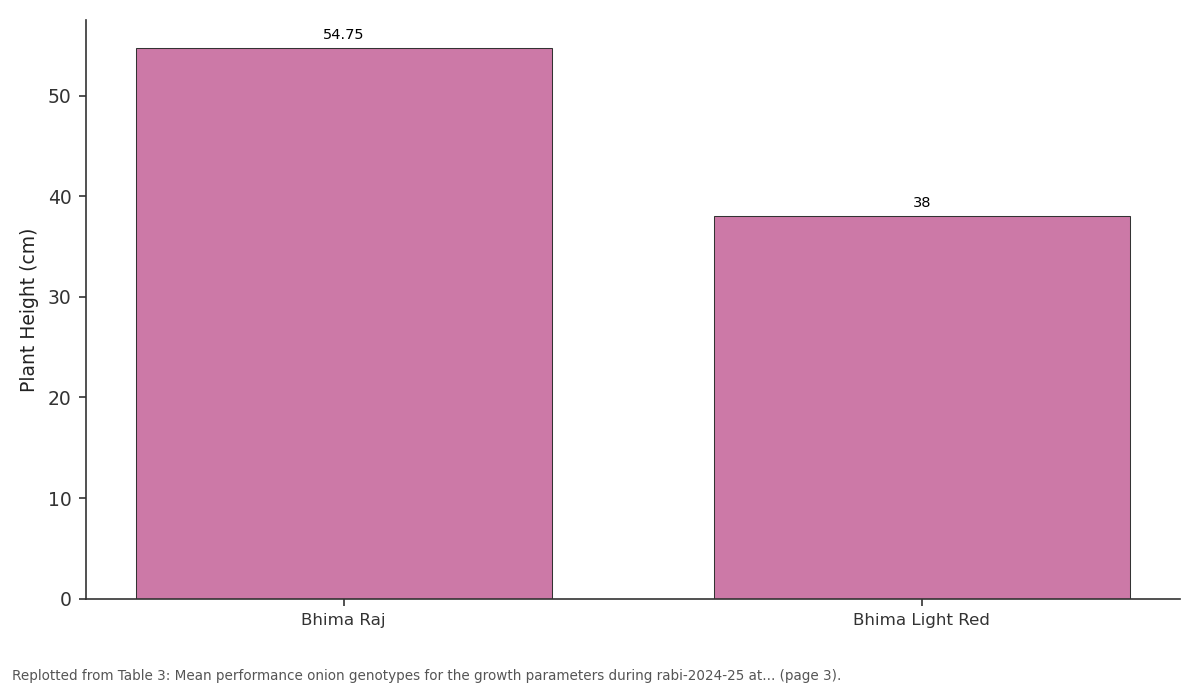
Plant Height (cm): Bhima Raj vs Bhima Light Red
Replotted from Table 3 (page 3) of the original paper. Every bar is the paper's own table value.
View source evidence ↗Figures & tables
From the original paper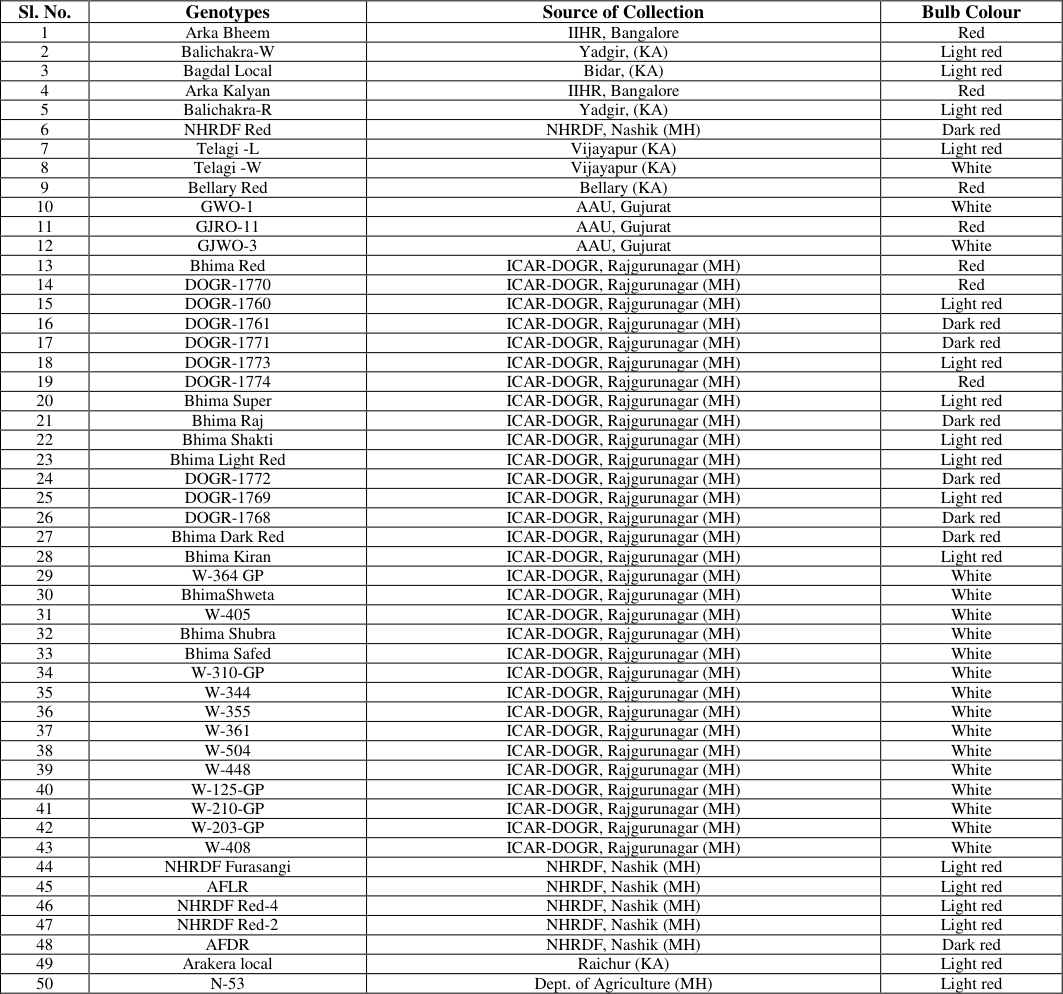 Table 1
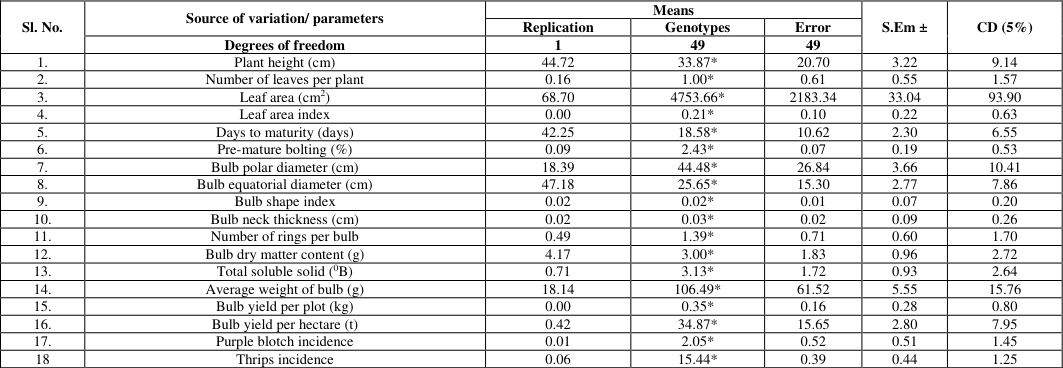 Table 2
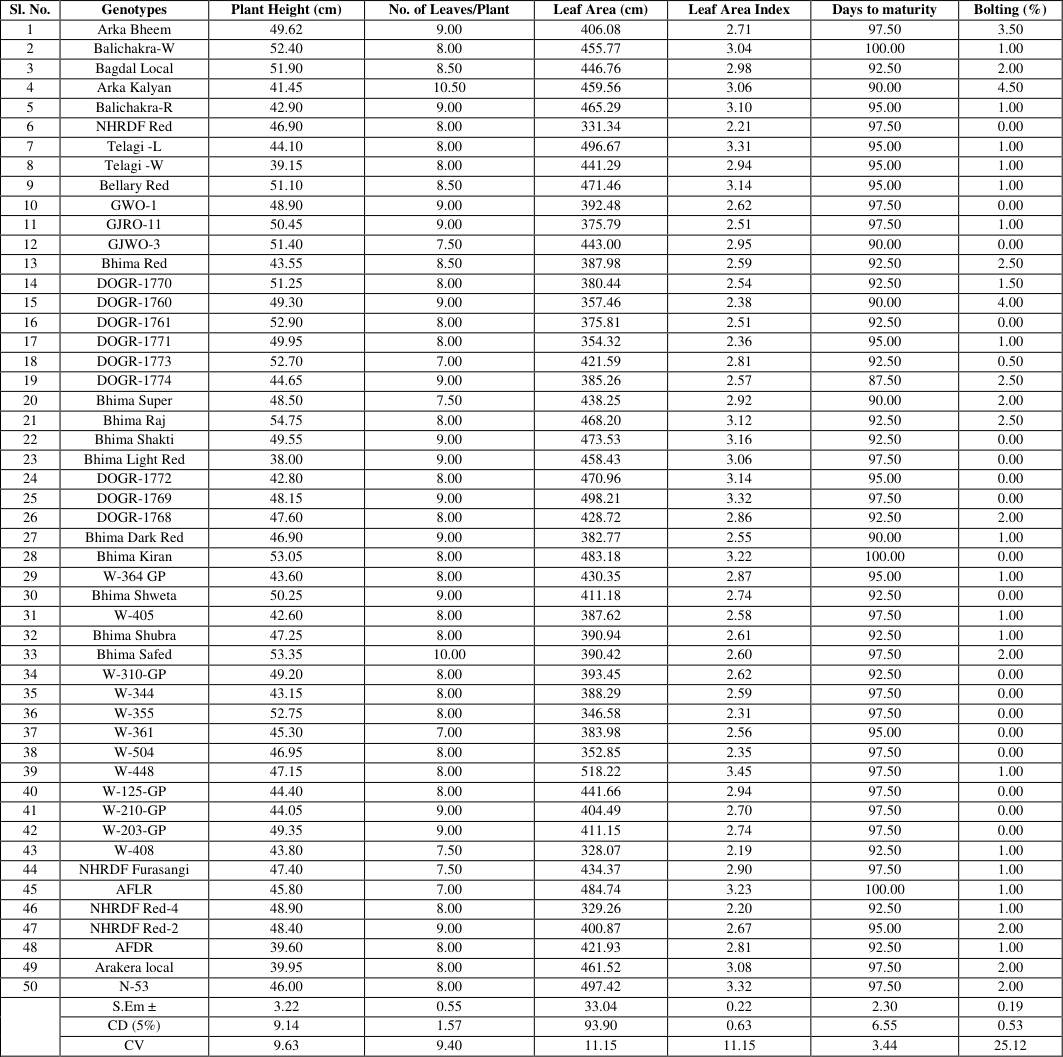 Table 3
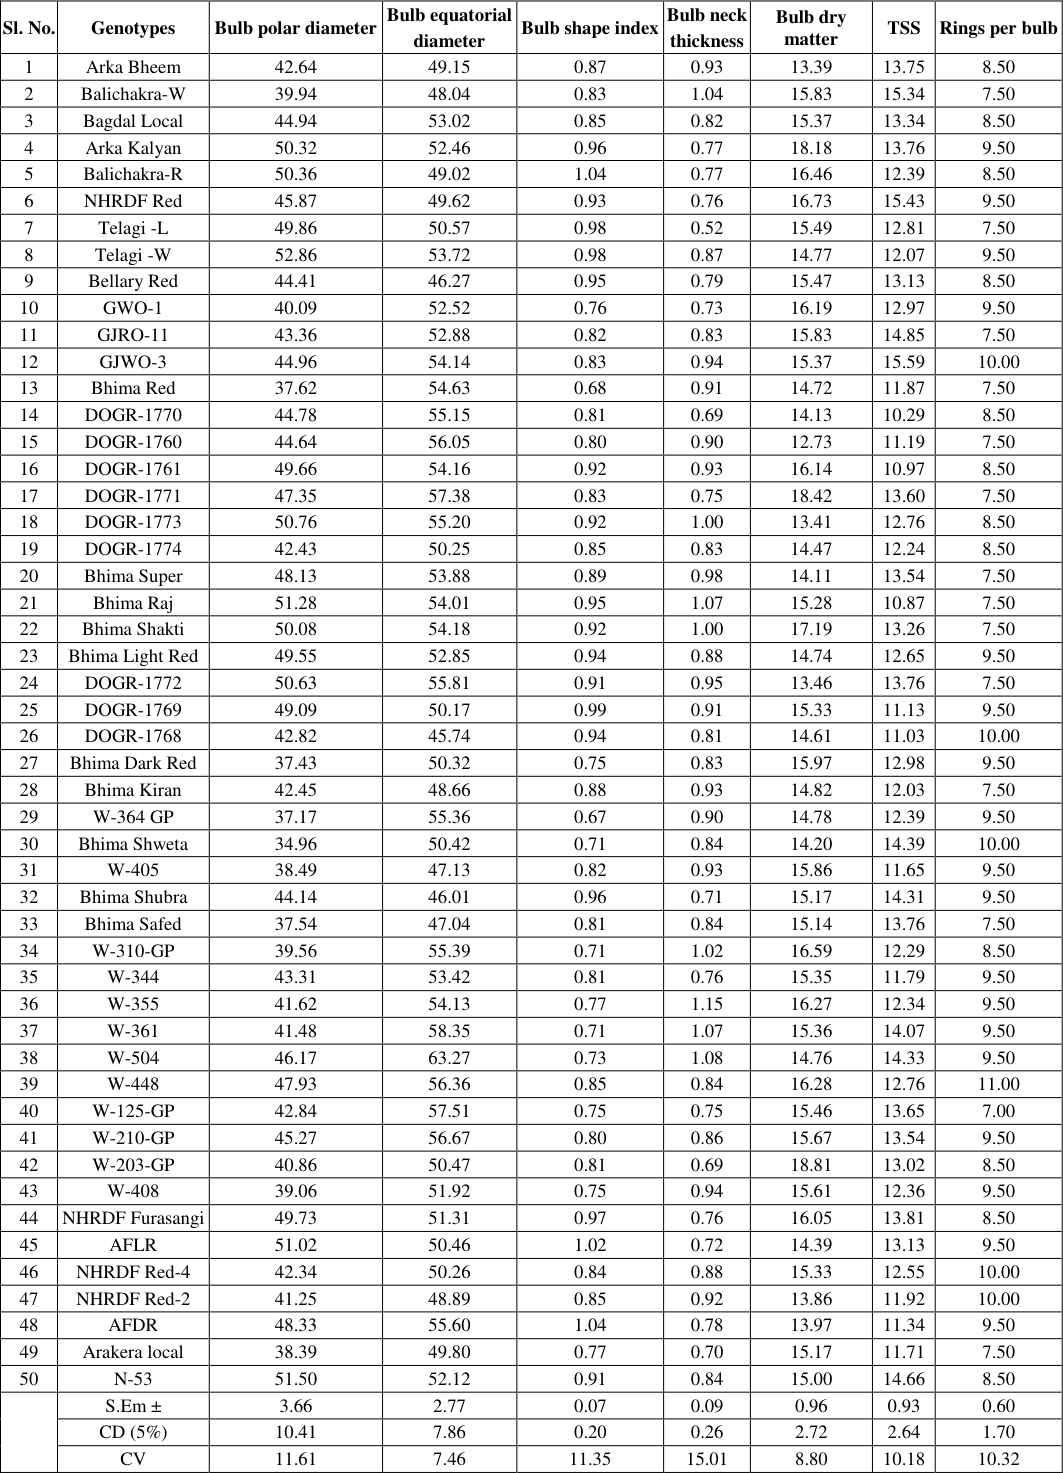 Table 4
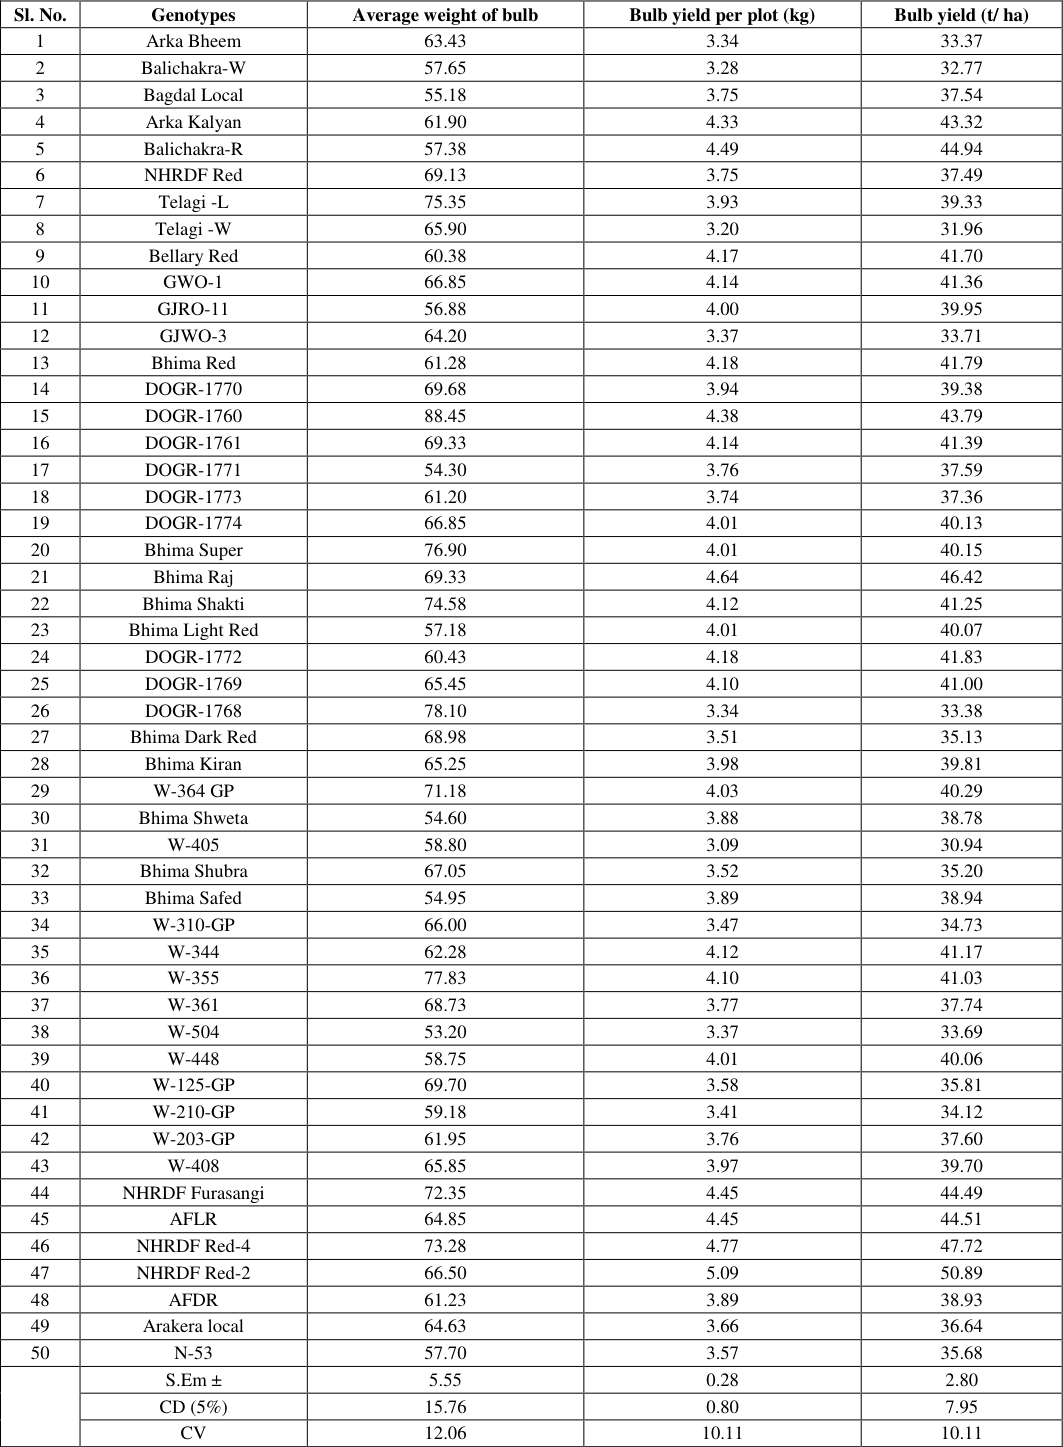 Table 5
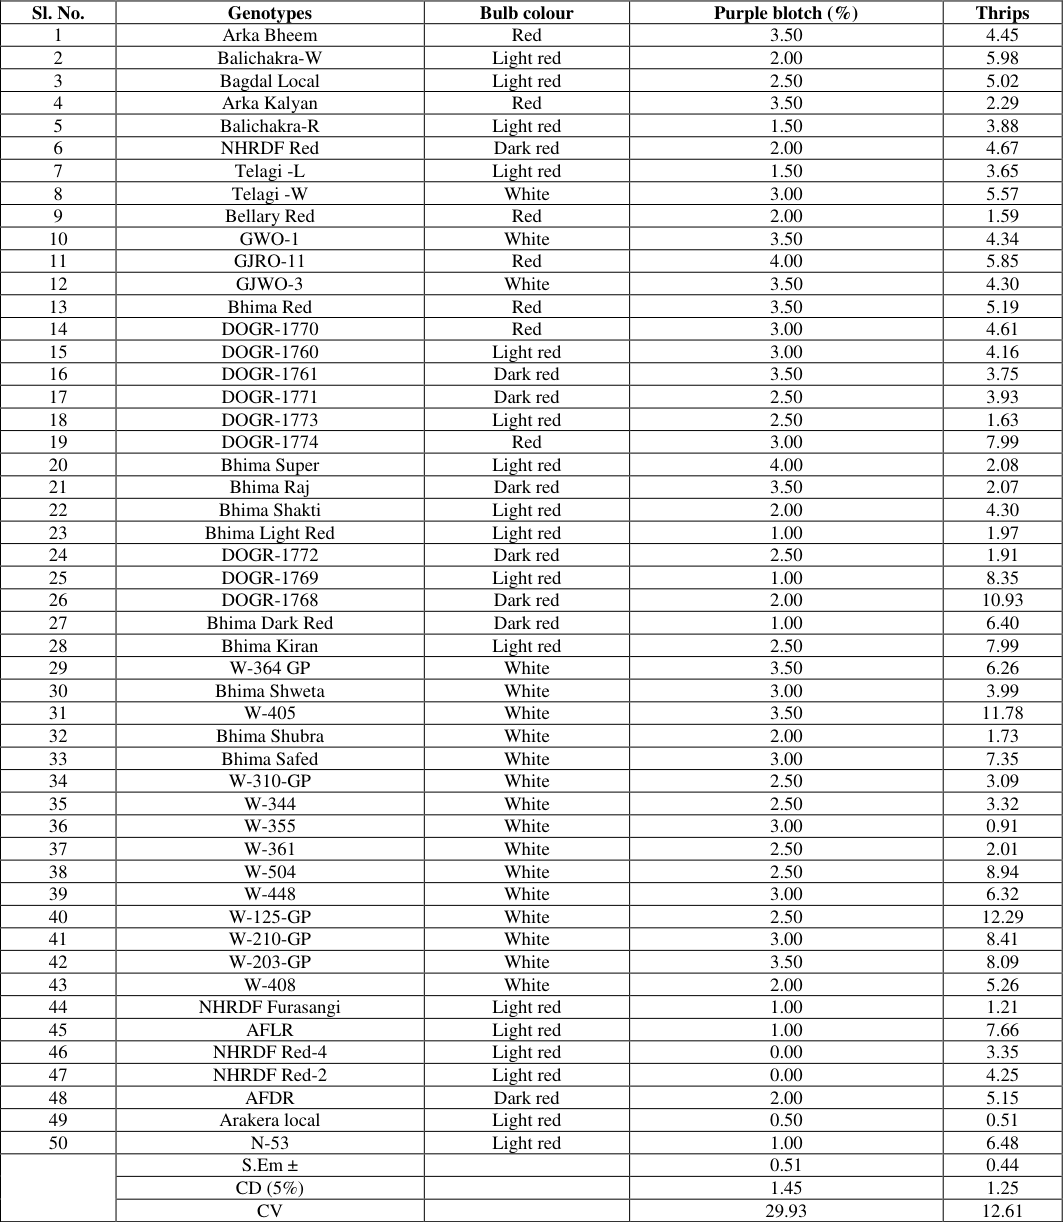 Table 6
Introduction
Onion (Allium cepa L.), a biennial herb in the Alliaceae family with 2n = 16 chromosomes, originates from Central Asia and ranks fourth among global vegetables (Best, 2000; McCollum, 1976). Known as Pyaz in Hindi and Ullagaddi in Kannada, it is used in salads, cooking, and dehydration. Its nutritional profile includes 86.6 g moisture, 1.2 g protein, and vitamins like C (119 g) per 100 g edible portion. Medicinal benefits include anticarcinogenic and anti-thrombotic effects from flavonoids and sulfur compounds. In India, onion covers 1.537 million ha, producing 24.212 million tonnes at 16.10 t/ha, with Karnataka contributing 0.255 million ha and 2.049 million tonnes at 14.17 t/ha (Anonymous, 2024). Export earnings reach ₹3,513.22 crore from 2.60 million tonnes. Productivity lags behind the USA (55.95 t/ha) due to limited hybrids. Onion requires 12-13 hour day lengths for Rabi varieties and temperatures of 15.5-25 °C for bulbing (Thamburaj and Singh, 2019) [14] . Genotypic performance varies by region, necessitating evaluations for stability (Malik et al., 2024; Gupta et al., 2024) [10,8] . Genetic research is limited by the crop's biology (Chattoo and Angrej, 2015) [5] . This study assesses 50 genotypes for performance in Rabi 2024-25 at Dharwad.
Materials and Methods
The trial was at Main Agricultural Research Station, Dharwad (Zone VIII, red sandy loam soil). Meteorological data for 2024-25 showed average max/min temperatures of 31.17 °C/18.89°C and rainfall 976.10 mm (Appendix II). Fifty genotypes from sources like IIHR, DOGR, NHRDF (Table 1) were used. Seeds sown in October 2024, seedlings transplanted in November to raised beds (1.2 m × 1.0 m) with 15 cm × 10 cm spacing, randomized complete block design, two replications. FYM (25 t/ha) and NPK (125:50:125 kg/ha) applied, with drip irrigation and pest control. Traits like plant height, leaves per plant, leaf area, LAI, maturity days, bolting (%), bulb diameters, shape index, neck thickness, rings per bulb, dry matter, TSS, bulb weight, yield per plot, yield per ha, purple blotch (%), thrips (no./plant). ANOVA as per Fisher and Yates (1963) data analyzed for means, S.Em ±, CD (5%).
| Sl. No. | Genotypes | Source of Collection | Bulb Colour |
|---|---|---|---|
| 1 | Arka Bheem | IIHR, Bangalore | Red |
| 2 | Balichakra-W | Yadgir, (KA) | Light red |
| 3 | Bagdal Local | Bidar, (KA) | Light red |
| 4 | Arka Kalyan | IIHR, Bangalore | Red |
| 5 | Balichakra-R | Yadgir, (KA) | Light red |
| 6 | NHRDF Red | NHRDF, Nashik (MH) | Dark red |
| 7 | Telagi -L | Vijayapur (KA) | Light red |
| 8 | Telagi -W | Vijayapur (KA) | White |
| 9 | Bellary Red | Bellary (KA) | Red |
| 10 | GWO-1 | AAU, Gujurat | White |
| 11 | GJRO-11 | AAU, Gujurat | Red |
| 12 | GJWO-3 | AAU, Gujurat | White |
| 13 | Bhima Red | ICAR-DOGR, Rajgurunagar (MH) | Red |
| 14 | DOGR-1770 | ICAR-DOGR, Rajgurunagar (MH) | Red |
| 15 | DOGR-1760 | ICAR-DOGR, Rajgurunagar (MH) | Light red |
| 16 | DOGR-1761 | ICAR-DOGR, Rajgurunagar (MH) | Dark red |
| 17 | DOGR-1771 | ICAR-DOGR, Rajgurunagar (MH) | Dark red |
| 18 | DOGR-1773 | ICAR-DOGR, Rajgurunagar (MH) | Light red |
| 19 | DOGR-1774 | ICAR-DOGR, Rajgurunagar (MH) | Red |
| 20 | Bhima Super | ICAR-DOGR, Rajgurunagar (MH) | Light red |
| 21 | Bhima Raj | ICAR-DOGR, Rajgurunagar (MH) | Dark red |
| 22 | Bhima Shakti | ICAR-DOGR, Rajgurunagar (MH) | Light red |
| 23 | Bhima Light Red | ICAR-DOGR, Rajgurunagar (MH) | Light red |
| 24 | DOGR-1772 | ICAR-DOGR, Rajgurunagar (MH) | Dark red |
| 25 | DOGR-1769 | ICAR-DOGR, Rajgurunagar (MH) | Light red |
| 26 | DOGR-1768 | ICAR-DOGR, Rajgurunagar (MH) | Dark red |
| 27 | Bhima Dark Red | ICAR-DOGR, Rajgurunagar (MH) | Dark red |
| 28 | Bhima Kiran | ICAR-DOGR, Rajgurunagar (MH) | Light red |
| 29 | W-364 GP | ICAR-DOGR, Rajgurunagar (MH) | White |
| 30 | BhimaShweta | ICAR-DOGR, Rajgurunagar (MH) | White |
| 31 | W-405 | ICAR-DOGR, Rajgurunagar (MH) | White |
| 32 | Bhima Shubra | ICAR-DOGR, Rajgurunagar (MH) | White |
| 33 | Bhima Safed | ICAR-DOGR, Rajgurunagar (MH) | White |
| 34 | W-310-GP | ICAR-DOGR, Rajgurunagar (MH) | White |
| 35 | W-344 | ICAR-DOGR, Rajgurunagar (MH) | White |
| 36 | W-355 | ICAR-DOGR, Rajgurunagar (MH) | White |
| 37 | W-361 | ICAR-DOGR, Rajgurunagar (MH) | White |
| 38 | W-504 | ICAR-DOGR, Rajgurunagar (MH) | White |
| 39 | W-448 | ICAR-DOGR, Rajgurunagar (MH) | White |
| 40 | W-125-GP | ICAR-DOGR, Rajgurunagar (MH) | White |
| 41 | W-210-GP | ICAR-DOGR, Rajgurunagar (MH) | White |
| 42 | W-203-GP | ICAR-DOGR, Rajgurunagar (MH) | White |
| 43 | W-408 | ICAR-DOGR, Rajgurunagar (MH) | White |
| 44 | NHRDF Furasangi | NHRDF, Nashik (MH) | Light red |
| 45 | AFLR | NHRDF, Nashik (MH) | Light red |
| 46 | NHRDF Red-4 | NHRDF, Nashik (MH) | Light red |
| 47 | NHRDF Red-2 | NHRDF, Nashik (MH) | Light red |
| 48 | AFDR | NHRDF, Nashik (MH) | Dark red |
| 49 | Arakera local | Raichur (KA) | Light red |
| 50 | N-53 | Dept. of Agriculture (MH) | Light red |
Table text extracted from the original PDF; superscript letters are shown inline. The original table image is below.
View original table image
Results and Discussion
ANOVA at Dharwad for Rabi 2024-25 showed significant genotypic differences (*) for all traits (Table 2).
| Sl. No. | Source of variation/ parameters | Means | — | — | S.Em ± | CD (5%) |
|---|---|---|---|---|---|---|
| Replication | Genotypes | Error | ||||
| Degrees of freedom | 1 | 49 | 49 | |||
| 1. | Plant height (cm) | 44.72 | 33.87* | 20.70 | 3.22 | 9.14 |
| 2. | Number of leaves per plant | 0.16 | 1.00* | 0.61 | 0.55 | 1.57 |
| 3. | Leaf area (cm2) | 68.70 | 4753.66* | 2183.34 | 33.04 | 93.90 |
| 4. | Leaf area index | 0.00 | 0.21* | 0.10 | 0.22 | 0.63 |
| 5. | Days to maturity (days) | 42.25 | 18.58* | 10.62 | 2.30 | 6.55 |
| 6. | Pre-mature bolting (%) | 0.09 | 2.43* | 0.07 | 0.19 | 0.53 |
| 7. | Bulb polar diameter (cm) | 18.39 | 44.48* | 26.84 | 3.66 | 10.41 |
| 8. | Bulb equatorial diameter (cm) | 47.18 | 25.65* | 15.30 | 2.77 | 7.86 |
| 9. | Bulb shape index | 0.02 | 0.02* | 0.01 | 0.07 | 0.20 |
| 10. | Bulb neck thickness (cm) | 0.02 | 0.03* | 0.02 | 0.09 | 0.26 |
| 11. | Number of rings per bulb | 0.49 | 1.39* | 0.71 | 0.60 | 1.70 |
| 12. | Bulb dry matter content (g) | 4.17 | 3.00* | 1.83 | 0.96 | 2.72 |
| 13. | Total soluble solid (0B) | 0.71 | 3.13* | 1.72 | 0.93 | 2.64 |
| 14. | Average weight of bulb (g) | 18.14 | 106.49* | 61.52 | 5.55 | 15.76 |
| 15. | Bulb yield per plot (kg) | 0.00 | 0.35* | 0.16 | 0.28 | 0.80 |
| 16. | Bulb yield per hectare (t) | 0.42 | 34.87* | 15.65 | 2.80 | 7.95 |
| 17. | Purple blotch incidence | 0.01 | 2.05* | 0.52 | 0.51 | 1.45 |
| 18 | Thrips incidence | 0.06 | 15.44* | 0.39 | 0.44 | 1.25 |
Table text extracted from the original PDF; superscript letters are shown inline. The original table image is below.
View original table image
High genotypic mean squares for leaf area (4753.66), bulb polar diameter (44.48), and yield per ha (34.87) indicate substantial variation. Genotypes varied widely in growth traits (Table 2). Bhima Raj recorded the highest plant height (54.75 cm), while Bhima Light Red had the lowest (38.00 cm). Arka Kalyan and Bhima Safed had the maximum leaves/plant (10.50 and 10.00). DOGR-1769 and N-53 showed the largest leaf area (498.21 cm² and 497.42 cm²) and LAI (3.32). Days to maturity ranged from 87.50 (DOGR-1774) to 100.00 (Balichakra-W, Bhima Kiran, AFLR). Bolting was lowest (0%) in several genotypes like NHRDF Red and GJWO-3. These variations reflect photothermo sensitivity (Thamburaj and Singh, 2019) [14] . High leaf area genotypes like DOGR-1769 align with findings of Verma et al. (2022) [15] , indicating better photosynthetic efficiency. Bulb traits showed significant diversity (Table 3). Telagi-W had the largest polar diameter (52.86 cm), while Bhima Shweta the smallest (34.96 cm). W-504 exhibited the widest equatorial diameter (63.27 cm). Shape index was highest in Balichakra-R and AFDR (1.04).
| Sl. No. | Genotypes | Plant Height (cm) | No. of Leaves/Plant | Leaf Area (cm) | Leaf Area Index | Days to maturity | Bolting (%) |
|---|---|---|---|---|---|---|---|
| 1 | Arka Bheem | 49.62 | 9.00 | 406.08 | 2.71 | 97.50 | 3.50 |
| 2 | Balichakra-W | 52.40 | 8.00 | 455.77 | 3.04 | 100.00 | 1.00 |
| 3 | Bagdal Local | 51.90 | 8.50 | 446.76 | 2.98 | 92.50 | 2.00 |
| 4 | Arka Kalyan | 41.45 | 10.50 | 459.56 | 3.06 | 90.00 | 4.50 |
| 5 | Balichakra-R | 42.90 | 9.00 | 465.29 | 3.10 | 95.00 | 1.00 |
| 6 | NHRDF Red | 46.90 | 8.00 | 331.34 | 2.21 | 97.50 | 0.00 |
| 7 | Telagi -L | 44.10 | 8.00 | 496.67 | 3.31 | 95.00 | 1.00 |
| 8 | Telagi -W | 39.15 | 8.00 | 441.29 | 2.94 | 95.00 | 1.00 |
| 9 | Bellary Red | 51.10 | 8.50 | 471.46 | 3.14 | 95.00 | 1.00 |
| 10 | GWO-1 | 48.90 | 9.00 | 392.48 | 2.62 | 97.50 | 0.00 |
| 11 | GJRO-11 | 50.45 | 9.00 | 375.79 | 2.51 | 97.50 | 1.00 |
| 12 | GJWO-3 | 51.40 | 7.50 | 443.00 | 2.95 | 90.00 | 0.00 |
| 13 | Bhima Red | 43.55 | 8.50 | 387.98 | 2.59 | 92.50 | 2.50 |
| 14 | DOGR-1770 | 51.25 | 8.00 | 380.44 | 2.54 | 92.50 | 1.50 |
| 15 | DOGR-1760 | 49.30 | 9.00 | 357.46 | 2.38 | 90.00 | 4.00 |
| 16 | DOGR-1761 | 52.90 | 8.00 | 375.81 | 2.51 | 92.50 | 0.00 |
| 17 | DOGR-1771 | 49.95 | 8.00 | 354.32 | 2.36 | 95.00 | 1.00 |
| 18 | DOGR-1773 | 52.70 | 7.00 | 421.59 | 2.81 | 92.50 | 0.50 |
| 19 | DOGR-1774 | 44.65 | 9.00 | 385.26 | 2.57 | 87.50 | 2.50 |
| 20 | Bhima Super | 48.50 | 7.50 | 438.25 | 2.92 | 90.00 | 2.00 |
| 21 | Bhima Raj | 54.75 | 8.00 | 468.20 | 3.12 | 92.50 | 2.50 |
| 22 | Bhima Shakti | 49.55 | 9.00 | 473.53 | 3.16 | 92.50 | 0.00 |
| 23 | Bhima Light Red | 38.00 | 9.00 | 458.43 | 3.06 | 97.50 | 0.00 |
| 24 | DOGR-1772 | 42.80 | 8.00 | 470.96 | 3.14 | 95.00 | 0.00 |
| 25 | DOGR-1769 | 48.15 | 9.00 | 498.21 | 3.32 | 97.50 | 0.00 |
| 26 | DOGR-1768 | 47.60 | 8.00 | 428.72 | 2.86 | 92.50 | 2.00 |
| 27 | Bhima Dark Red | 46.90 | 9.00 | 382.77 | 2.55 | 90.00 | 1.00 |
| 28 | Bhima Kiran | 53.05 | 8.00 | 483.18 | 3.22 | 100.00 | 0.00 |
| 29 | W-364 GP | 43.60 | 8.00 | 430.35 | 2.87 | 95.00 | 1.00 |
| 30 | Bhima Shweta | 50.25 | 9.00 | 411.18 | 2.74 | 92.50 | 0.00 |
| 31 | W-405 | 42.60 | 8.00 | 387.62 | 2.58 | 97.50 | 1.00 |
| 32 | Bhima Shubra | 47.25 | 8.00 | 390.94 | 2.61 | 92.50 | 1.00 |
| 33 | Bhima Safed | 53.35 | 10.00 | 390.42 | 2.60 | 97.50 | 2.00 |
| 34 | W-310-GP | 49.20 | 8.00 | 393.45 | 2.62 | 92.50 | 0.00 |
| 35 | W-344 | 43.15 | 8.00 | 388.29 | 2.59 | 97.50 | 0.00 |
| 36 | W-355 | 52.75 | 8.00 | 346.58 | 2.31 | 97.50 | 0.00 |
| 37 | W-361 | 45.30 | 7.00 | 383.98 | 2.56 | 95.00 | 0.00 |
| 38 | W-504 | 46.95 | 8.00 | 352.85 | 2.35 | 97.50 | 0.00 |
| 39 | W-448 | 47.15 | 8.00 | 518.22 | 3.45 | 97.50 | 1.00 |
| 40 | W-125-GP | 44.40 | 8.00 | 441.66 | 2.94 | 97.50 | 0.00 |
| 41 | W-210-GP | 44.05 | 9.00 | 404.49 | 2.70 | 97.50 | 0.00 |
| 42 | W-203-GP | 49.35 | 9.00 | 411.15 | 2.74 | 97.50 | 0.00 |
| 43 | W-408 | 43.80 | 7.50 | 328.07 | 2.19 | 92.50 | 1.00 |
| 44 | NHRDF Furasangi | 47.40 | 7.50 | 434.37 | 2.90 | 97.50 | 1.00 |
| 45 | AFLR | 45.80 | 7.00 | 484.74 | 3.23 | 100.00 | 1.00 |
| 46 | NHRDF Red-4 | 48.90 | 8.00 | 329.26 | 2.20 | 92.50 | 1.00 |
| 47 | NHRDF Red-2 | 48.40 | 9.00 | 400.87 | 2.67 | 95.00 | 2.00 |
| 48 | AFDR | 39.60 | 8.00 | 421.93 | 2.81 | 92.50 | 1.00 |
| 49 | Arakera local | 39.95 | 8.00 | 461.52 | 3.08 | 97.50 | 2.00 |
| 50 | N-53 | 46.00 | 8.00 | 497.42 | 3.32 | 97.50 | 2.00 |
| S.Em ± | 3.22 | 0.55 | 33.04 | 0.22 | 2.30 | 0.19 | |
| CD (5%) | 9.14 | 1.57 | 93.90 | 0.63 | 6.55 | 0.53 | |
| CV | 9.63 | 9.40 | 11.15 | 11.15 | 3.44 | 25.12 |
Table text extracted from the original PDF; superscript letters are shown inline. The original table image is below.
View original table image
Telagi-L had the thinnest neck (0.52 cm), ideal for storage. W-448 had the most rings/bulb (11.00). DOGR-1771 showed high dry matter (18.42 g), and GJWO-3 the highest TSS (15.59 °Brix). Thin neck and high TSS enhance storage life (Gupta et al., 2024) [8] . High dry matter in DOGR-1771 supports dehydration suitability (Saha et al., 2024) [13] . Yield varied from 30.94 t/ha (W-405) to 50.89 t/ha (NHRDF Red-2) (Table 4). High yielders included NHRDF Red-4 (47.72 t/ha), Bhima Raj (46.42 t/ha), and Balichakra-R (44.94 t/ha). Bulb weight was highest in DOGR-1760 (88.45 g). Superior yield in NHRDF lines corroborates Choudhary et al. (2022) and Dikshit et al. (2020) [6,7] , attributed to better bulb size and low bolting. Purple blotch incidence was lowest (0%) in NHRDF Red-4 and NHRDF Red-2, while thrips was minimal in Arakera local (0.51/plant) and W-355 (0.91/plant) (Table 5). High incidence occurred in DOGR-1768 (10.93 thrips) and W-125-GP (12.29 thrips). Low incidence genotypes like NHRDF Red-4 offer resistance potential (Chauhan et al., 2023; Karavina and Murembwa, 2025) [4,9] .
| Sl. No. | Genotypes | Average weight of bulb | Bulb yield per plot (kg) | Bulb yield (t/ ha) |
|---|---|---|---|---|
| 1 | Arka Bheem | 63.43 | 3.34 | 33.37 |
| 2 | Balichakra-W | 57.65 | 3.28 | 32.77 |
| 3 | Bagdal Local | 55.18 | 3.75 | 37.54 |
| 4 | Arka Kalyan | 61.90 | 4.33 | 43.32 |
| 5 | Balichakra-R | 57.38 | 4.49 | 44.94 |
| 6 | NHRDF Red | 69.13 | 3.75 | 37.49 |
| 7 | Telagi -L | 75.35 | 3.93 | 39.33 |
| 8 | Telagi -W | 65.90 | 3.20 | 31.96 |
| 9 | Bellary Red | 60.38 | 4.17 | 41.70 |
| 10 | GWO-1 | 66.85 | 4.14 | 41.36 |
| 11 | GJRO-11 | 56.88 | 4.00 | 39.95 |
| 12 | GJWO-3 | 64.20 | 3.37 | 33.71 |
| 13 | Bhima Red | 61.28 | 4.18 | 41.79 |
| 14 | DOGR-1770 | 69.68 | 3.94 | 39.38 |
| 15 | DOGR-1760 | 88.45 | 4.38 | 43.79 |
| 16 | DOGR-1761 | 69.33 | 4.14 | 41.39 |
| 17 | DOGR-1771 | 54.30 | 3.76 | 37.59 |
| 18 | DOGR-1773 | 61.20 | 3.74 | 37.36 |
| 19 | DOGR-1774 | 66.85 | 4.01 | 40.13 |
| 20 | Bhima Super | 76.90 | 4.01 | 40.15 |
| 21 | Bhima Raj | 69.33 | 4.64 | 46.42 |
| 22 | Bhima Shakti | 74.58 | 4.12 | 41.25 |
| 23 | Bhima Light Red | 57.18 | 4.01 | 40.07 |
| 24 | DOGR-1772 | 60.43 | 4.18 | 41.83 |
| 25 | DOGR-1769 | 65.45 | 4.10 | 41.00 |
| 26 | DOGR-1768 | 78.10 | 3.34 | 33.38 |
| 27 | Bhima Dark Red | 68.98 | 3.51 | 35.13 |
| 28 | Bhima Kiran | 65.25 | 3.98 | 39.81 |
| 29 | W-364 GP | 71.18 | 4.03 | 40.29 |
| 30 | Bhima Shweta | 54.60 | 3.88 | 38.78 |
| 31 | W-405 | 58.80 | 3.09 | 30.94 |
| 32 | Bhima Shubra | 67.05 | 3.52 | 35.20 |
| 33 | Bhima Safed | 54.95 | 3.89 | 38.94 |
| 34 | W-310-GP | 66.00 | 3.47 | 34.73 |
| 35 | W-344 | 62.28 | 4.12 | 41.17 |
| 36 | W-355 | 77.83 | 4.10 | 41.03 |
| 37 | W-361 | 68.73 | 3.77 | 37.74 |
| 38 | W-504 | 53.20 | 3.37 | 33.69 |
| 39 | W-448 | 58.75 | 4.01 | 40.06 |
| 40 | W-125-GP | 69.70 | 3.58 | 35.81 |
| 41 | W-210-GP | 59.18 | 3.41 | 34.12 |
| 42 | W-203-GP | 61.95 | 3.76 | 37.60 |
| 43 | W-408 | 65.85 | 3.97 | 39.70 |
| 44 | NHRDF Furasangi | 72.35 | 4.45 | 44.49 |
| 45 | AFLR | 64.85 | 4.45 | 44.51 |
| 46 | NHRDF Red-4 | 73.28 | 4.77 | 47.72 |
| 47 | NHRDF Red-2 | 66.50 | 5.09 | 50.89 |
| 48 | AFDR | 61.23 | 3.89 | 38.93 |
| 49 | Arakera local | 64.63 | 3.66 | 36.64 |
| 50 | N-53 | 57.70 | 3.57 | 35.68 |
| S.Em ± | 5.55 | 0.28 | 2.80 | |
| CD (5%) | 15.76 | 0.80 | 7.95 | |
| CV | 12.06 | 10.11 | 10.11 |
Table text extracted from the original PDF; superscript letters are shown inline. The original table image is below.
View original table image
| Sl. No. | Genotypes | Bulb polar diameter | Bulb equatorial diameter | Bulb shape index | Bulb neck thickness | Bulb dry matter | TSS | Rings per bulb |
|---|---|---|---|---|---|---|---|---|
| 1 | Arka Bheem | 42.64 | 49.15 | 0.87 | 0.93 | 13.39 | 13.75 | 8.50 |
| 2 | Balichakra-W | 39.94 | 48.04 | 0.83 | 1.04 | 15.83 | 15.34 | 7.50 |
| 3 | Bagdal Local | 44.94 | 53.02 | 0.85 | 0.82 | 15.37 | 13.34 | 8.50 |
| 4 | Arka Kalyan | 50.32 | 52.46 | 0.96 | 0.77 | 18.18 | 13.76 | 9.50 |
| 5 | Balichakra-R | 50.36 | 49.02 | 1.04 | 0.77 | 16.46 | 12.39 | 8.50 |
| 6 | NHRDF Red | 45.87 | 49.62 | 0.93 | 0.76 | 16.73 | 15.43 | 9.50 |
| 7 | Telagi -L | 49.86 | 50.57 | 0.98 | 0.52 | 15.49 | 12.81 | 7.50 |
| 8 | Telagi -W | 52.86 | 53.72 | 0.98 | 0.87 | 14.77 | 12.07 | 9.50 |
| 9 | Bellary Red | 44.41 | 46.27 | 0.95 | 0.79 | 15.47 | 13.13 | 8.50 |
| 10 | GWO-1 | 40.09 | 52.52 | 0.76 | 0.73 | 16.19 | 12.97 | 9.50 |
| 11 | GJRO-11 | 43.36 | 52.88 | 0.82 | 0.83 | 15.83 | 14.85 | 7.50 |
| 12 | GJWO-3 | 44.96 | 54.14 | 0.83 | 0.94 | 15.37 | 15.59 | 10.00 |
| 13 | Bhima Red | 37.62 | 54.63 | 0.68 | 0.91 | 14.72 | 11.87 | 7.50 |
| 14 | DOGR-1770 | 44.78 | 55.15 | 0.81 | 0.69 | 14.13 | 10.29 | 8.50 |
| 15 | DOGR-1760 | 44.64 | 56.05 | 0.80 | 0.90 | 12.73 | 11.19 | 7.50 |
| 16 | DOGR-1761 | 49.66 | 54.16 | 0.92 | 0.93 | 16.14 | 10.97 | 8.50 |
| 17 | DOGR-1771 | 47.35 | 57.38 | 0.83 | 0.75 | 18.42 | 13.60 | 7.50 |
| 18 | DOGR-1773 | 50.76 | 55.20 | 0.92 | 1.00 | 13.41 | 12.76 | 8.50 |
| 19 | DOGR-1774 | 42.43 | 50.25 | 0.85 | 0.83 | 14.47 | 12.24 | 8.50 |
| 20 | Bhima Super | 48.13 | 53.88 | 0.89 | 0.98 | 14.11 | 13.54 | 7.50 |
| 21 | Bhima Raj | 51.28 | 54.01 | 0.95 | 1.07 | 15.28 | 10.87 | 7.50 |
| 22 | Bhima Shakti | 50.08 | 54.18 | 0.92 | 1.00 | 17.19 | 13.26 | 7.50 |
| 23 | Bhima Light Red | 49.55 | 52.85 | 0.94 | 0.88 | 14.74 | 12.65 | 9.50 |
| 24 | DOGR-1772 | 50.63 | 55.81 | 0.91 | 0.95 | 13.46 | 13.76 | 7.50 |
| 25 | DOGR-1769 | 49.09 | 50.17 | 0.99 | 0.91 | 15.33 | 11.13 | 9.50 |
| 26 | DOGR-1768 | 42.82 | 45.74 | 0.94 | 0.81 | 14.61 | 11.03 | 10.00 |
| 27 | Bhima Dark Red | 37.43 | 50.32 | 0.75 | 0.83 | 15.97 | 12.98 | 9.50 |
| 28 | Bhima Kiran | 42.45 | 48.66 | 0.88 | 0.93 | 14.82 | 12.03 | 7.50 |
| 29 | W-364 GP | 37.17 | 55.36 | 0.67 | 0.90 | 14.78 | 12.39 | 9.50 |
| 30 | Bhima Shweta | 34.96 | 50.42 | 0.71 | 0.84 | 14.20 | 14.39 | 10.00 |
| 31 | W-405 | 38.49 | 47.13 | 0.82 | 0.93 | 15.86 | 11.65 | 9.50 |
| 32 | Bhima Shubra | 44.14 | 46.01 | 0.96 | 0.71 | 15.17 | 14.31 | 9.50 |
| 33 | Bhima Safed | 37.54 | 47.04 | 0.81 | 0.84 | 15.14 | 13.76 | 7.50 |
| 34 | W-310-GP | 39.56 | 55.39 | 0.71 | 1.02 | 16.59 | 12.29 | 8.50 |
| 35 | W-344 | 43.31 | 53.42 | 0.81 | 0.76 | 15.35 | 11.79 | 9.50 |
| 36 | W-355 | 41.62 | 54.13 | 0.77 | 1.15 | 16.27 | 12.34 | 9.50 |
| 37 | W-361 | 41.48 | 58.35 | 0.71 | 1.07 | 15.36 | 14.07 | 9.50 |
| 38 | W-504 | 46.17 | 63.27 | 0.73 | 1.08 | 14.76 | 14.33 | 9.50 |
| 39 | W-448 | 47.93 | 56.36 | 0.85 | 0.84 | 16.28 | 12.76 | 11.00 |
| 40 | W-125-GP | 42.84 | 57.51 | 0.75 | 0.75 | 15.46 | 13.65 | 7.00 |
| 41 | W-210-GP | 45.27 | 56.67 | 0.80 | 0.86 | 15.67 | 13.54 | 9.50 |
| 42 | W-203-GP | 40.86 | 50.47 | 0.81 | 0.69 | 18.81 | 13.02 | 8.50 |
| 43 | W-408 | 39.06 | 51.92 | 0.75 | 0.94 | 15.61 | 12.36 | 9.50 |
| 44 | NHRDF Furasangi | 49.73 | 51.31 | 0.97 | 0.76 | 16.05 | 13.81 | 8.50 |
| 45 | AFLR | 51.02 | 50.46 | 1.02 | 0.72 | 14.39 | 13.13 | 9.50 |
| 46 | NHRDF Red-4 | 42.34 | 50.26 | 0.84 | 0.88 | 15.33 | 12.55 | 10.00 |
| 47 | NHRDF Red-2 | 41.25 | 48.89 | 0.85 | 0.92 | 13.86 | 11.92 | 10.00 |
| 48 | AFDR | 48.33 | 55.60 | 1.04 | 0.78 | 13.97 | 11.34 | 9.50 |
| 49 | Arakera local | 38.39 | 49.80 | 0.77 | 0.70 | 15.17 | 11.71 | 7.50 |
| 50 | N-53 | 51.50 | 52.12 | 0.91 | 0.84 | 15.00 | 14.66 | 8.50 |
| S.Em ± | 3.66 | 2.77 | 0.07 | 0.09 | 0.96 | 0.93 | 0.60 | |
| CD (5%) | 10.41 | 7.86 | 0.20 | 0.26 | 2.72 | 2.64 | 1.70 | |
| CV | 11.61 | 7.46 | 11.35 | 15.01 | 8.80 | 10.18 | 10.32 |
Table text extracted from the original PDF; superscript letters are shown inline. The original table image is below.
View original table image
Figures and tables from the paper
| Sl. No. | Genotypes | Bulb colour | Purple blotch (%) | Thrips |
|---|---|---|---|---|
| 1 | Arka Bheem | Red | 3.50 | 4.45 |
| 2 | Balichakra-W | Light red | 2.00 | 5.98 |
| 3 | Bagdal Local | Light red | 2.50 | 5.02 |
| 4 | Arka Kalyan | Red | 3.50 | 2.29 |
| 5 | Balichakra-R | Light red | 1.50 | 3.88 |
| 6 | NHRDF Red | Dark red | 2.00 | 4.67 |
| 7 | Telagi -L | Light red | 1.50 | 3.65 |
| 8 | Telagi -W | White | 3.00 | 5.57 |
| 9 | Bellary Red | Red | 2.00 | 1.59 |
| 10 | GWO-1 | White | 3.50 | 4.34 |
| 11 | GJRO-11 | Red | 4.00 | 5.85 |
| 12 | GJWO-3 | White | 3.50 | 4.30 |
| 13 | Bhima Red | Red | 3.50 | 5.19 |
| 14 | DOGR-1770 | Red | 3.00 | 4.61 |
| 15 | DOGR-1760 | Light red | 3.00 | 4.16 |
| 16 | DOGR-1761 | Dark red | 3.50 | 3.75 |
| 17 | DOGR-1771 | Dark red | 2.50 | 3.93 |
| 18 | DOGR-1773 | Light red | 2.50 | 1.63 |
| 19 | DOGR-1774 | Red | 3.00 | 7.99 |
| 20 | Bhima Super | Light red | 4.00 | 2.08 |
| 21 | Bhima Raj | Dark red | 3.50 | 2.07 |
| 22 | Bhima Shakti | Light red | 2.00 | 4.30 |
| 23 | Bhima Light Red | Light red | 1.00 | 1.97 |
| 24 | DOGR-1772 | Dark red | 2.50 | 1.91 |
| 25 | DOGR-1769 | Light red | 1.00 | 8.35 |
| 26 | DOGR-1768 | Dark red | 2.00 | 10.93 |
| 27 | Bhima Dark Red | Dark red | 1.00 | 6.40 |
| 28 | Bhima Kiran | Light red | 2.50 | 7.99 |
| 29 | W-364 GP | White | 3.50 | 6.26 |
| 30 | Bhima Shweta | White | 3.00 | 3.99 |
| 31 | W-405 | White | 3.50 | 11.78 |
| 32 | Bhima Shubra | White | 2.00 | 1.73 |
| 33 | Bhima Safed | White | 3.00 | 7.35 |
| 34 | W-310-GP | White | 2.50 | 3.09 |
| 35 | W-344 | White | 2.50 | 3.32 |
| 36 | W-355 | White | 3.00 | 0.91 |
| 37 | W-361 | White | 2.50 | 2.01 |
| 38 | W-504 | White | 2.50 | 8.94 |
| 39 | W-448 | White | 3.00 | 6.32 |
| 40 | W-125-GP | White | 2.50 | 12.29 |
| 41 | W-210-GP | White | 3.00 | 8.41 |
| 42 | W-203-GP | White | 3.50 | 8.09 |
| 43 | W-408 | White | 2.00 | 5.26 |
| 44 | NHRDF Furasangi | Light red | 1.00 | 1.21 |
| 45 | AFLR | Light red | 1.00 | 7.66 |
| 46 | NHRDF Red-4 | Light red | 0.00 | 3.35 |
| 47 | NHRDF Red-2 | Light red | 0.00 | 4.25 |
| 48 | AFDR | Dark red | 2.00 | 5.15 |
| 49 | Arakera local | Light red | 0.50 | 0.51 |
| 50 | N-53 | Light red | 1.00 | 6.48 |
| S.Em ± | 0.51 | 0.44 | ||
| CD (5%) | 1.45 | 1.25 | ||
| CV | 29.93 | 12.61 |
Table text extracted from the original PDF; superscript letters are shown inline. The original table image is below.
View original table image
References
15 in the original paper- Anonymous. Horticultural Statistics at a Glance. Ministry of Agriculture, India; 2024.
- Best K. Onion production and utilization: a global perspective. Acta Hortic. 2000;43(1):15-22.
- Chandel RS, Kumar S, Arora R, Bal A, Murty VK. Genetic diversity in Indian onion (Allium cepa L.) germplasm for bulb yield and quality traits. Indian J Agric Sci. 2024;94(6):632-637.
- Chauhan SSA, Islam S, Prasad L, Singh S, Ellur RK, Tomar BS. Screening of onion (Allium cepa) genotypes to find out novel resistant source against purple blotch (Alternaria porri). Indian J Agric Sci. 2023;93(11):1208-1213.
- Chattoo MA, Ali A, Kamaluddin. Genetic variability, interrelationship and path analysis for yield and yield related traits in onion (Allium cepa L.) under temperate condition in Kashmir Valley. Plant Arch. 2015;15(2):1161-1165.
- Choudhary ML, Soni RL, Kaushik RA. Evaluation of onion (Allium cepa) varieties for their suitability in tribal area of Dungarpur, Rajasthan. Curr Hortic. 2022;10(2):48-51.
- Dikshit A, Pandey NK, Tiwari D, Chauhan AK. Evaluation of onion (Allium cepa L.) varieties for its suitability in Bundelkhand region. J Krishi Vigyan. 2020;9(1):73-76.
- Gupta AJ, Benke A, Gorrepati K, Mahajan V, Singh M. Trait association and variability study for biochemical and yield related traits in onion (Allium cepa L.). Veg Sci. 2024;51(1):49-55.
- Karavina C, Murembwa R. Screening of onion (Allium cepa L.) varieties for resistance to onion thrips (Thrips tabaci Lindeman) (Thysanoptera: Thripidae) infestation. Afr J Agric Res. 2025;21(2):139-146.
- Malik G, Shah RA, Shabir A, Dinkar V, Mir JI, Sharma OC. Evaluation of long-day onion (Allium cepa L.) genotypes for yield and quality traits under temperate conditions of Kashmir Valley in India. Indian J Plant Genet Resour. 2024;37(2):232-245.
- McCollum GD. Onion and allies. In: Simmonds NW, editor. Evolution of Crop Plants. London: Longman; 1976. p. 186-190.
- Rani KS, Shree S, Singh VK, Kumar A, Rajak J. Studies on genetic variability and heritability in bulb onion (Allium cepa L.) in the South-Eastern plains of Bihar, India. Ecol Environ Conserv. 2024;30:51095113.
- Saha P, Sharangi AB, Sengupta S, Thapa U, Singh AP, Chatterjee S, Chattopadhyay A. Breeding potential of red-and white-skinned onion (Allium cepa L.) genotypes for economic traits using multivariate analysis. Int J Veg Sci. 2024;31(1):5-23.
- Thamburaj S, Singh N. Textbook of Vegetable Crops. New Delhi: Oxford and IBH Publishing Co Pvt Ltd; 2019. p. 210-225.
- Verma AK, Singh PP, Singh D, Saroj PL, Singh M. Performance evaluation and scope of onion improvement under hot arid conditions. Indian J Hortic. 2022;79(2):202-207.